Most common settings for foodborne outbreaks in Alaska
New Africa // Shutterstock
- Outbreaks reported, 2010-2022: 1 (1.8% of all incidents)
- Illnesses reported: 17 (3.4%)
- Hospitalizations reported: 2 (3.8%)
- Illnesses reported: 17 (3.4%)
- Hospitalizations reported: 2 (3.8%)
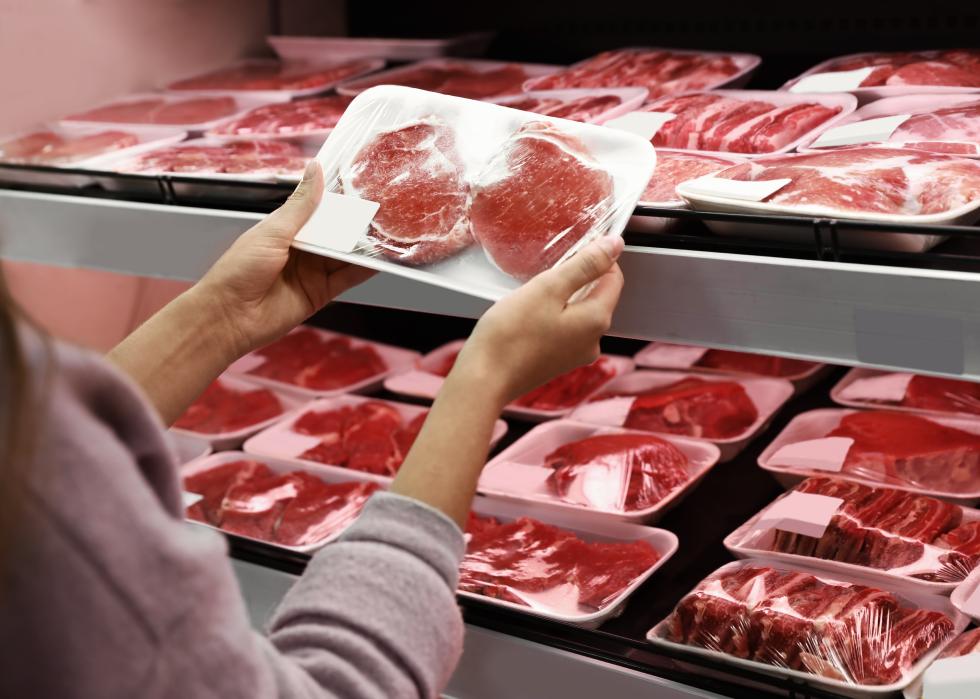
#5. Grocery stores
No Automated Backlink
Off

Lee Reese // Shutterstock
- Outbreaks reported, 2010-2022: 2 (3.5% of all incidents)
- Illnesses reported: 5 (1.0%)
- Hospitalizations reported: 1 (1.9%)
- Illnesses reported: 5 (1.0%)
- Hospitalizations reported: 1 (1.9%)
#4. Festivals or fairs
No Automated Backlink
Off

Olesia Bilkei // Shutterstock
- Outbreaks reported, 2010-2022: 2 (3.5% of all incidents)
- Illnesses reported: 6 (1.2%)
- Hospitalizations reported: 0 (0.0%)
- Illnesses reported: 6 (1.2%)
- Hospitalizations reported: 0 (0.0%)
#3. Camps
No Automated Backlink
Off

Serghei Starus // Shutterstock
- Outbreaks reported, 2010-2022: 11 (19.3% of all incidents)
- Illnesses reported: 111 (22.0%)
- Hospitalizations reported: 3 (5.8%)
- Illnesses reported: 111 (22.0%)
- Hospitalizations reported: 3 (5.8%)
#2. Sit-down restaurants
No Automated Backlink
Off

Ingrid Balabanova // Shutterstock
- Outbreaks reported, 2010-2022: 25 (43.9% of all incidents)
- Illnesses reported: 175 (34.7%)
- Hospitalizations reported: 35 (67.3%)
- Illnesses reported: 175 (34.7%)
- Hospitalizations reported: 35 (67.3%)
This story features data reporting by Wade Zhou, writing by Cynthia Rebolledo, and is part of a series utilizing data automation across 50 states and Washington D.C.
#1. Private homes
No Automated Backlink
Off

Masson // Shutterstock