Counties with the most homes selling under list price in Arizona
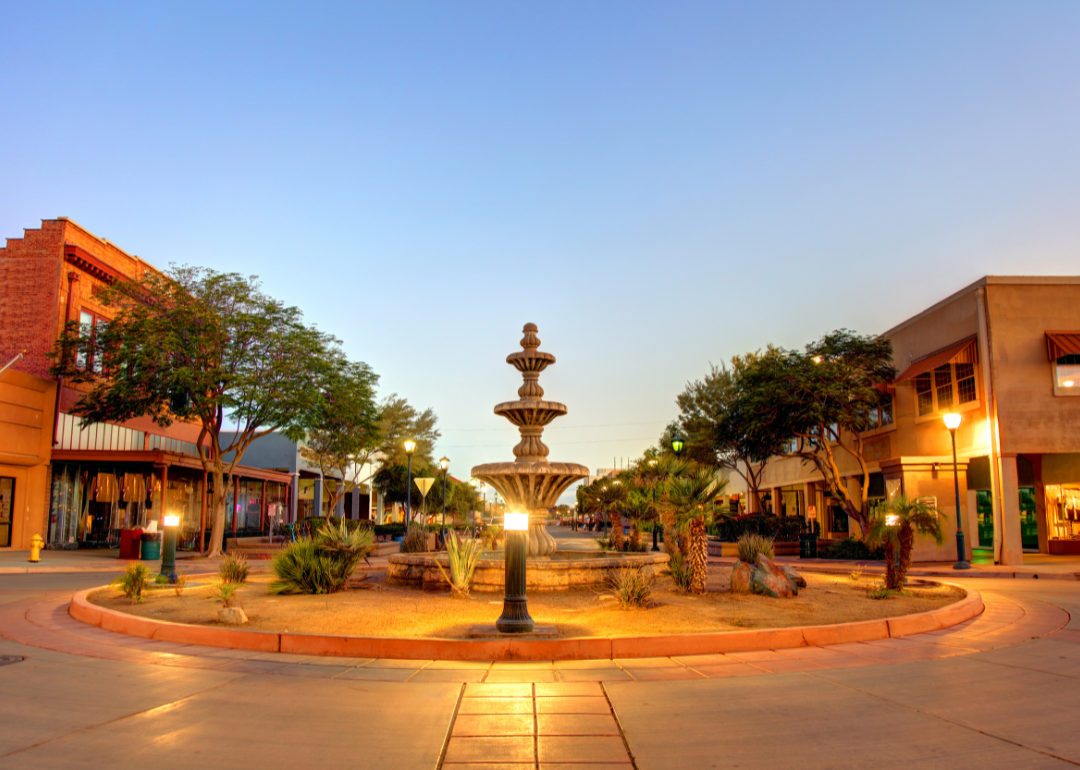
- Average price difference: 1.18% below list
-- Median list price: $327,000
-- Median sale price: $290,000
- Total homes sold: 178
-- Share that sold above list: 23.6%
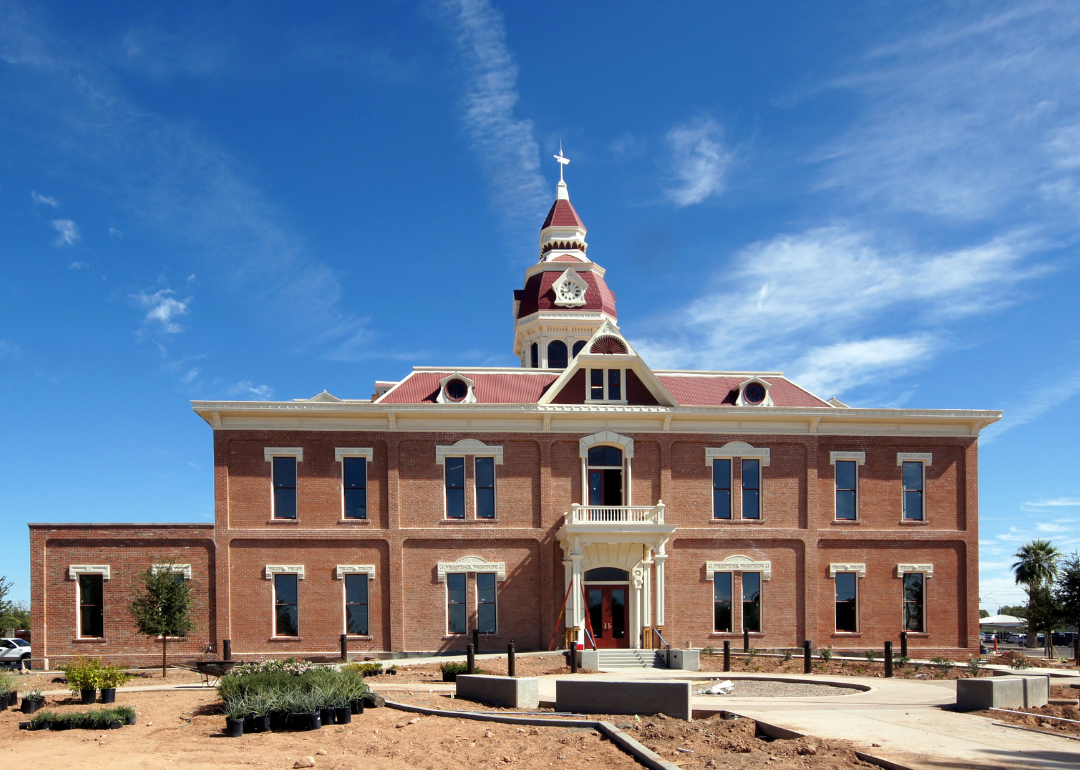
- Average price difference: 1.28% below list
-- Median list price: $390,000
-- Median sale price: $375,000
- Total homes sold: 928
-- Share that sold above list: 15.3%
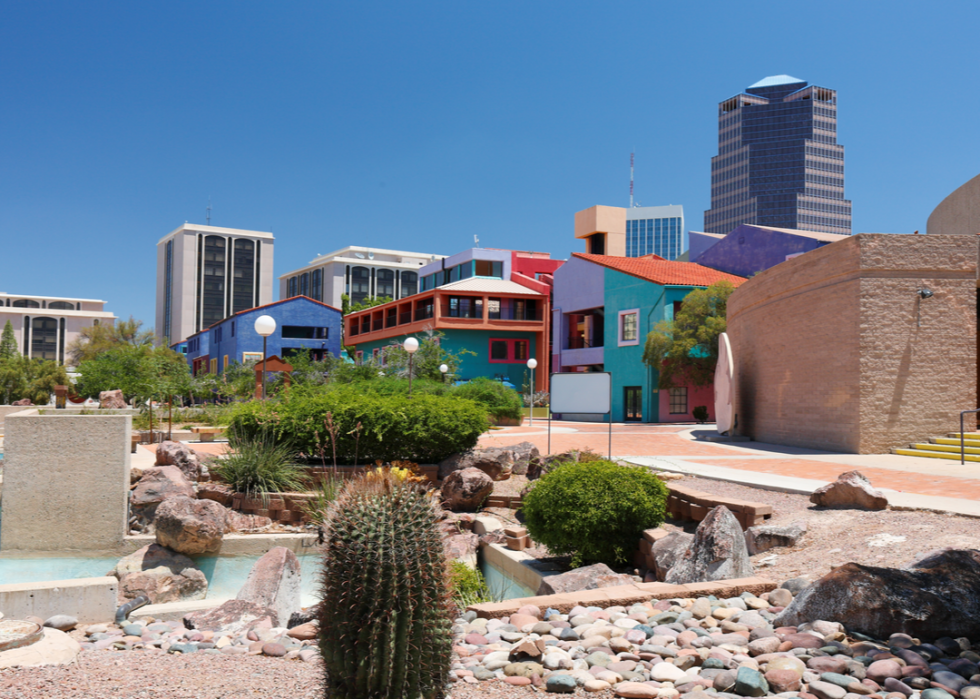
- Average price difference: 1.40% below list
-- Median list price: $385,000
-- Median sale price: $375,000
- Total homes sold: 1,223
-- Share that sold above list: 18.1%

- Average price difference: 1.53% below list
-- Median list price: $725,000
-- Median sale price: $620,000
- Total homes sold: 115
-- Share that sold above list: 18.3%

- Average price difference: 1.65% below list
-- Median list price: $510,000
-- Median sale price: $481,625
- Total homes sold: 5,283
-- Share that sold above list: 16.5%
- Average price difference: 2.25% below list
-- Median list price: $389,900
-- Median sale price: $369,900
- Total homes sold: 335
-- Share that sold above list: 11.3%

- Average price difference: 2.70% below list
-- Median list price: $650,000
-- Median sale price: $539,000
- Total homes sold: 305
-- Share that sold above list: 10.5%

- Average price difference: 2.84% below list
-- Median list price: $318,450
-- Median sale price: $270,500
- Total homes sold: 132
-- Share that sold above list: 11.4%
This story features data reporting and writing by Elena Cox and is part of a series utilizing data automation across 28 states.
