Counties with the most bridges in dire need of repair in Arkansas
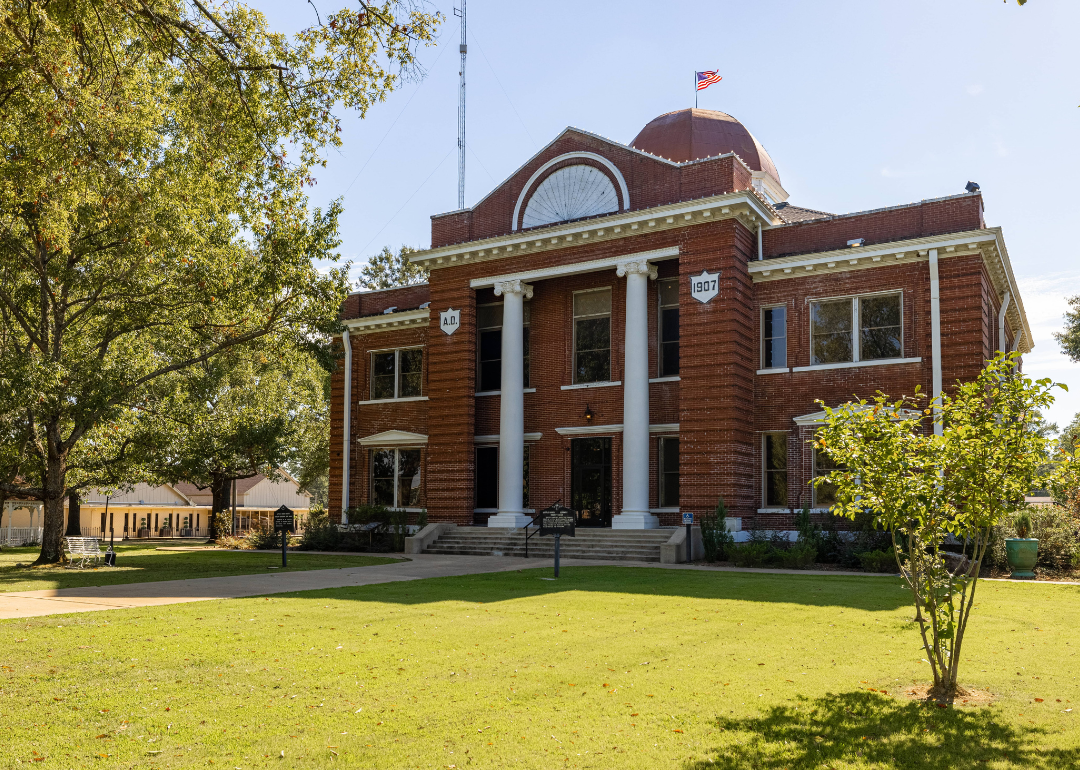
- Bridges in poor condition: 7.1% (6 of 84 bridges)
- Square meters of bridges in poor condition: 8.4% (5,039 of 60,222 square meters of bridges)
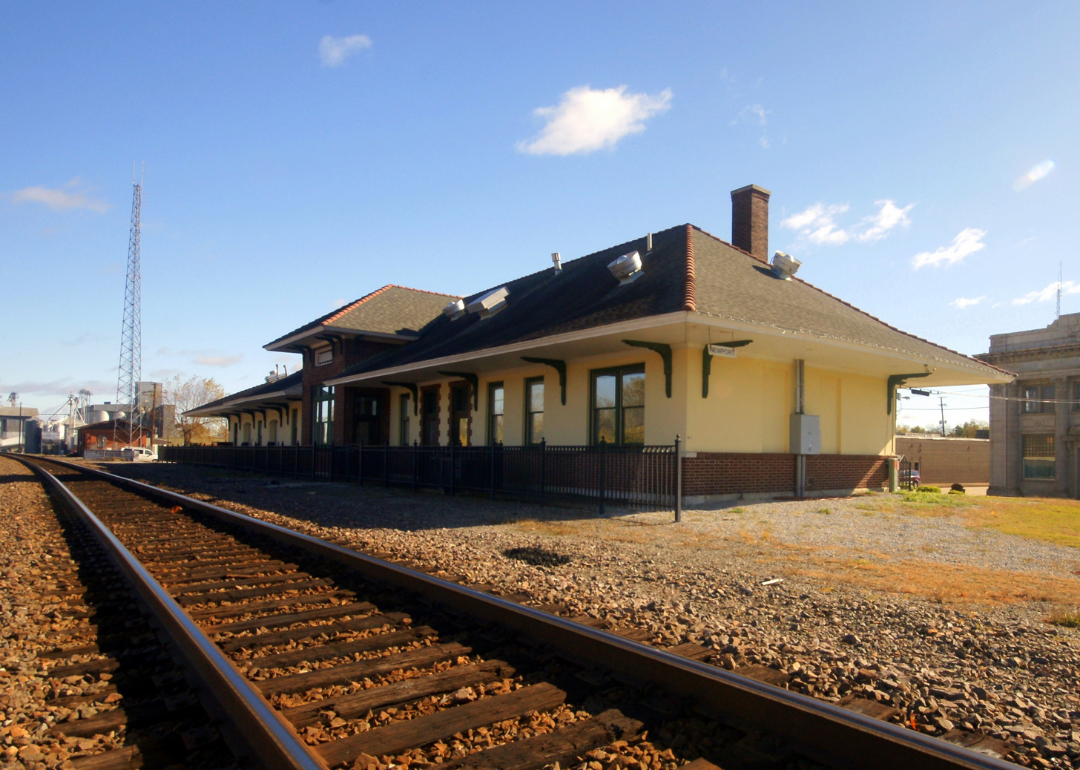
- Bridges in poor condition: 8.1% (11 of 136 bridges)
- Square meters of bridges in poor condition: 9.1% (11,655 of 128,647 square meters of bridges)

- Bridges in poor condition: 8.5% (7 of 82 bridges)
- Square meters of bridges in poor condition: 2.7% (2,945 of 108,672 square meters of bridges)

- Bridges in poor condition: 8.9% (8 of 90 bridges)
- Square meters of bridges in poor condition: 2.4% (3,771 of 155,809 square meters of bridges)
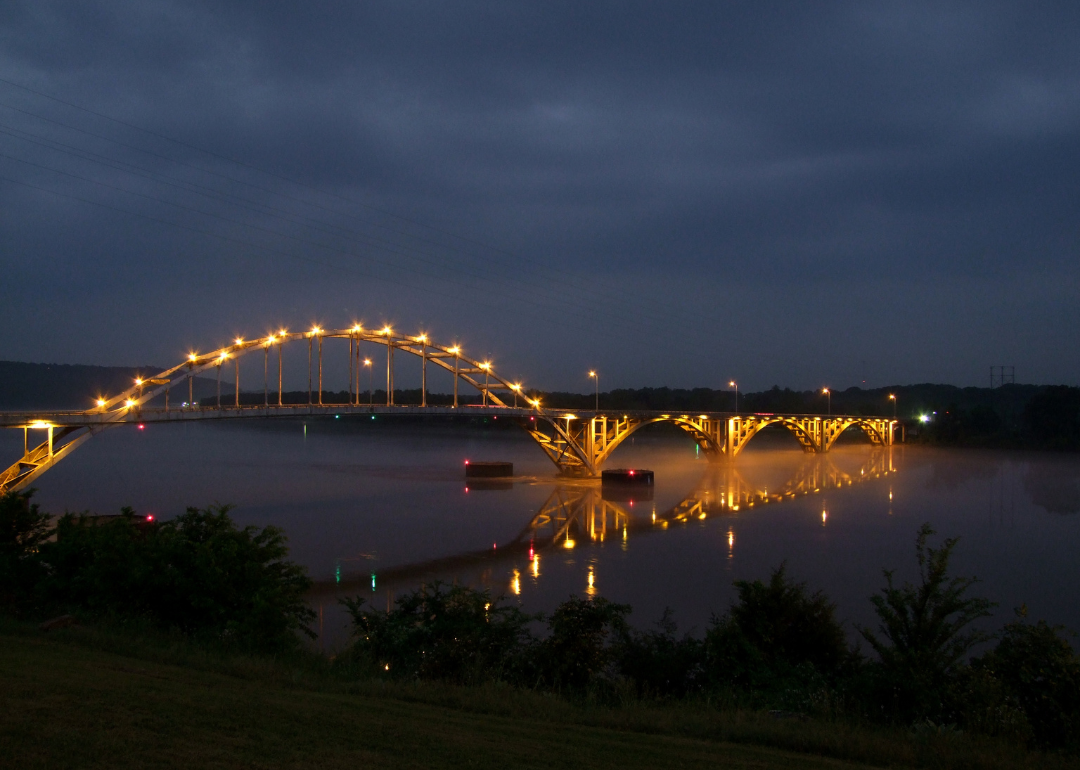
- Bridges in poor condition: 9.0% (13 of 144 bridges)
- Square meters of bridges in poor condition: 5.9% (2,569 of 43,246 square meters of bridges)
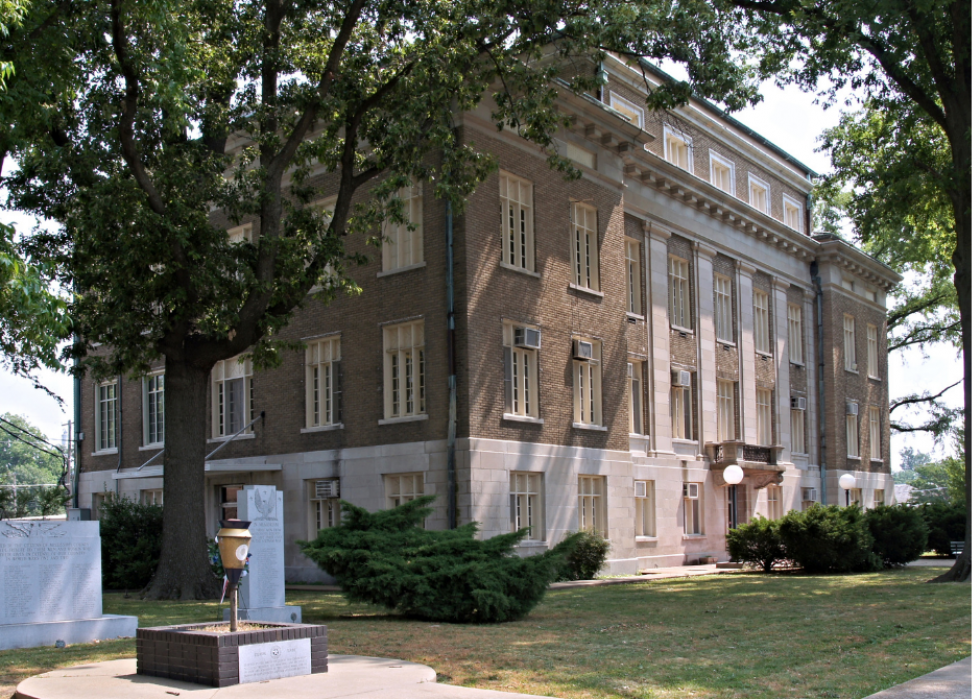
- Bridges in poor condition: 9.0% (28 of 310 bridges)
- Square meters of bridges in poor condition: 8.6% (11,988 of 140,107 square meters of bridges)
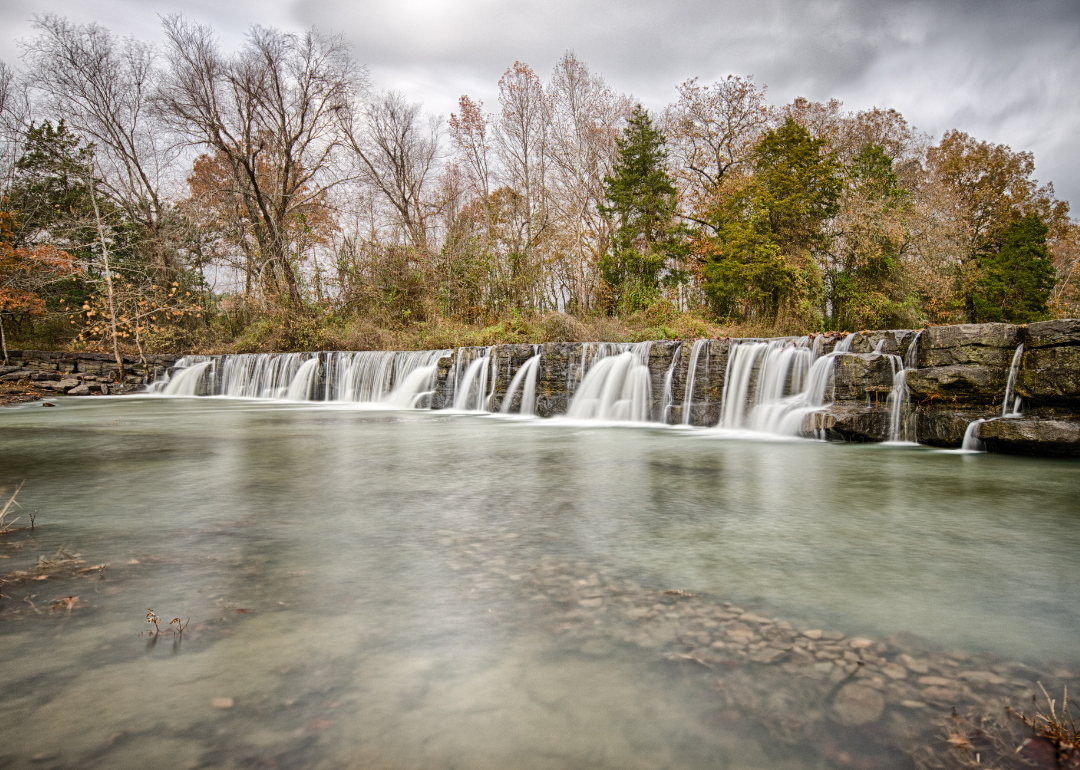
- Bridges in poor condition: 9.3% (23 of 248 bridges)
- Square meters of bridges in poor condition: 6.6% (14,117 of 214,377 square meters of bridges)
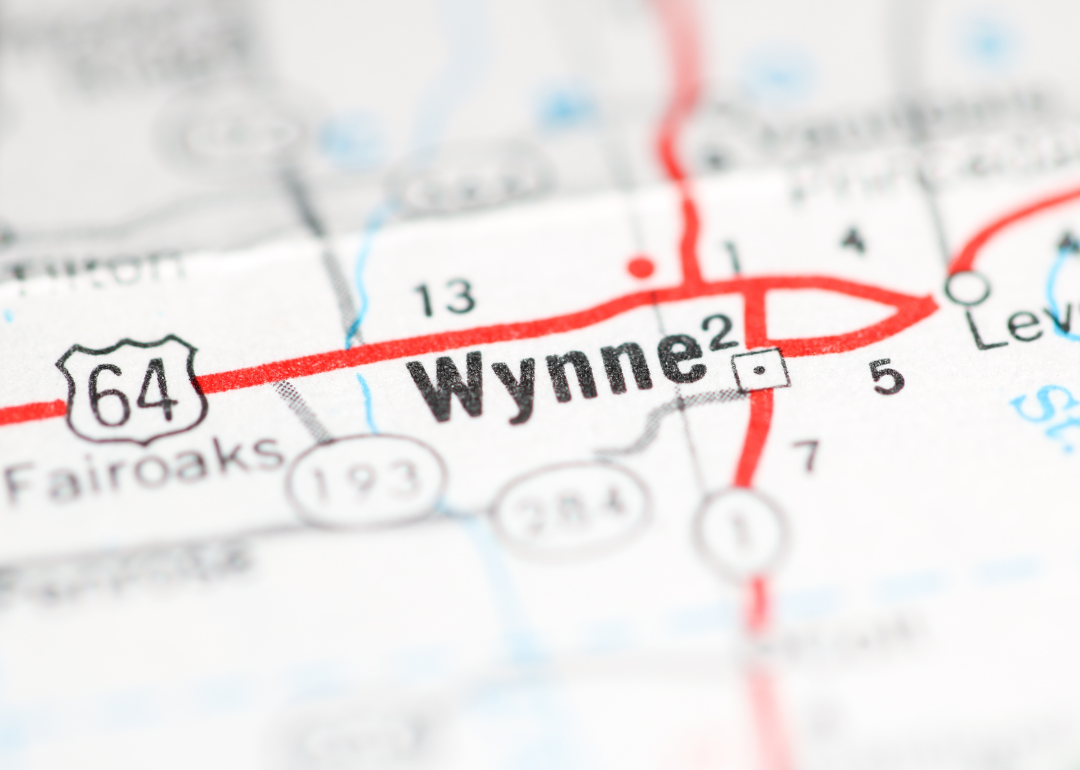
- Bridges in poor condition: 9.4% (12 of 127 bridges)
- Square meters of bridges in poor condition: 8.5% (3,640 of 42,677 square meters of bridges)

- Bridges in poor condition: 9.6% (8 of 83 bridges)
- Square meters of bridges in poor condition: 10.9% (4,916 of 45,090 square meters of bridges)
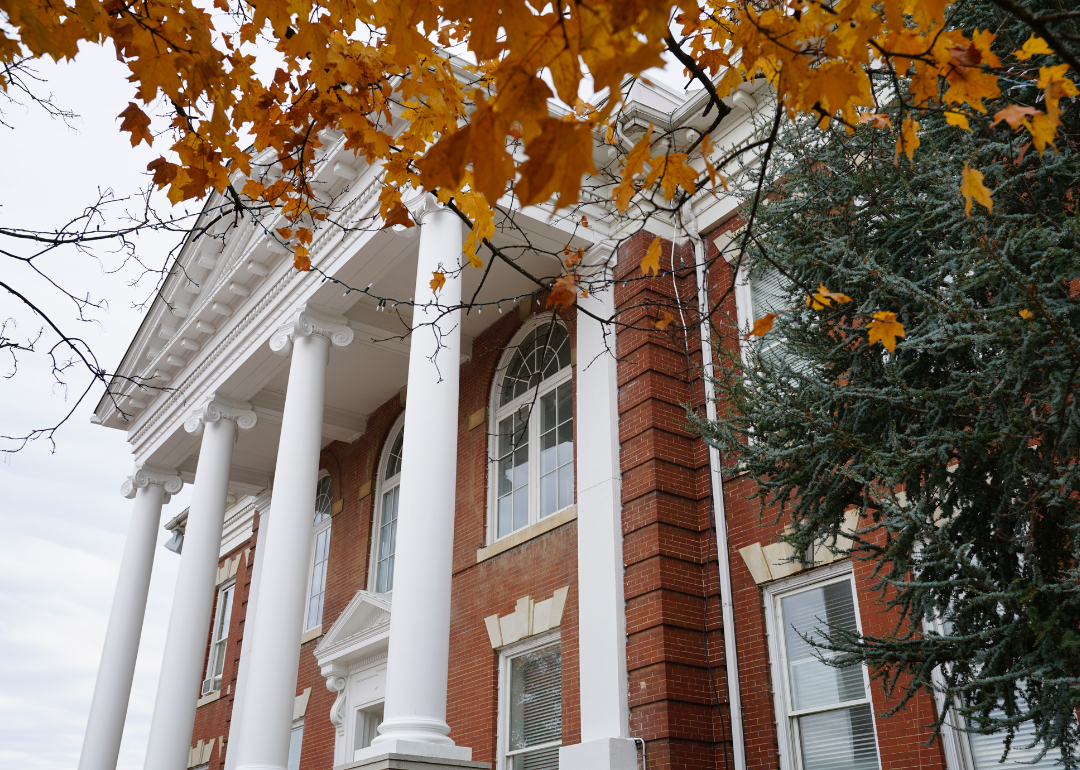
- Bridges in poor condition: 9.9% (15 of 152 bridges)
- Square meters of bridges in poor condition: 8.4% (5,459 of 65,111 square meters of bridges)

- Bridges in poor condition: 10.2% (9 of 88 bridges)
- Square meters of bridges in poor condition: 5.7% (5,133 of 89,389 square meters of bridges)
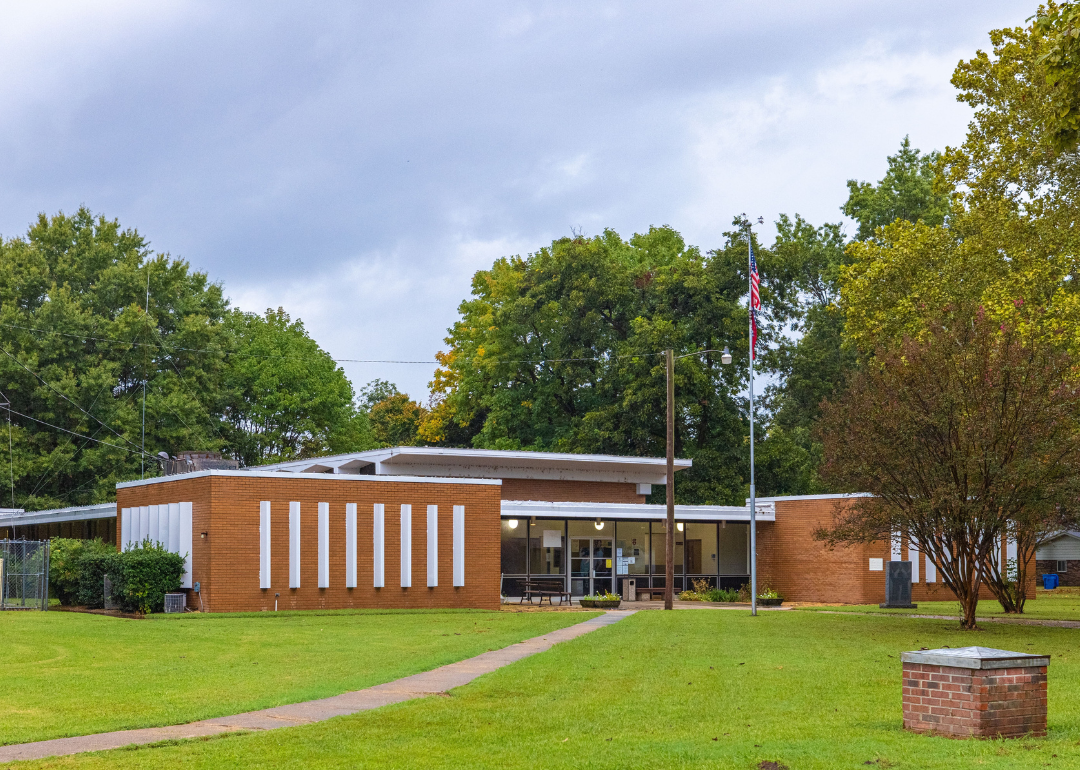
- Bridges in poor condition: 10.4% (21 of 202 bridges)
- Square meters of bridges in poor condition: 14.7% (7,613 of 51,691 square meters of bridges)
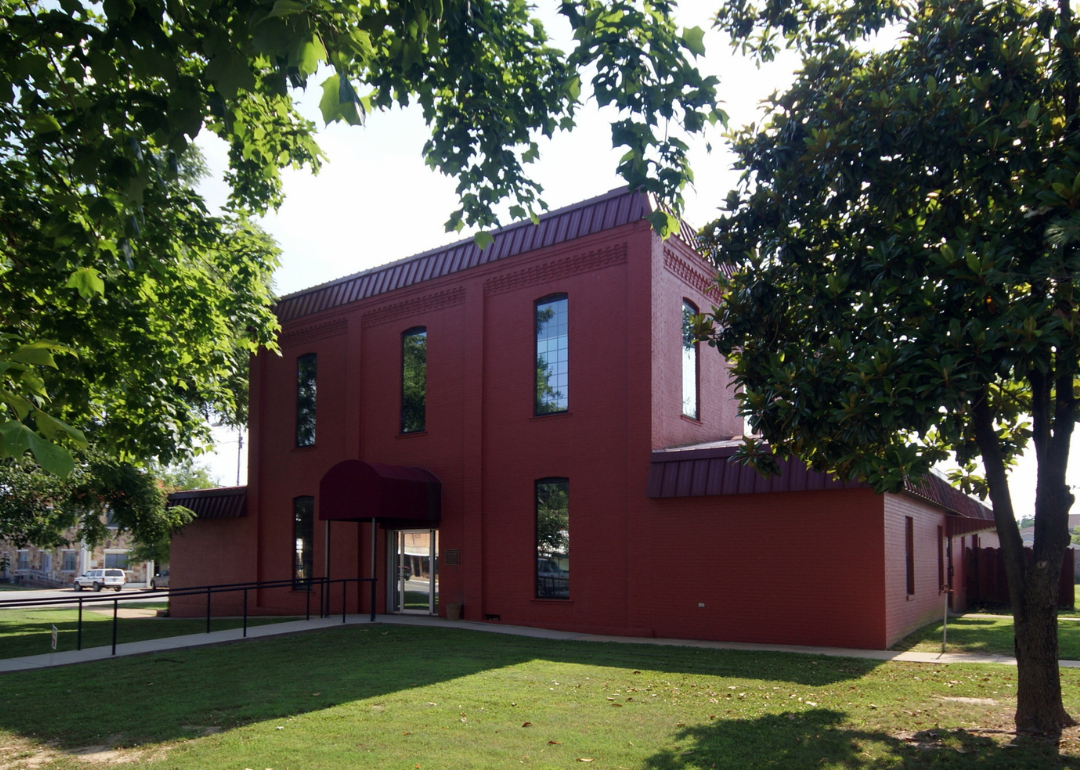
- Bridges in poor condition: 10.5% (11 of 105 bridges)
- Square meters of bridges in poor condition: 9.0% (2,707 of 29,969 square meters of bridges)

- Bridges in poor condition: 11.8% (15 of 127 bridges)
- Square meters of bridges in poor condition: 7.4% (7,815 of 105,307 square meters of bridges)
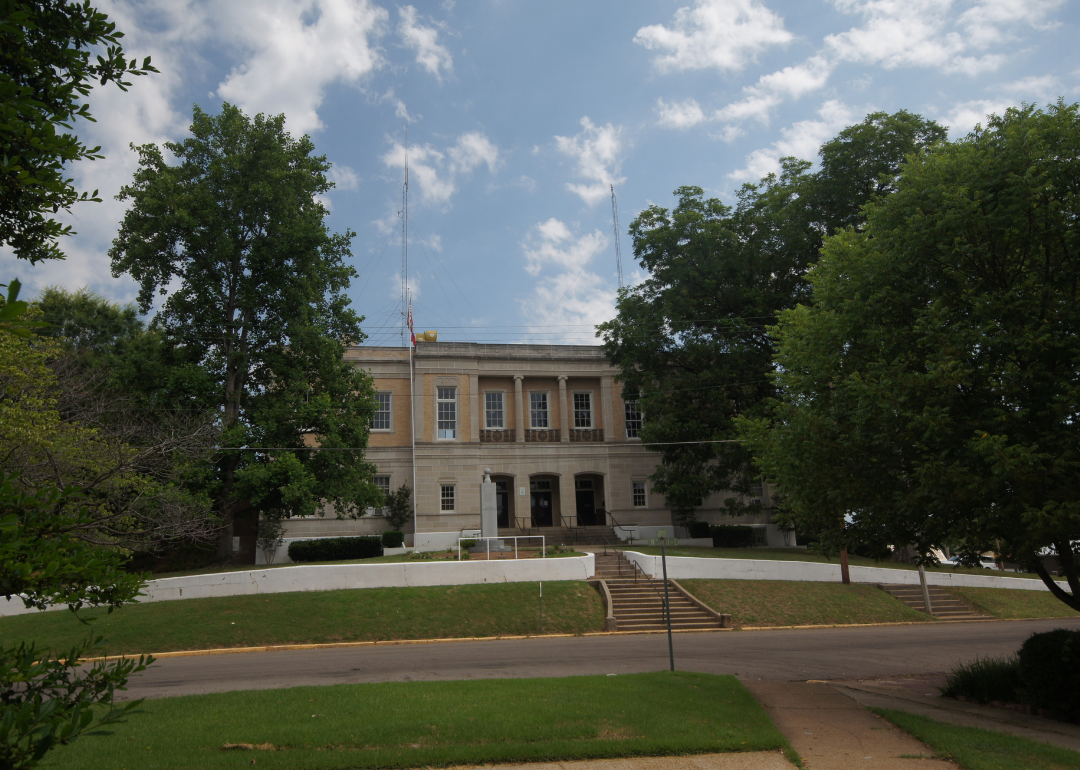
- Bridges in poor condition: 12.4% (12 of 97 bridges)
- Square meters of bridges in poor condition: 7.1% (2,951 of 41,394 square meters of bridges)
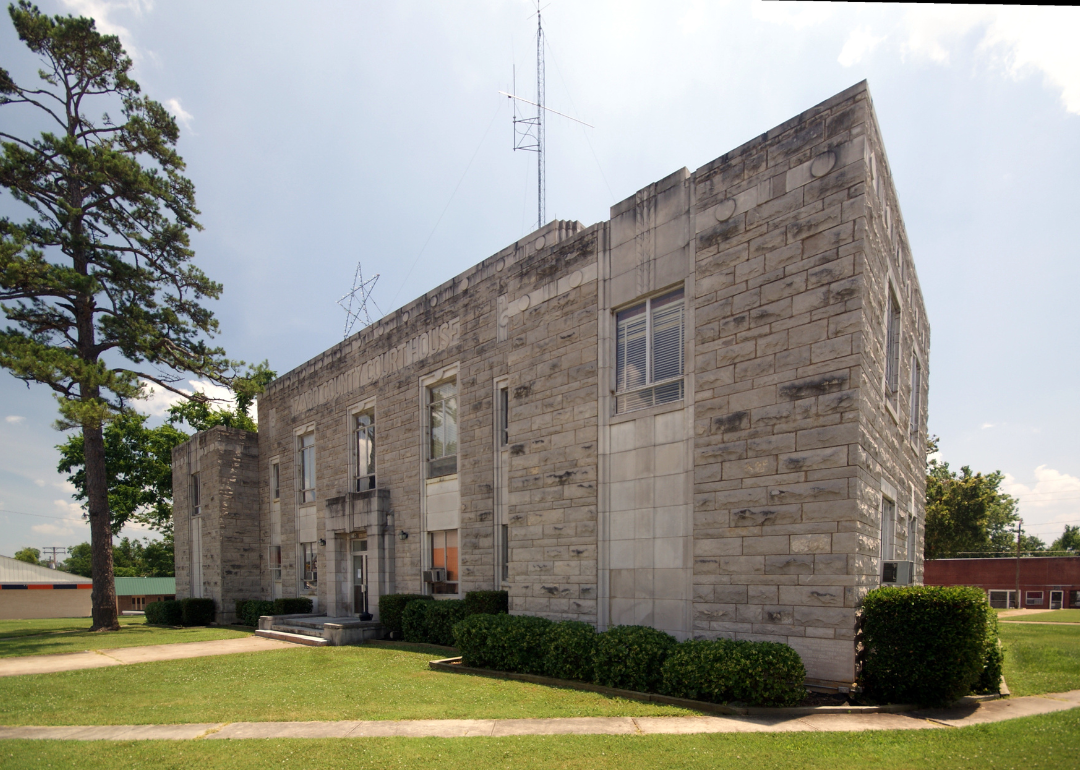
- Bridges in poor condition: 13.1% (13 of 99 bridges)
- Square meters of bridges in poor condition: 12.3% (2,893 of 23,607 square meters of bridges)
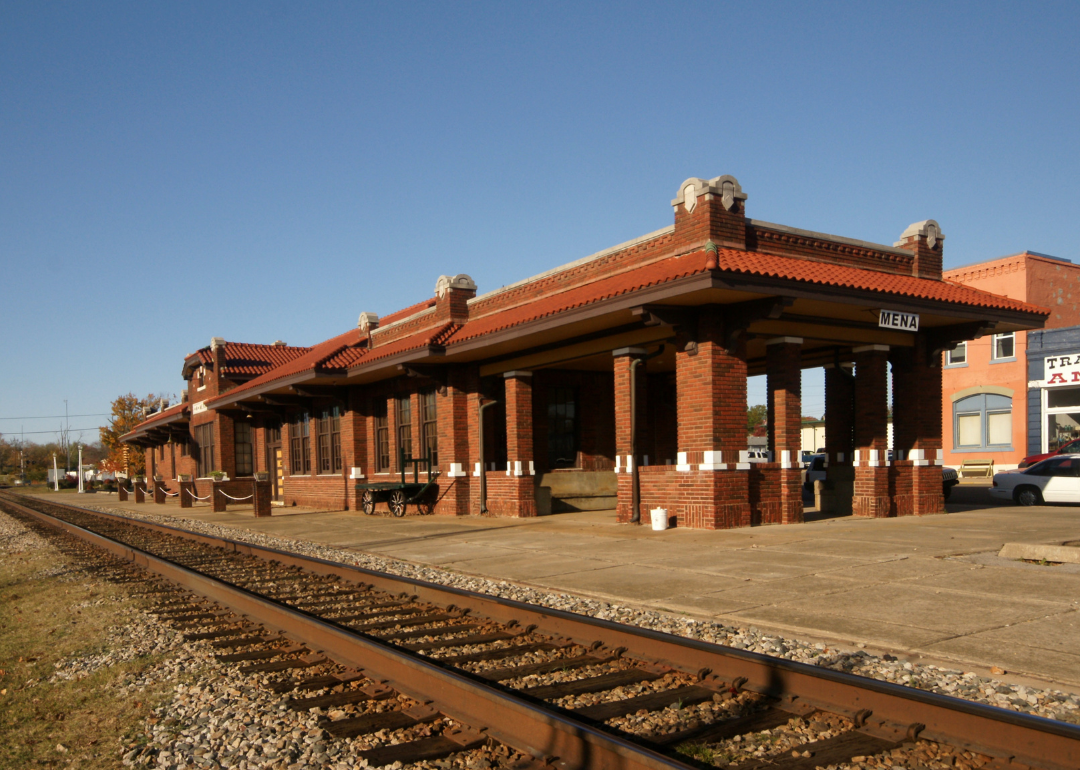
- Bridges in poor condition: 13.2% (29 of 219 bridges)
- Square meters of bridges in poor condition: 12.7% (4,748 of 37,289 square meters of bridges)

- Bridges in poor condition: 14.9% (29 of 195 bridges)
- Square meters of bridges in poor condition: 10.3% (9,858 of 95,442 square meters of bridges)

- Bridges in poor condition: 19.6% (29 of 148 bridges)
- Square meters of bridges in poor condition: 15.6% (6,832 of 43,758 square meters of bridges)

- Bridges in poor condition: 27.9% (29 of 104 bridges)
- Square meters of bridges in poor condition: 56.1% (22,501 of 40,115 square meters of bridges)
