Most common settings for foodborne outbreaks in Arkansas

MNStudio // Shutterstock
- Outbreaks reported, 2010-2022: 1 (3.3% of all incidents)
- Illnesses reported: 6 (0.4%)
- Hospitalizations reported: 1 (1.9%)
- Illnesses reported: 6 (0.4%)
- Hospitalizations reported: 1 (1.9%)
#6. Banquet facilities
No Automated Backlink
Off

LElik83 // Shutterstock
- Outbreaks reported, 2010-2022: 1 (3.3% of all incidents)
- Illnesses reported: 11 (0.8%)
- Hospitalizations reported: 0 (0.0%)
- Illnesses reported: 11 (0.8%)
- Hospitalizations reported: 0 (0.0%)
#5. Caterers
No Automated Backlink
Off

CandyBox Images // Shutterstock
- Outbreaks reported, 2010-2022: 1 (3.3% of all incidents)
- Illnesses reported: 269 (19.1%)
- Hospitalizations reported: 11 (20.8%)
- Illnesses reported: 269 (19.1%)
- Hospitalizations reported: 11 (20.8%)
#4. Office or indoor workplaces
No Automated Backlink
Off
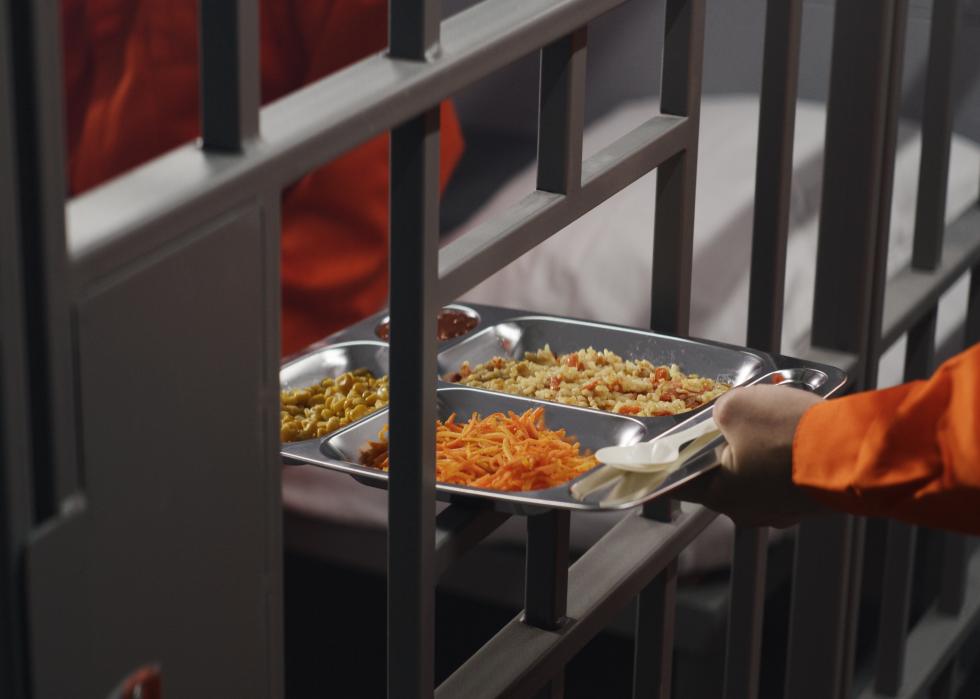
Frame Stock Footage // Shutterstock
- Outbreaks reported, 2010-2022: 3 (10.0% of all incidents)
- Illnesses reported: 618 (44.0%)
- Hospitalizations reported: 8 (15.1%)
- Illnesses reported: 618 (44.0%)
- Hospitalizations reported: 8 (15.1%)
#3. Prisons or jails
No Automated Backlink
Off

Ingrid Balabanova // Shutterstock
- Outbreaks reported, 2010-2022: 8 (26.7% of all incidents)
- Illnesses reported: 38 (2.7%)
- Hospitalizations reported: 7 (13.2%)
- Illnesses reported: 38 (2.7%)
- Hospitalizations reported: 7 (13.2%)
#2. Private homes
No Automated Backlink
Off
Serghei Starus // Shutterstock
- Outbreaks reported, 2010-2022: 10 (33.3% of all incidents)
- Illnesses reported: 414 (29.4%)
- Hospitalizations reported: 12 (22.6%)
- Illnesses reported: 414 (29.4%)
- Hospitalizations reported: 12 (22.6%)
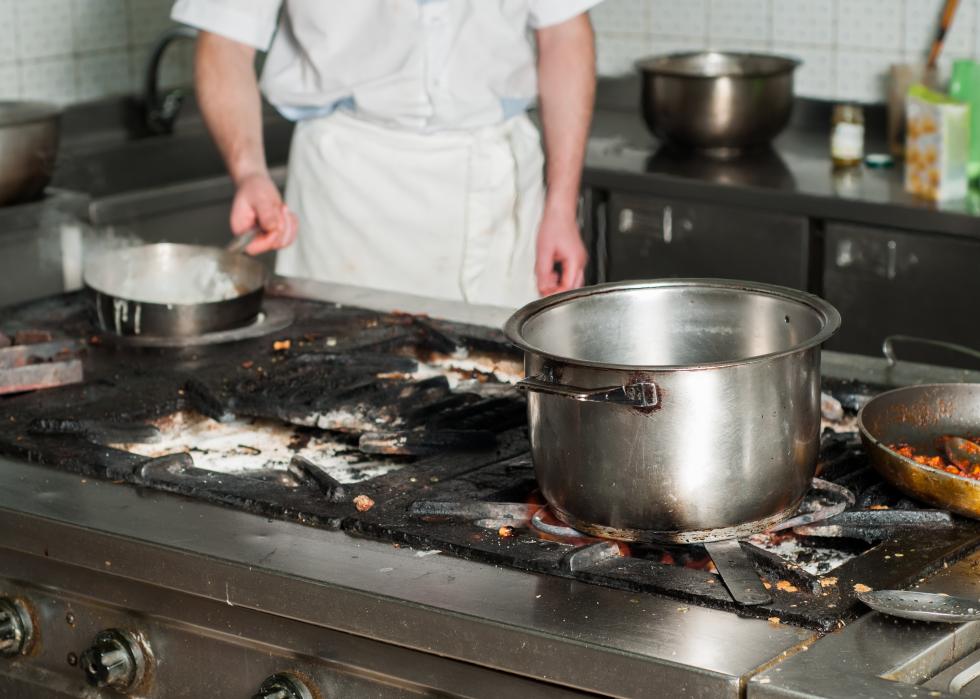
This story features data reporting by Wade Zhou, writing by Cynthia Rebolledo, and is part of a series utilizing data automation across 50 states and Washington D.C.
#1. Sit-down restaurants
No Automated Backlink
Off

Masson // Shutterstock