Counties in California with more precipitation over the past year than average
Stacker

Canva
- Precipitation over the past year: 24.6 inches
- Comparison to 1901-2000 average: 4.2 inches above average (#37 rainiest September-August period since 1895)
- Comparison to state's precipitation over past year: 6.3 inches below statewide average
- Comparison to 1901-2000 average: 4.2 inches above average (#37 rainiest September-August period since 1895)
- Comparison to state's precipitation over past year: 6.3 inches below statewide average
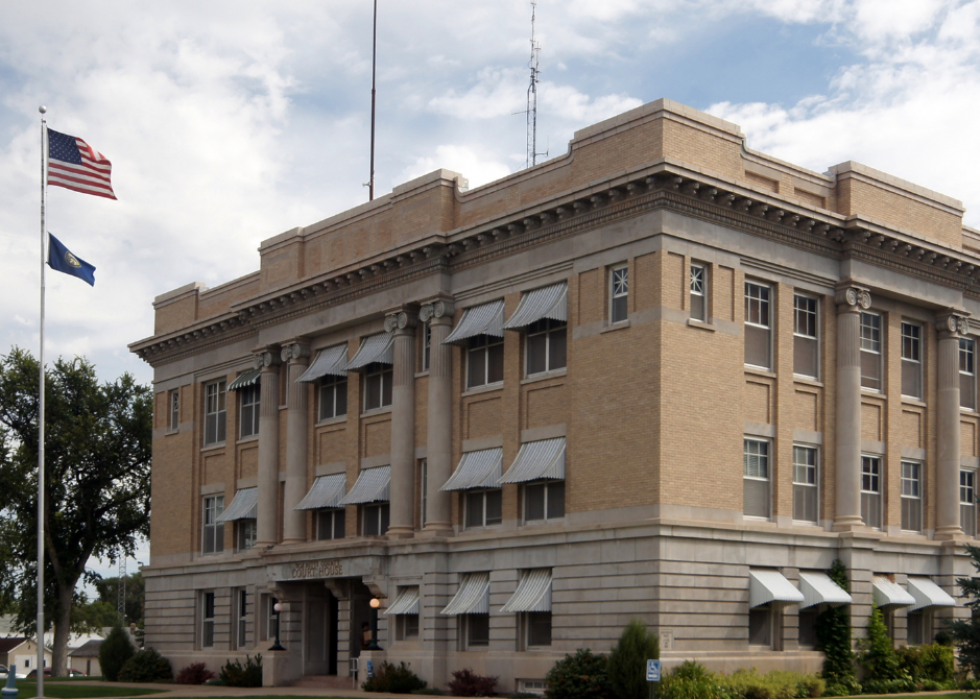
#50. Lassen County
Canva
- Precipitation over the past year: 13.5 inches
- Comparison to 1901-2000 average: 5.9 inches above average (#7 rainiest September-August period since 1895)
- Comparison to state's precipitation over past year: 17.4 inches below statewide average
- Comparison to 1901-2000 average: 5.9 inches above average (#7 rainiest September-August period since 1895)
- Comparison to state's precipitation over past year: 17.4 inches below statewide average
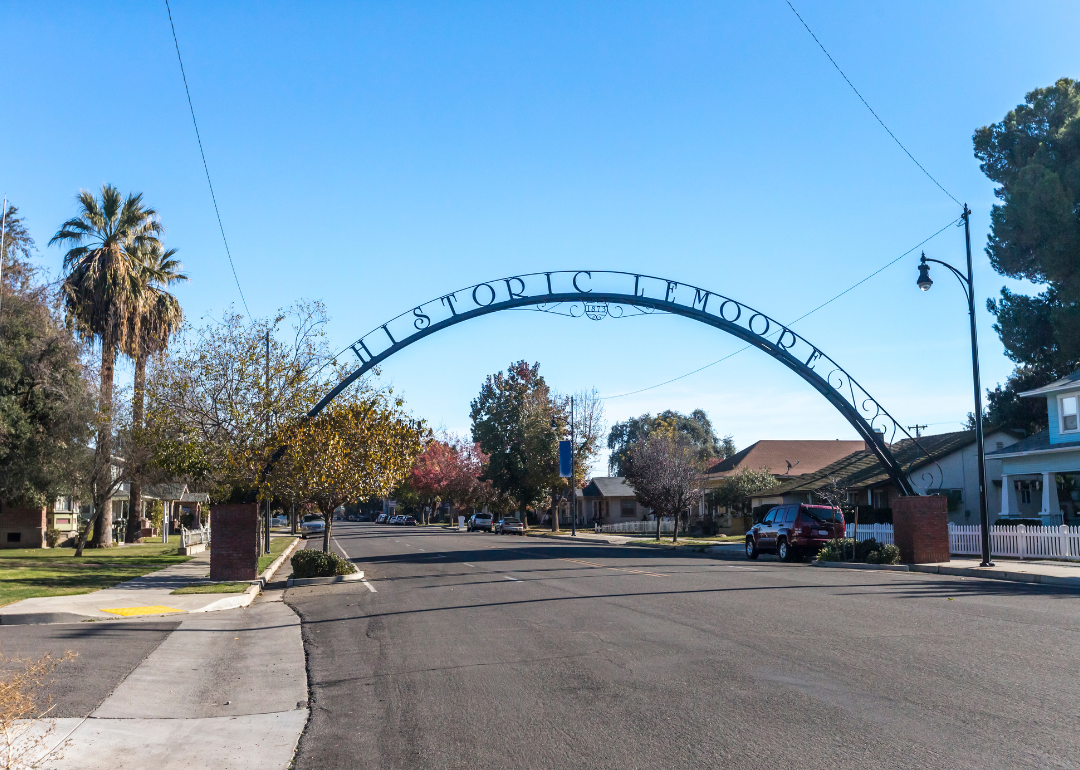
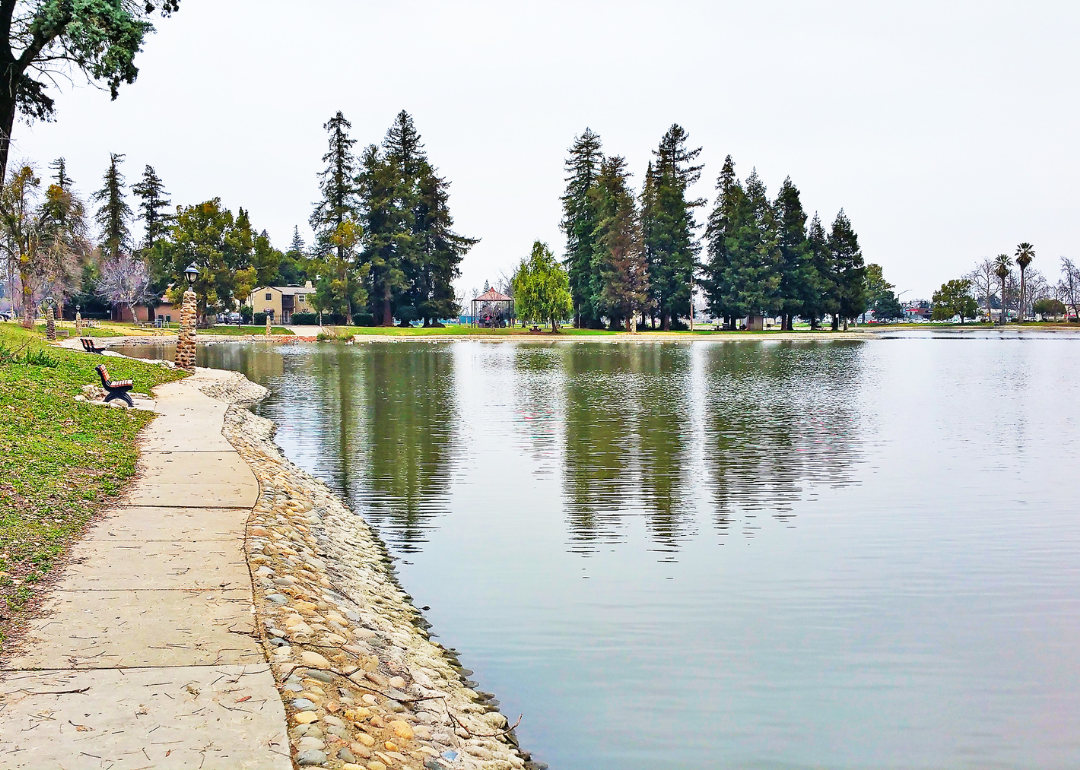
#49. Kings County

Canva
- Precipitation over the past year: 15.0 inches
- Comparison to 1901-2000 average: 5.9 inches above average (#8 rainiest September-August period since 1895)
- Comparison to state's precipitation over past year: 15.9 inches below statewide average
- Comparison to 1901-2000 average: 5.9 inches above average (#8 rainiest September-August period since 1895)
- Comparison to state's precipitation over past year: 15.9 inches below statewide average
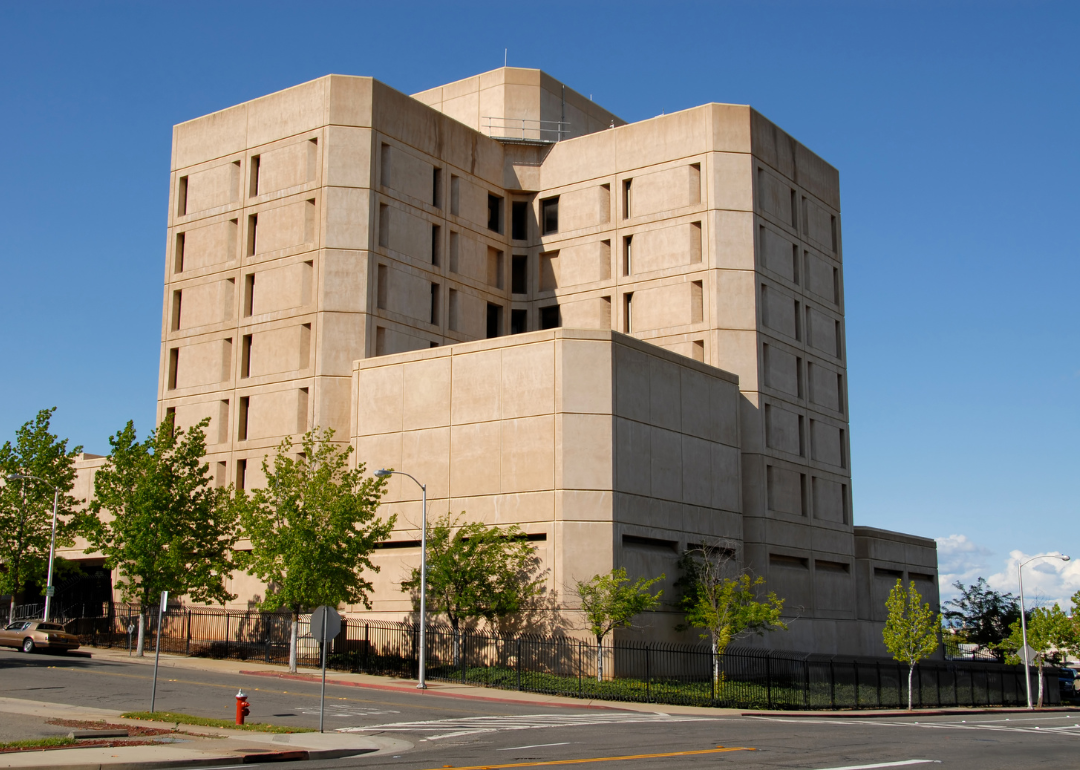
#48. Kern County
Canva
- Precipitation over the past year: 49.9 inches
- Comparison to 1901-2000 average: 7.9 inches above average (#34 rainiest September-August period since 1895)
- Comparison to state's precipitation over past year: 19.0 inches above statewide average
- Comparison to 1901-2000 average: 7.9 inches above average (#34 rainiest September-August period since 1895)
- Comparison to state's precipitation over past year: 19.0 inches above statewide average
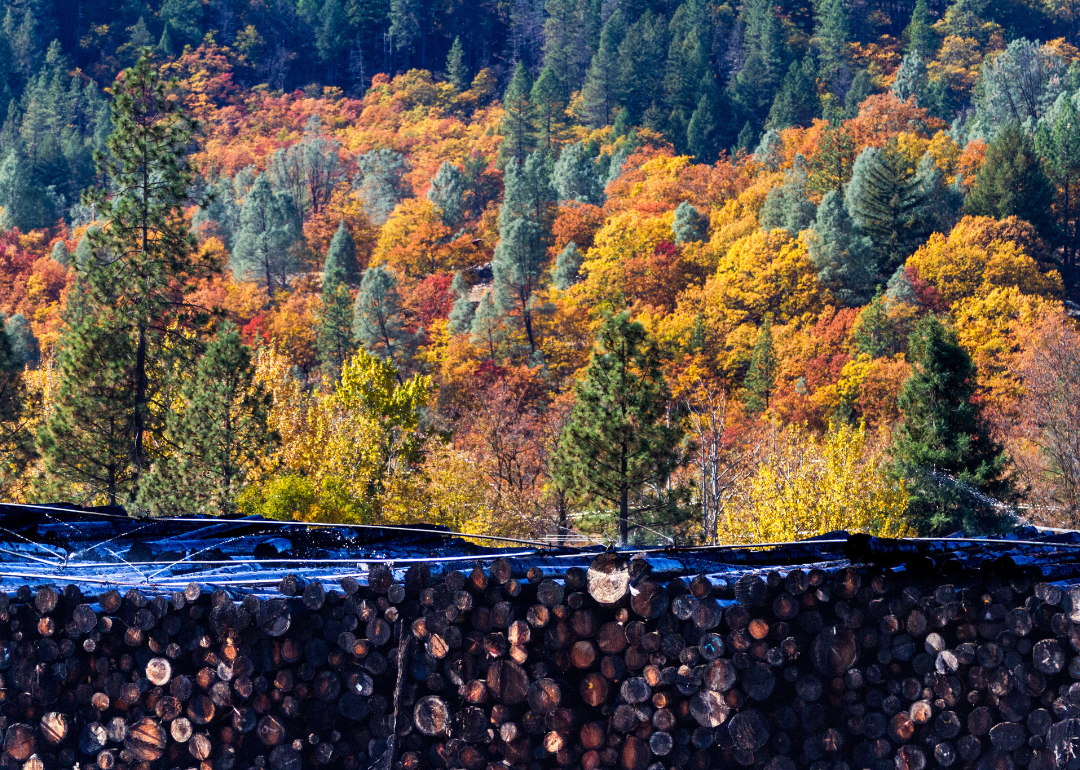
#47. Shasta County
Matt Gush // Shutterstock
- Precipitation over the past year: 27.0 inches
- Comparison to 1901-2000 average: 7.9 inches above average (#12 rainiest September-August period since 1895)
- Comparison to state's precipitation over past year: 4.0 inches below statewide average
- Comparison to 1901-2000 average: 7.9 inches above average (#12 rainiest September-August period since 1895)
- Comparison to state's precipitation over past year: 4.0 inches below statewide average
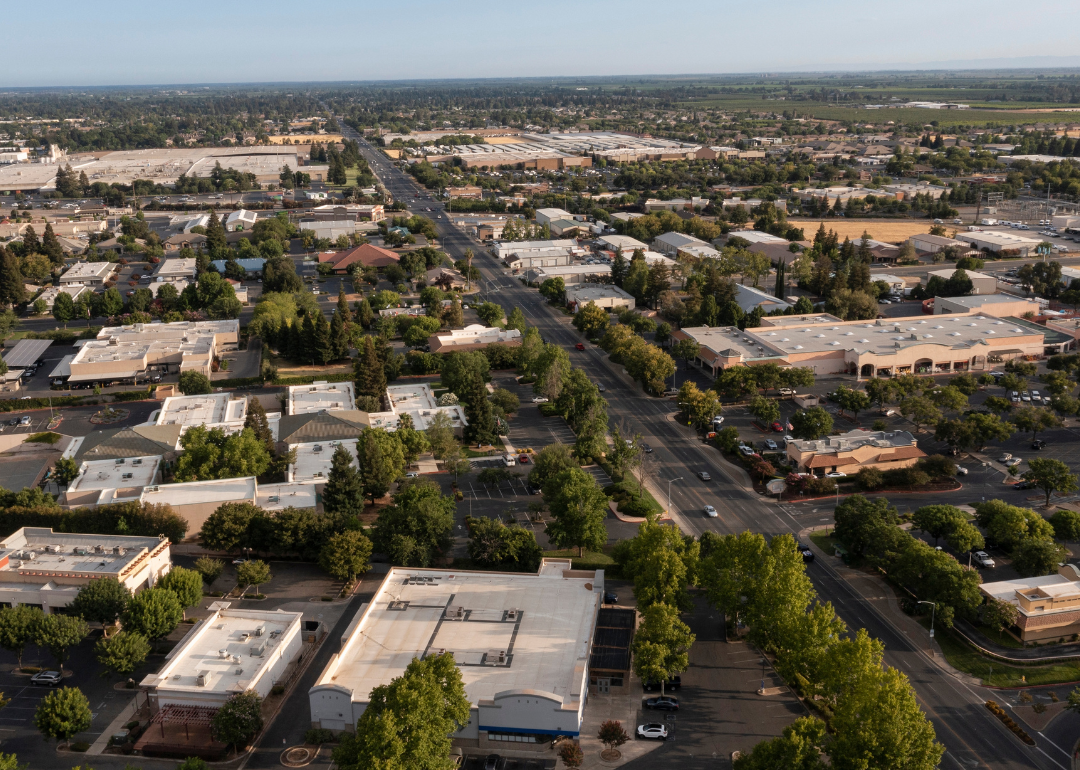
#46. Sutter County

Canva
- Precipitation over the past year: 19.3 inches
- Comparison to 1901-2000 average: 8.0 inches above average (#4 rainiest September-August period since 1895)
- Comparison to state's precipitation over past year: 11.6 inches below statewide average
- Comparison to 1901-2000 average: 8.0 inches above average (#4 rainiest September-August period since 1895)
- Comparison to state's precipitation over past year: 11.6 inches below statewide average
#45. Merced County
Canva
- Precipitation over the past year: 52.6 inches
- Comparison to 1901-2000 average: 8.1 inches above average (#32 rainiest September-August period since 1895)
- Comparison to state's precipitation over past year: 21.7 inches above statewide average
- Comparison to 1901-2000 average: 8.1 inches above average (#32 rainiest September-August period since 1895)
- Comparison to state's precipitation over past year: 21.7 inches above statewide average
#44. Butte County

Canva
- Precipitation over the past year: 27.3 inches
- Comparison to 1901-2000 average: 8.6 inches above average (#9 rainiest September-August period since 1895)
- Comparison to state's precipitation over past year: 3.6 inches below statewide average
- Comparison to 1901-2000 average: 8.6 inches above average (#9 rainiest September-August period since 1895)
- Comparison to state's precipitation over past year: 3.6 inches below statewide average
#43. Sacramento County

Canva
- Precipitation over the past year: 31.0 inches
- Comparison to 1901-2000 average: 8.9 inches above average (#16 rainiest September-August period since 1895)
- Comparison to state's precipitation over past year: 0.0 inches above statewide average
- Comparison to 1901-2000 average: 8.9 inches above average (#16 rainiest September-August period since 1895)
- Comparison to state's precipitation over past year: 0.0 inches above statewide average
#42. Colusa County
Canva
- Precipitation over the past year: 46.8 inches
- Comparison to 1901-2000 average: 9.0 inches above average (#28 rainiest September-August period since 1895)
- Comparison to state's precipitation over past year: 15.9 inches above statewide average
- Comparison to 1901-2000 average: 9.0 inches above average (#28 rainiest September-August period since 1895)
- Comparison to state's precipitation over past year: 15.9 inches above statewide average
#41. Yuba County

CL Shebley // Shutterstock
- Precipitation over the past year: 35.0 inches
- Comparison to 1901-2000 average: 9.0 inches above average (#18 rainiest September-August period since 1895)
- Comparison to state's precipitation over past year: 4.1 inches above statewide average
- Comparison to 1901-2000 average: 9.0 inches above average (#18 rainiest September-August period since 1895)
- Comparison to state's precipitation over past year: 4.1 inches above statewide average
#40. Glenn County
Gibson Outdoor Photo // Shutterstock
- Precipitation over the past year: 66.7 inches
- Comparison to 1901-2000 average: 9.1 inches above average (#38 rainiest September-August period since 1895)
- Comparison to state's precipitation over past year: 35.8 inches above statewide average
- Comparison to 1901-2000 average: 9.1 inches above average (#38 rainiest September-August period since 1895)
- Comparison to state's precipitation over past year: 35.8 inches above statewide average
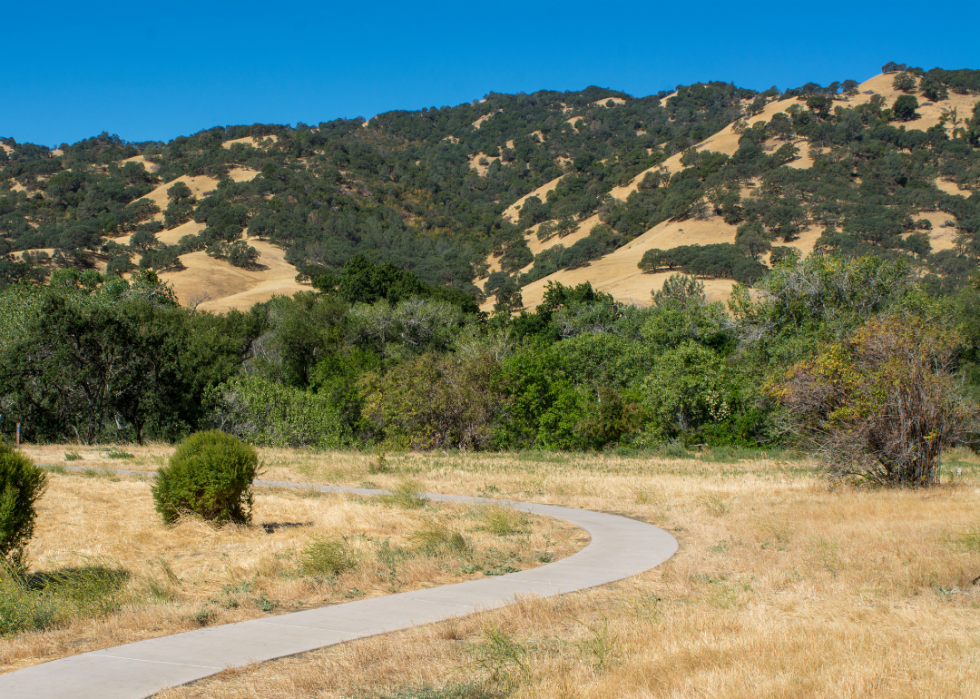
#39. Trinity County
Canva
- Precipitation over the past year: 26.2 inches
- Comparison to 1901-2000 average: 9.4 inches above average (#11 rainiest September-August period since 1895)
- Comparison to state's precipitation over past year: 4.7 inches below statewide average
- Comparison to 1901-2000 average: 9.4 inches above average (#11 rainiest September-August period since 1895)
- Comparison to state's precipitation over past year: 4.7 inches below statewide average
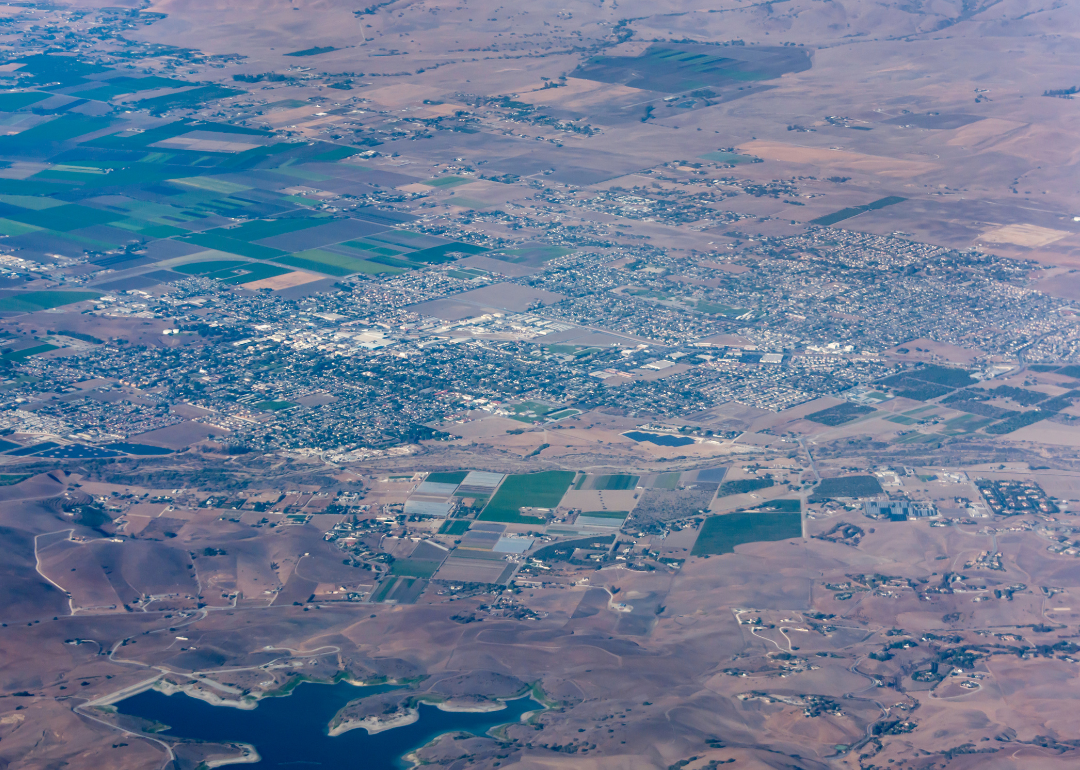
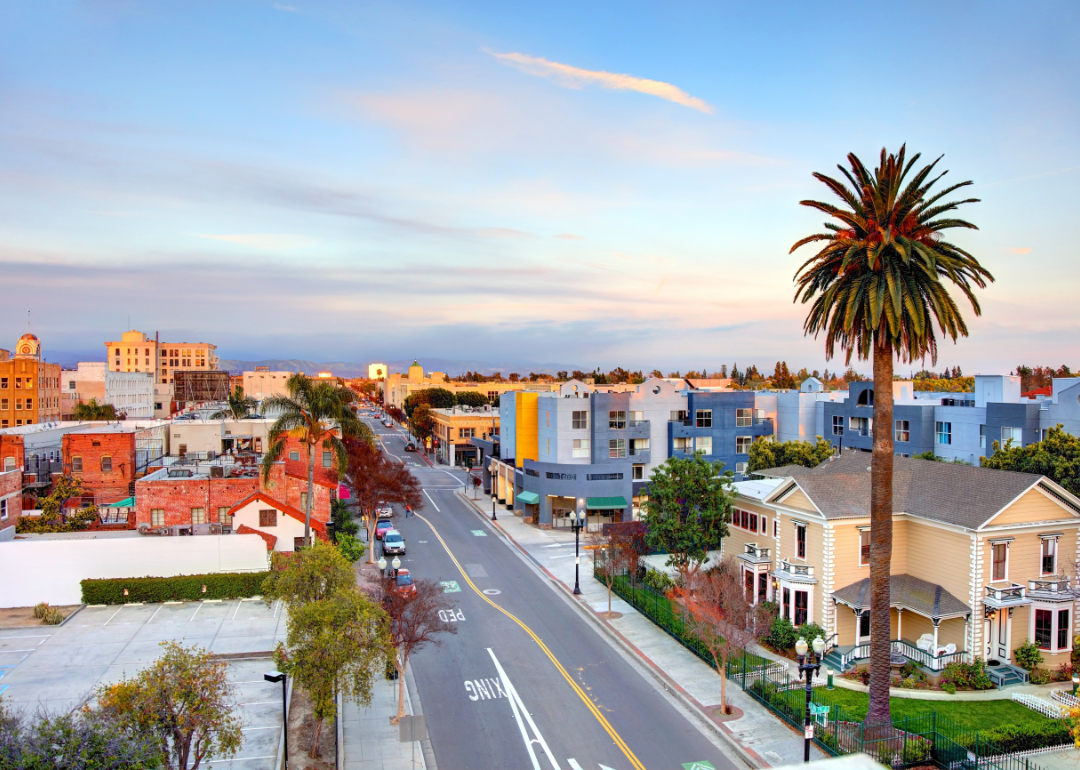
#38. San Benito County
Canva
- Precipitation over the past year: 23.8 inches
- Comparison to 1901-2000 average: 9.5 inches above average (#12 rainiest September-August period since 1895)
- Comparison to state's precipitation over past year: 7.1 inches below statewide average
- Comparison to 1901-2000 average: 9.5 inches above average (#12 rainiest September-August period since 1895)
- Comparison to state's precipitation over past year: 7.1 inches below statewide average
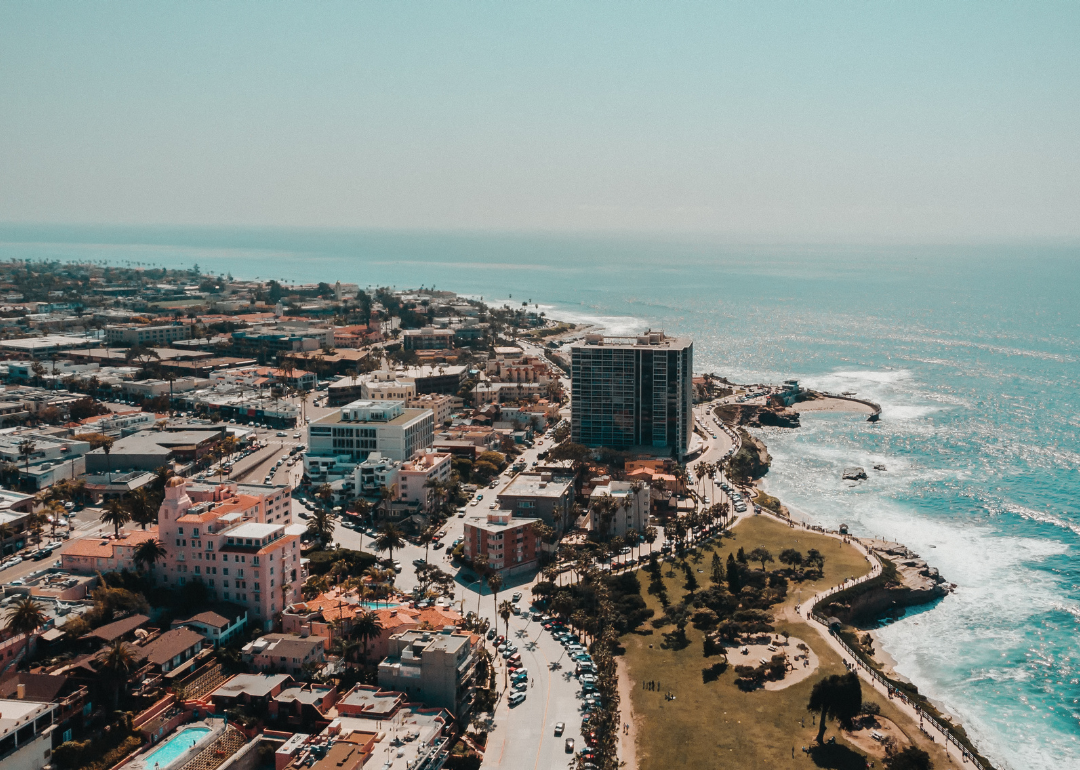
#37. San Diego County
Canva
- Precipitation over the past year: 23.3 inches
- Comparison to 1901-2000 average: 9.8 inches above average (#10 rainiest September-August period since 1895)
- Comparison to state's precipitation over past year: 7.6 inches below statewide average
- Comparison to 1901-2000 average: 9.8 inches above average (#10 rainiest September-August period since 1895)
- Comparison to state's precipitation over past year: 7.6 inches below statewide average
#36. Orange County
Canva
- Precipitation over the past year: 46.3 inches
- Comparison to 1901-2000 average: 9.8 inches above average (#23 rainiest September-August period since 1895)
- Comparison to state's precipitation over past year: 15.4 inches above statewide average
- Comparison to 1901-2000 average: 9.8 inches above average (#23 rainiest September-August period since 1895)
- Comparison to state's precipitation over past year: 15.4 inches above statewide average
#35. Tehama County

Canva
- Precipitation over the past year: 23.5 inches
- Comparison to 1901-2000 average: 9.9 inches above average (#4 rainiest September-August period since 1895)
- Comparison to state's precipitation over past year: 7.4 inches below statewide average
- Comparison to 1901-2000 average: 9.9 inches above average (#4 rainiest September-August period since 1895)
- Comparison to state's precipitation over past year: 7.4 inches below statewide average
#34. Stanislaus County

Canva
- Precipitation over the past year: 30.0 inches
- Comparison to 1901-2000 average: 10.0 inches above average (#11 rainiest September-August period since 1895)
- Comparison to state's precipitation over past year: 0.9 inches below statewide average
- Comparison to 1901-2000 average: 10.0 inches above average (#11 rainiest September-August period since 1895)
- Comparison to state's precipitation over past year: 0.9 inches below statewide average
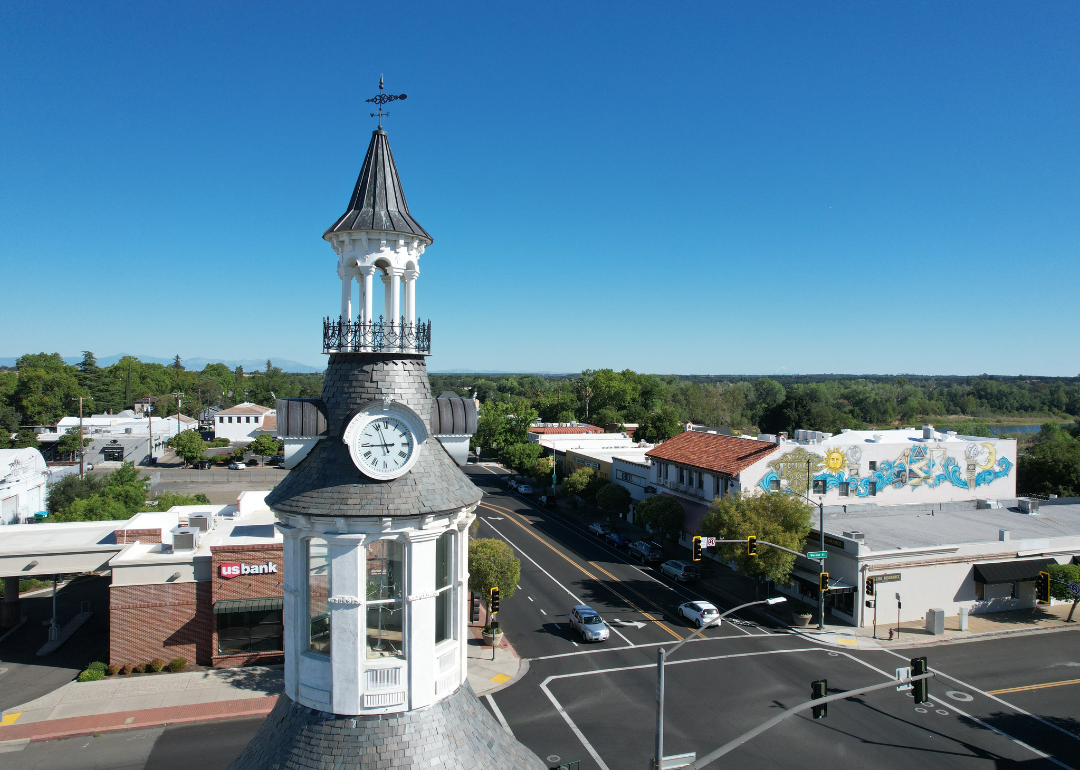
#33. Yolo County

Canva
- Precipitation over the past year: 24.1 inches
- Comparison to 1901-2000 average: 10.0 inches above average (#3 rainiest September-August period since 1895)
- Comparison to state's precipitation over past year: 6.8 inches below statewide average
- Comparison to 1901-2000 average: 10.0 inches above average (#3 rainiest September-August period since 1895)
- Comparison to state's precipitation over past year: 6.8 inches below statewide average
#32. San Joaquin County
Canva
- Precipitation over the past year: 62.7 inches
- Comparison to 1901-2000 average: 11.0 inches above average (#30 rainiest September-August period since 1895)
- Comparison to state's precipitation over past year: 31.8 inches above statewide average
- Comparison to 1901-2000 average: 11.0 inches above average (#30 rainiest September-August period since 1895)
- Comparison to state's precipitation over past year: 31.8 inches above statewide average
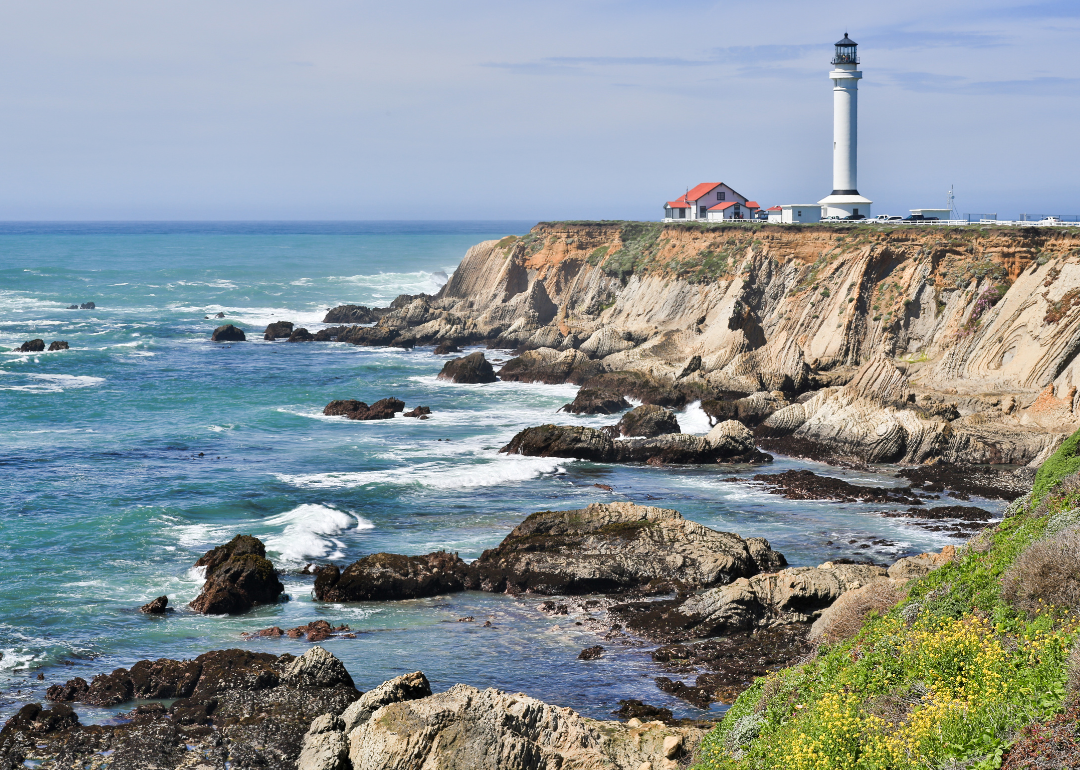
#31. Mendocino County
Canva
- Precipitation over the past year: 31.2 inches
- Comparison to 1901-2000 average: 11.4 inches above average (#8 rainiest September-August period since 1895)
- Comparison to state's precipitation over past year: 0.3 inches above statewide average
- Comparison to 1901-2000 average: 11.4 inches above average (#8 rainiest September-August period since 1895)
- Comparison to state's precipitation over past year: 0.3 inches above statewide average
#30. Solano County

Canva
- Precipitation over the past year: 27.3 inches
- Comparison to 1901-2000 average: 11.7 inches above average (#8 rainiest September-August period since 1895)
- Comparison to state's precipitation over past year: 3.7 inches below statewide average
- Comparison to 1901-2000 average: 11.7 inches above average (#8 rainiest September-August period since 1895)
- Comparison to state's precipitation over past year: 3.7 inches below statewide average
#29. Los Angeles County
Canva
- Precipitation over the past year: 47.3 inches
- Comparison to 1901-2000 average: 11.7 inches above average (#21 rainiest September-August period since 1895)
- Comparison to state's precipitation over past year: 16.4 inches above statewide average
- Comparison to 1901-2000 average: 11.7 inches above average (#21 rainiest September-August period since 1895)
- Comparison to state's precipitation over past year: 16.4 inches above statewide average
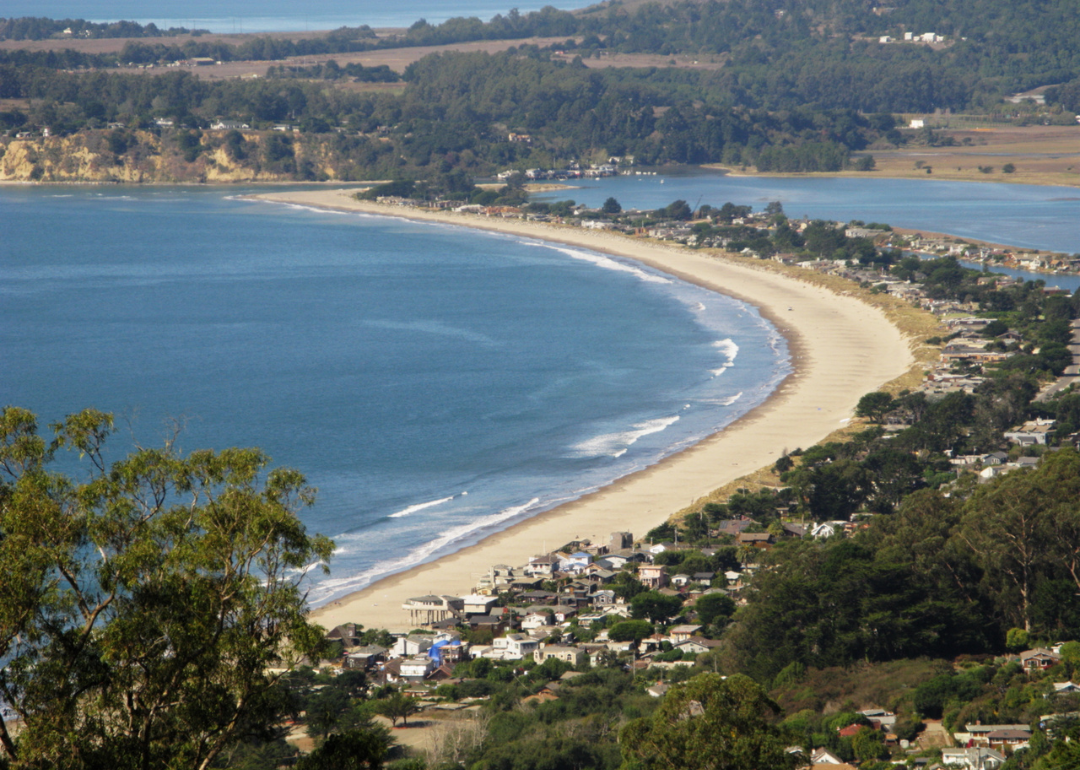
#28. Marin County
Canva
- Precipitation over the past year: 30.5 inches
- Comparison to 1901-2000 average: 12.0 inches above average (#6 rainiest September-August period since 1895)
- Comparison to state's precipitation over past year: 0.4 inches below statewide average
- Comparison to 1901-2000 average: 12.0 inches above average (#6 rainiest September-August period since 1895)
- Comparison to state's precipitation over past year: 0.4 inches below statewide average
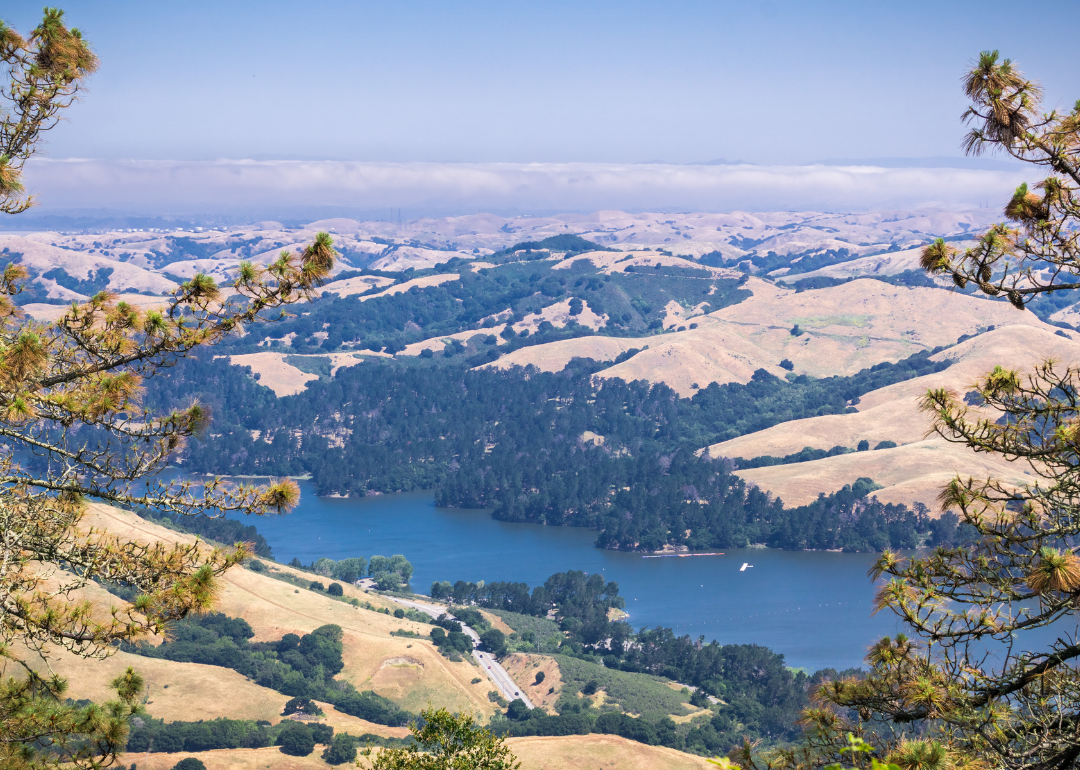
#27. Contra Costa County
Canva
- Precipitation over the past year: 35.2 inches
- Comparison to 1901-2000 average: 12.0 inches above average (#10 rainiest September-August period since 1895)
- Comparison to state's precipitation over past year: 4.2 inches above statewide average
- Comparison to 1901-2000 average: 12.0 inches above average (#10 rainiest September-August period since 1895)
- Comparison to state's precipitation over past year: 4.2 inches above statewide average
#26. Madera County

Canva
- Precipitation over the past year: 43.1 inches
- Comparison to 1901-2000 average: 12.0 inches above average (#16 rainiest September-August period since 1895)
- Comparison to state's precipitation over past year: 12.2 inches above statewide average
- Comparison to 1901-2000 average: 12.0 inches above average (#16 rainiest September-August period since 1895)
- Comparison to state's precipitation over past year: 12.2 inches above statewide average
#25. Napa County

Canva
- Precipitation over the past year: 54.5 inches
- Comparison to 1901-2000 average: 12.4 inches above average (#22 rainiest September-August period since 1895)
- Comparison to state's precipitation over past year: 23.6 inches above statewide average
- Comparison to 1901-2000 average: 12.4 inches above average (#22 rainiest September-August period since 1895)
- Comparison to state's precipitation over past year: 23.6 inches above statewide average
#24. Sonoma County

Canva
- Precipitation over the past year: 31.9 inches
- Comparison to 1901-2000 average: 13.1 inches above average (#3 rainiest September-August period since 1895)
- Comparison to state's precipitation over past year: 0.9 inches above statewide average
- Comparison to 1901-2000 average: 13.1 inches above average (#3 rainiest September-August period since 1895)
- Comparison to state's precipitation over past year: 0.9 inches above statewide average
#23. Alameda County

Canva
- Precipitation over the past year: 33.7 inches
- Comparison to 1901-2000 average: 13.6 inches above average (#8 rainiest September-August period since 1895)
- Comparison to state's precipitation over past year: 2.8 inches above statewide average
- Comparison to 1901-2000 average: 13.6 inches above average (#8 rainiest September-August period since 1895)
- Comparison to state's precipitation over past year: 2.8 inches above statewide average
#22. Monterey County

Canva
- Precipitation over the past year: 38.6 inches
- Comparison to 1901-2000 average: 14.3 inches above average (#6 rainiest September-August period since 1895)
- Comparison to state's precipitation over past year: 7.7 inches above statewide average
- Comparison to 1901-2000 average: 14.3 inches above average (#6 rainiest September-August period since 1895)
- Comparison to state's precipitation over past year: 7.7 inches above statewide average
#21. San Francisco
Canva
- Precipitation over the past year: 55.6 inches
- Comparison to 1901-2000 average: 14.3 inches above average (#20 rainiest September-August period since 1895)
- Comparison to state's precipitation over past year: 24.7 inches above statewide average
- Comparison to 1901-2000 average: 14.3 inches above average (#20 rainiest September-August period since 1895)
- Comparison to state's precipitation over past year: 24.7 inches above statewide average
#20. Plumas County
Canva
- Precipitation over the past year: 57.9 inches
- Comparison to 1901-2000 average: 14.4 inches above average (#20 rainiest September-August period since 1895)
- Comparison to state's precipitation over past year: 27.0 inches above statewide average
- Comparison to 1901-2000 average: 14.4 inches above average (#20 rainiest September-August period since 1895)
- Comparison to state's precipitation over past year: 27.0 inches above statewide average
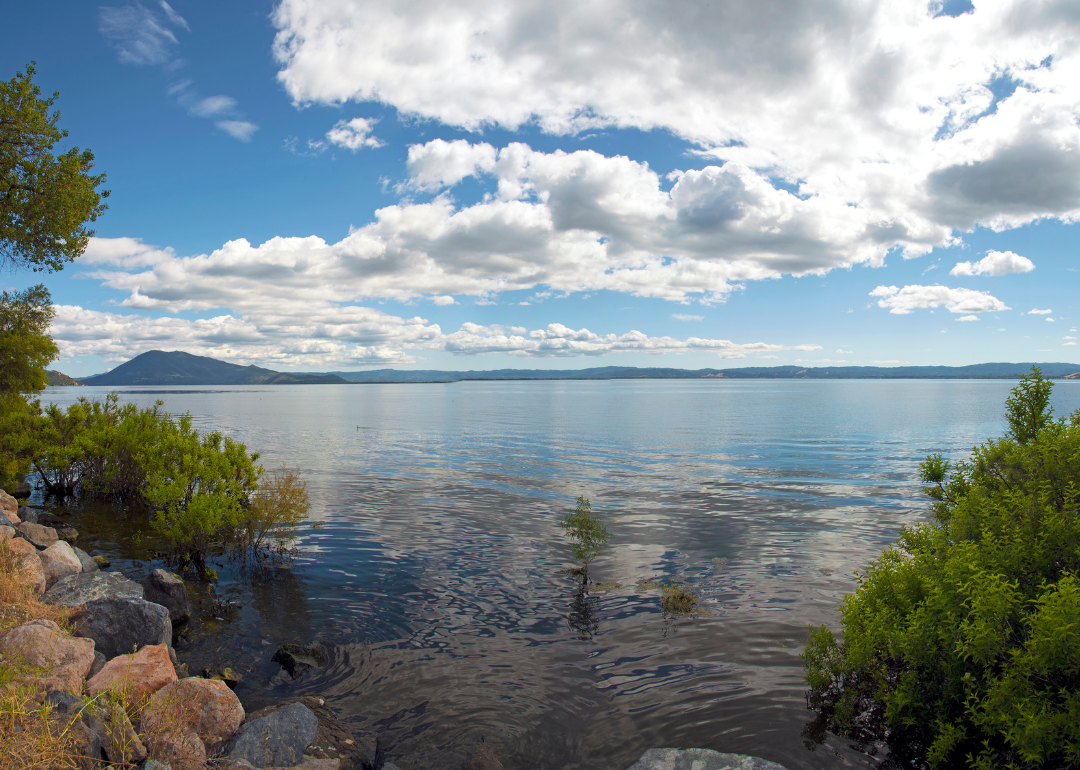
#19. Lake County
Canva
- Precipitation over the past year: 34.2 inches
- Comparison to 1901-2000 average: 14.6 inches above average (#5 rainiest September-August period since 1895)
- Comparison to state's precipitation over past year: 3.3 inches above statewide average
- Comparison to 1901-2000 average: 14.6 inches above average (#5 rainiest September-August period since 1895)
- Comparison to state's precipitation over past year: 3.3 inches above statewide average
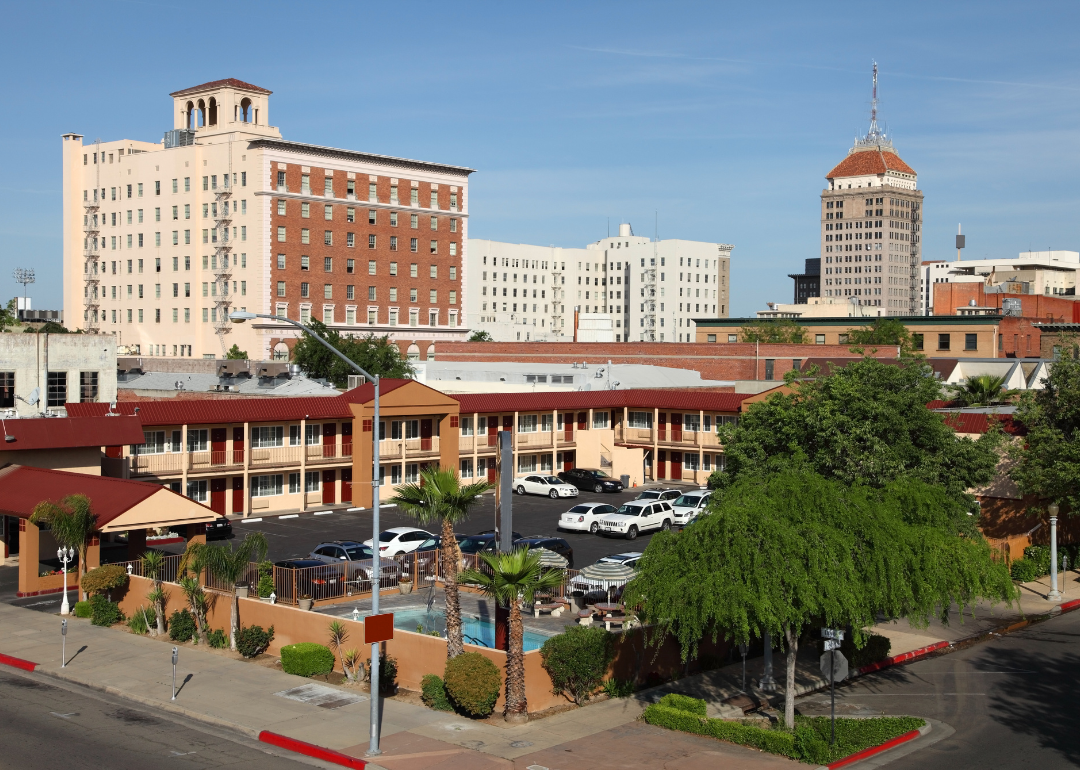
#18. Fresno County
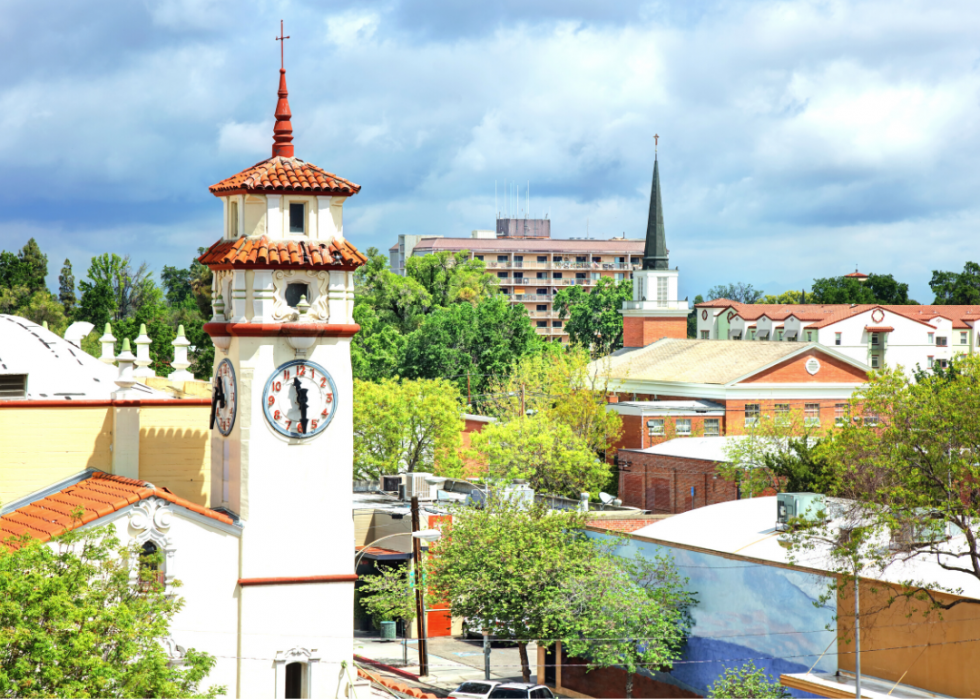
Canva
- Precipitation over the past year: 37.2 inches
- Comparison to 1901-2000 average: 15.3 inches above average (#5 rainiest September-August period since 1895)
- Comparison to state's precipitation over past year: 6.3 inches above statewide average
- Comparison to 1901-2000 average: 15.3 inches above average (#5 rainiest September-August period since 1895)
- Comparison to state's precipitation over past year: 6.3 inches above statewide average
#17. Tulare County
Canva
- Precipitation over the past year: 32.5 inches
- Comparison to 1901-2000 average: 15.3 inches above average (#6 rainiest September-August period since 1895)
- Comparison to state's precipitation over past year: 1.6 inches above statewide average
- Comparison to 1901-2000 average: 15.3 inches above average (#6 rainiest September-August period since 1895)
- Comparison to state's precipitation over past year: 1.6 inches above statewide average
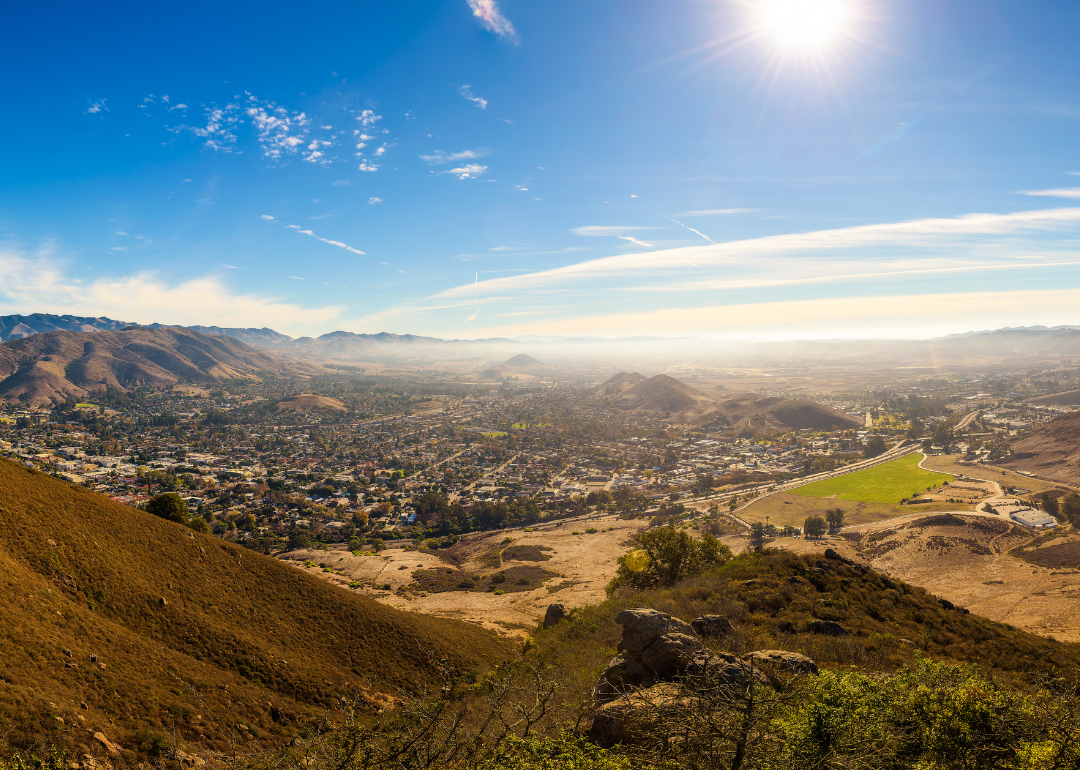
#16. San Luis Obispo County
Canva
- Precipitation over the past year: 34.4 inches
- Comparison to 1901-2000 average: 15.5 inches above average (#7 rainiest September-August period since 1895)
- Comparison to state's precipitation over past year: 3.5 inches above statewide average
- Comparison to 1901-2000 average: 15.5 inches above average (#7 rainiest September-August period since 1895)
- Comparison to state's precipitation over past year: 3.5 inches above statewide average
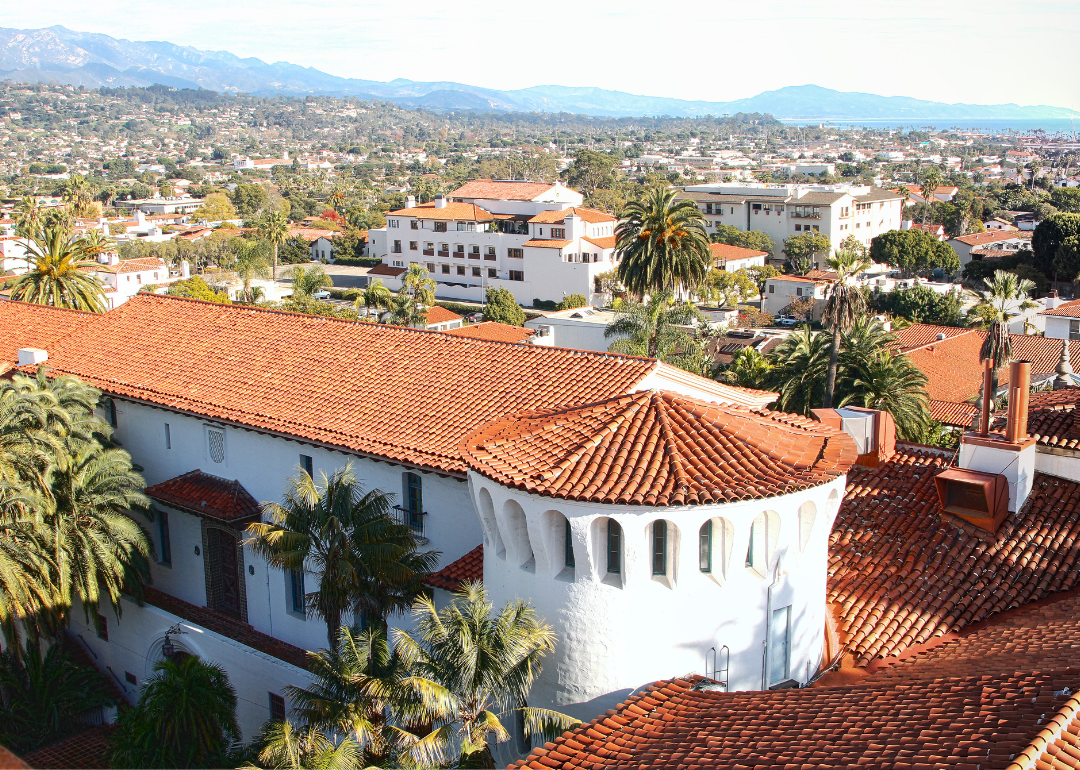
#15. Santa Barbara County
Canva
- Precipitation over the past year: 31.8 inches
- Comparison to 1901-2000 average: 16.1 inches above average (#1 rainiest September-August period since 1895)
- Comparison to state's precipitation over past year: 0.8 inches above statewide average
- Comparison to 1901-2000 average: 16.1 inches above average (#1 rainiest September-August period since 1895)
- Comparison to state's precipitation over past year: 0.8 inches above statewide average
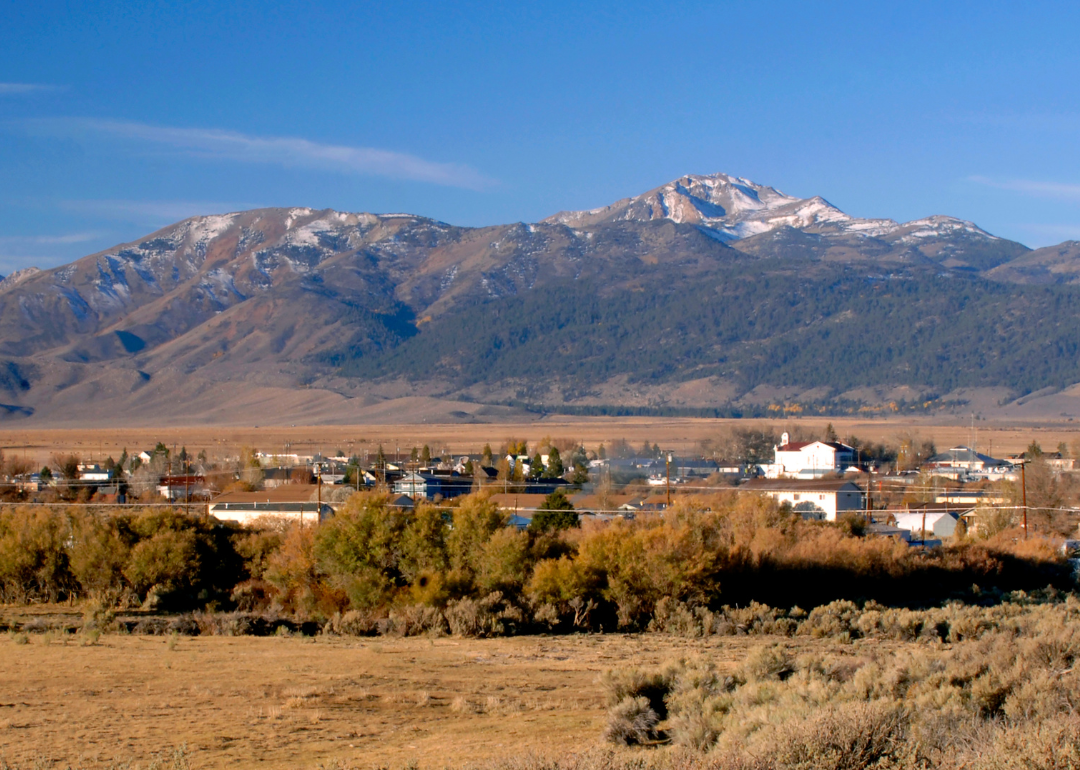
#14. Mono County
Canva
- Precipitation over the past year: 45.2 inches
- Comparison to 1901-2000 average: 16.5 inches above average (#5 rainiest September-August period since 1895)
- Comparison to state's precipitation over past year: 14.3 inches above statewide average
- Comparison to 1901-2000 average: 16.5 inches above average (#5 rainiest September-August period since 1895)
- Comparison to state's precipitation over past year: 14.3 inches above statewide average
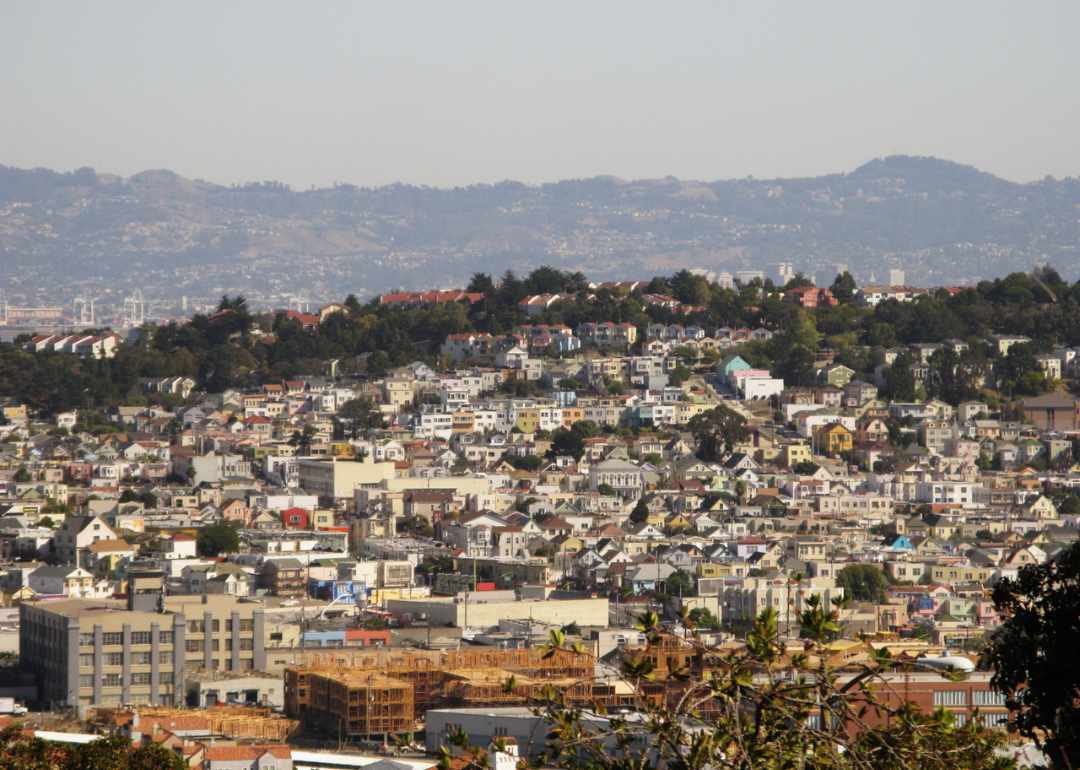
#13. San Mateo County

Uladzik Kryhin // Shutterstock
- Precipitation over the past year: 40.3 inches
- Comparison to 1901-2000 average: 17.2 inches above average (#3 rainiest September-August period since 1895)
- Comparison to state's precipitation over past year: 9.4 inches above statewide average
- Comparison to 1901-2000 average: 17.2 inches above average (#3 rainiest September-August period since 1895)
- Comparison to state's precipitation over past year: 9.4 inches above statewide average
#12. Santa Clara County
Canva
- Precipitation over the past year: 63.2 inches
- Comparison to 1901-2000 average: 17.4 inches above average (#13 rainiest September-August period since 1895)
- Comparison to state's precipitation over past year: 32.3 inches above statewide average
- Comparison to 1901-2000 average: 17.4 inches above average (#13 rainiest September-August period since 1895)
- Comparison to state's precipitation over past year: 32.3 inches above statewide average
#11. Sierra County
Canva
- Precipitation over the past year: 38.1 inches
- Comparison to 1901-2000 average: 17.6 inches above average (#8 rainiest September-August period since 1895)
- Comparison to state's precipitation over past year: 7.2 inches above statewide average
- Comparison to 1901-2000 average: 17.6 inches above average (#8 rainiest September-August period since 1895)
- Comparison to state's precipitation over past year: 7.2 inches above statewide average
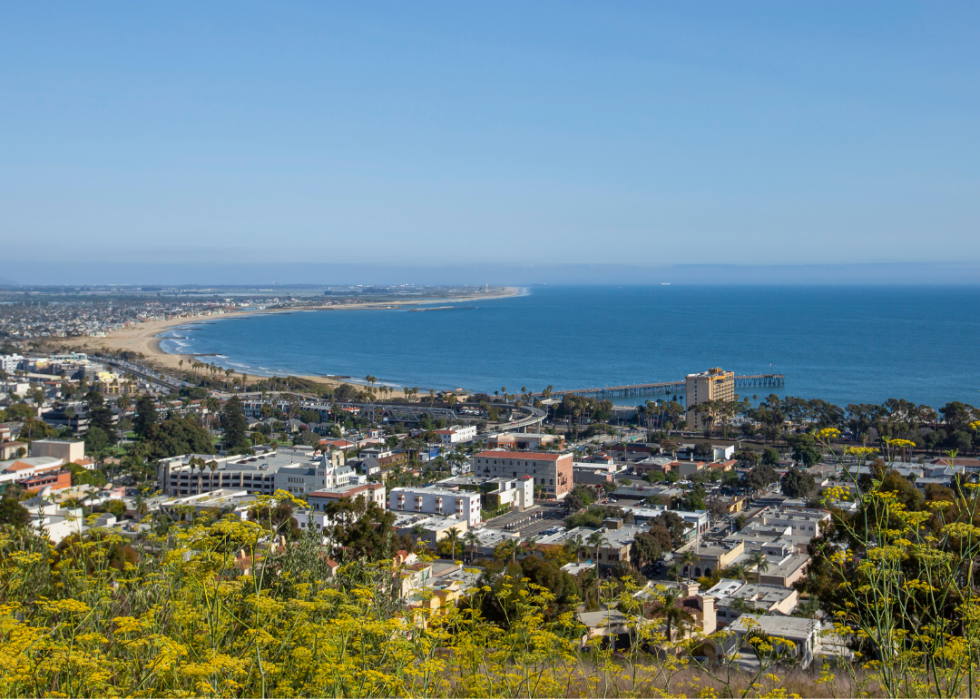
#10. Ventura County

Canva
- Precipitation over the past year: 69.8 inches
- Comparison to 1901-2000 average: 19.4 inches above average (#15 rainiest September-August period since 1895)
- Comparison to state's precipitation over past year: 38.9 inches above statewide average
- Comparison to 1901-2000 average: 19.4 inches above average (#15 rainiest September-August period since 1895)
- Comparison to state's precipitation over past year: 38.9 inches above statewide average
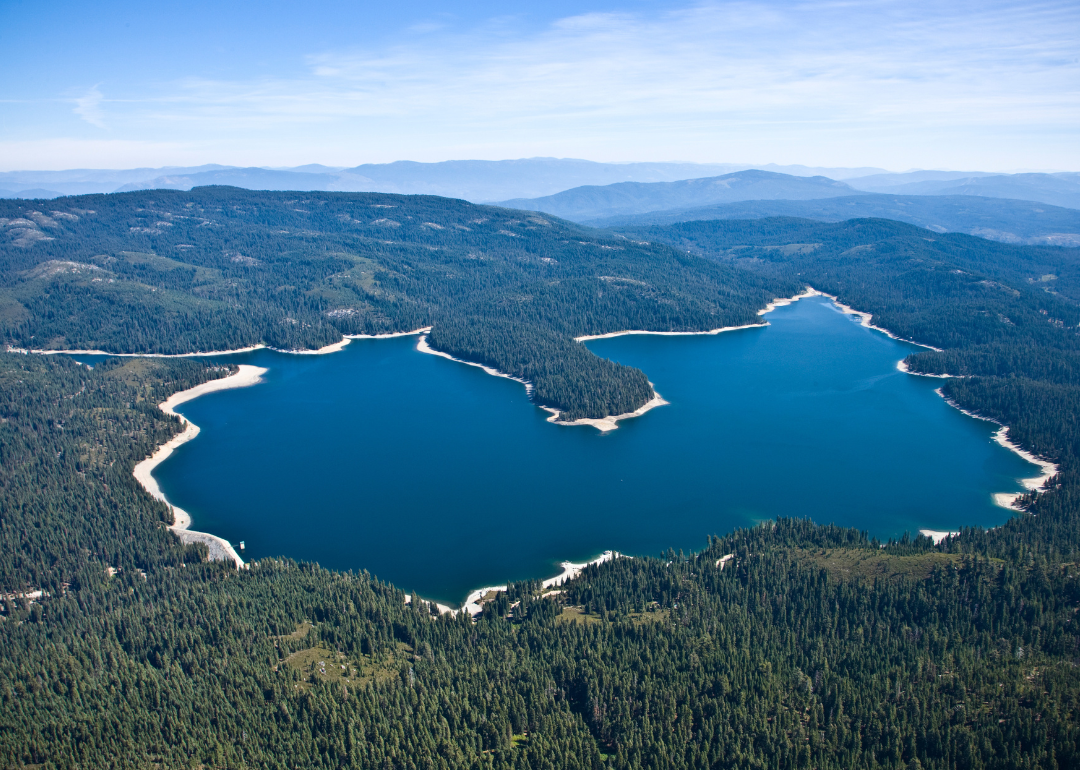
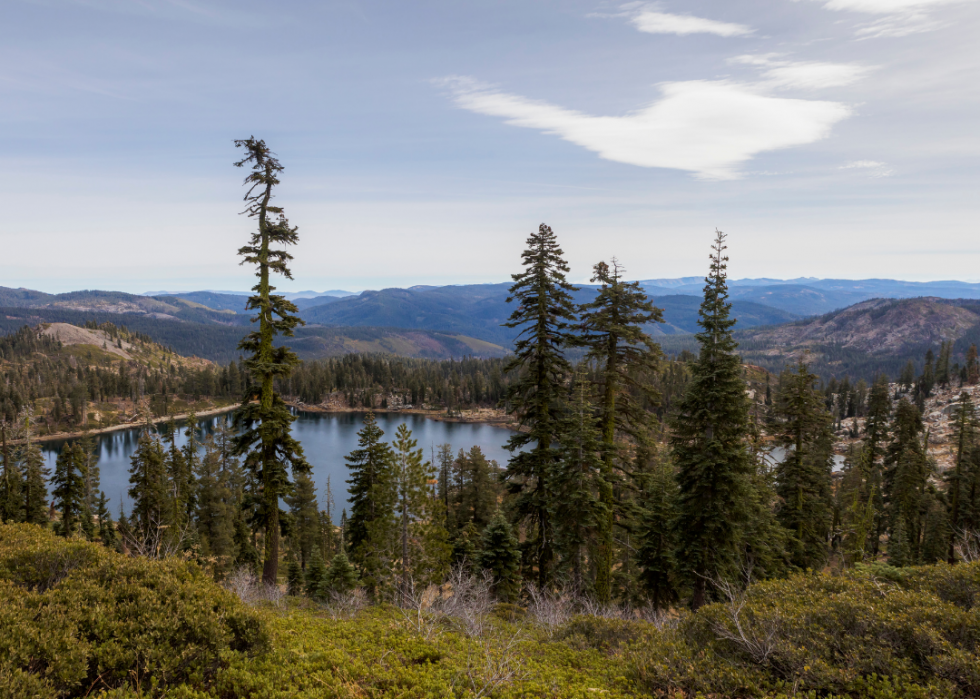
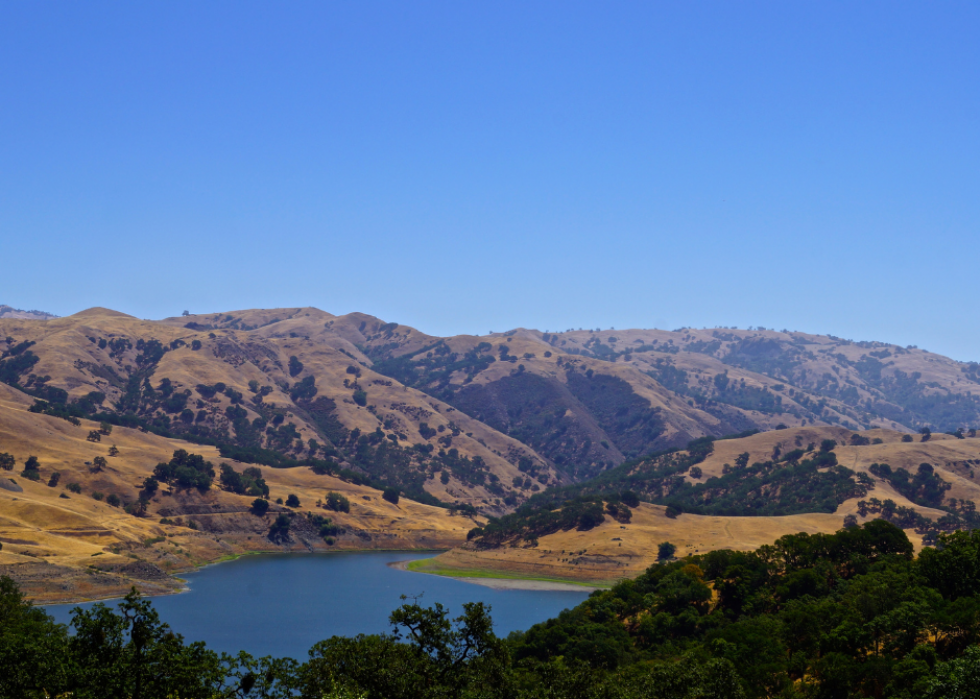
#9. Nevada County
Canva
- Precipitation over the past year: 54.0 inches
- Comparison to 1901-2000 average: 19.6 inches above average (#6 rainiest September-August period since 1895)
- Comparison to state's precipitation over past year: 23.1 inches above statewide average
- Comparison to 1901-2000 average: 19.6 inches above average (#6 rainiest September-August period since 1895)
- Comparison to state's precipitation over past year: 23.1 inches above statewide average
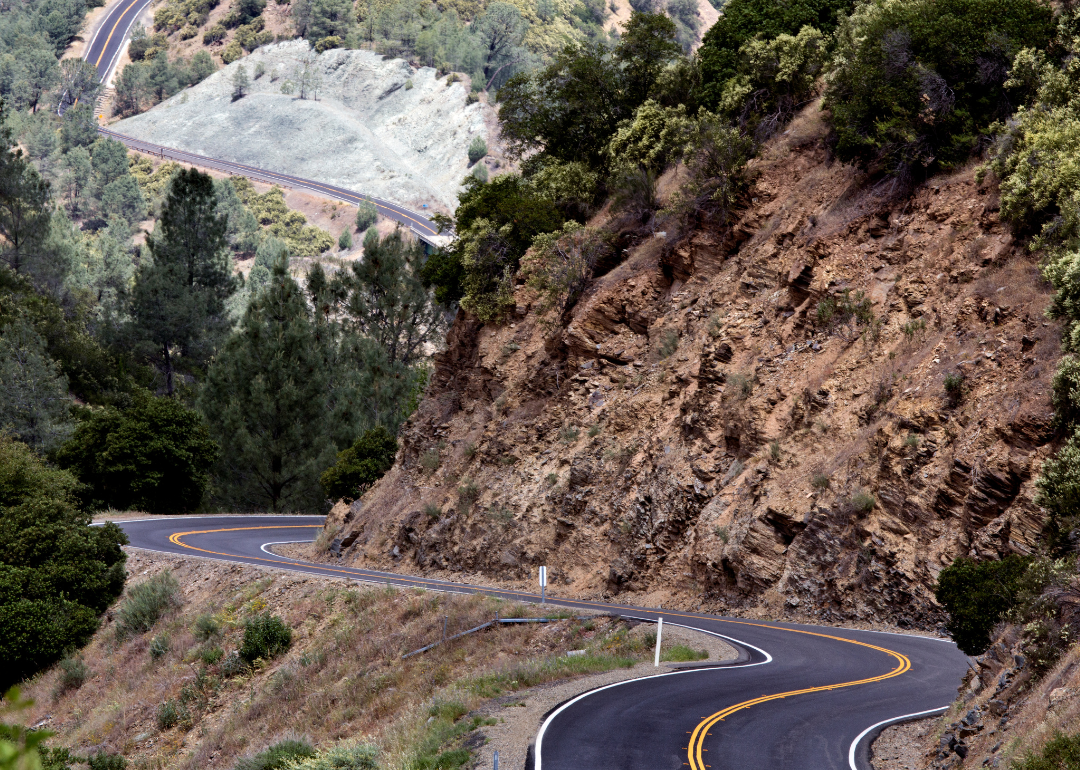
#8. Calaveras County

Canva
- Precipitation over the past year: 55.9 inches
- Comparison to 1901-2000 average: 20.6 inches above average (#6 rainiest September-August period since 1895)
- Comparison to state's precipitation over past year: 25.0 inches above statewide average
- Comparison to 1901-2000 average: 20.6 inches above average (#6 rainiest September-August period since 1895)
- Comparison to state's precipitation over past year: 25.0 inches above statewide average
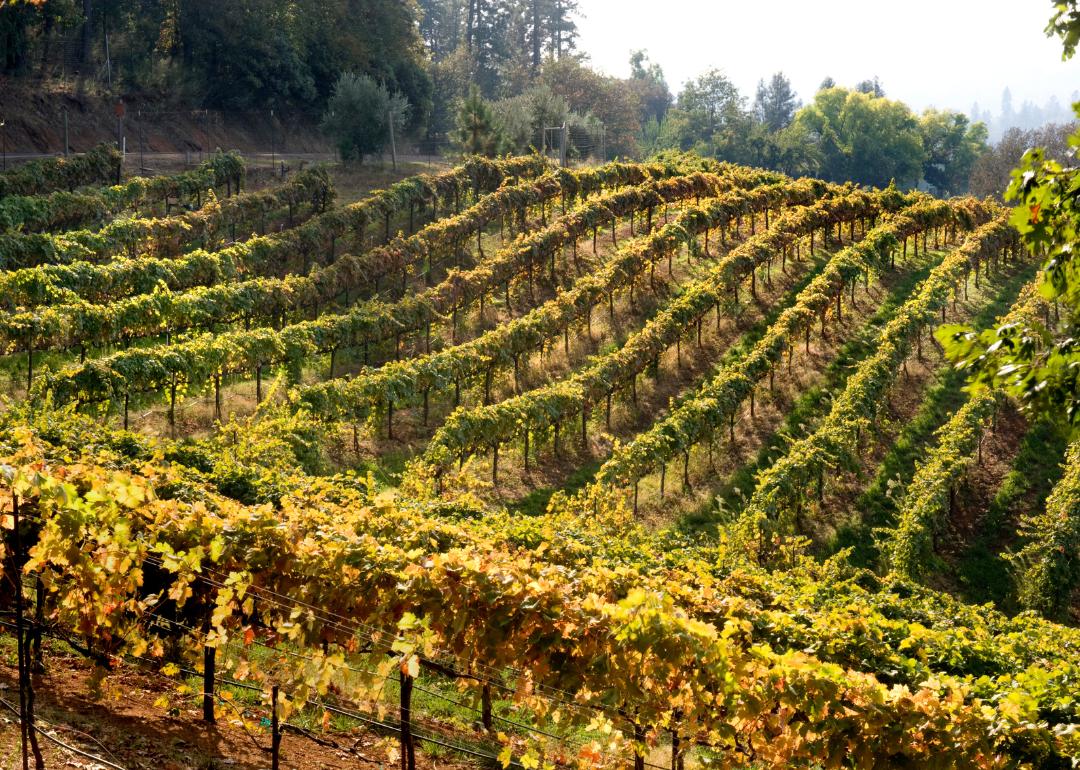
#7. Amador County
Canva
- Precipitation over the past year: 54.0 inches
- Comparison to 1901-2000 average: 21.1 inches above average (#4 rainiest September-August period since 1895)
- Comparison to state's precipitation over past year: 23.1 inches above statewide average
- Comparison to 1901-2000 average: 21.1 inches above average (#4 rainiest September-August period since 1895)
- Comparison to state's precipitation over past year: 23.1 inches above statewide average
#6. Mariposa County

Canva
- Precipitation over the past year: 67.5 inches
- Comparison to 1901-2000 average: 21.7 inches above average (#8 rainiest September-August period since 1895)
- Comparison to state's precipitation over past year: 36.6 inches above statewide average
- Comparison to 1901-2000 average: 21.7 inches above average (#8 rainiest September-August period since 1895)
- Comparison to state's precipitation over past year: 36.6 inches above statewide average
#5. Placer County
Canva
- Precipitation over the past year: 68.1 inches
- Comparison to 1901-2000 average: 23.4 inches above average (#6 rainiest September-August period since 1895)
- Comparison to state's precipitation over past year: 37.2 inches above statewide average
- Comparison to 1901-2000 average: 23.4 inches above average (#6 rainiest September-August period since 1895)
- Comparison to state's precipitation over past year: 37.2 inches above statewide average
#4. El Dorado County

Canva
- Precipitation over the past year: 56.8 inches
- Comparison to 1901-2000 average: 23.7 inches above average (#5 rainiest September-August period since 1895)
- Comparison to state's precipitation over past year: 25.9 inches above statewide average
- Comparison to 1901-2000 average: 23.7 inches above average (#5 rainiest September-August period since 1895)
- Comparison to state's precipitation over past year: 25.9 inches above statewide average
#3. Santa Cruz County
Canva
- Precipitation over the past year: 61.8 inches
- Comparison to 1901-2000 average: 25.6 inches above average (#3 rainiest September-August period since 1895)
- Comparison to state's precipitation over past year: 30.9 inches above statewide average
- Comparison to 1901-2000 average: 25.6 inches above average (#3 rainiest September-August period since 1895)
- Comparison to state's precipitation over past year: 30.9 inches above statewide average
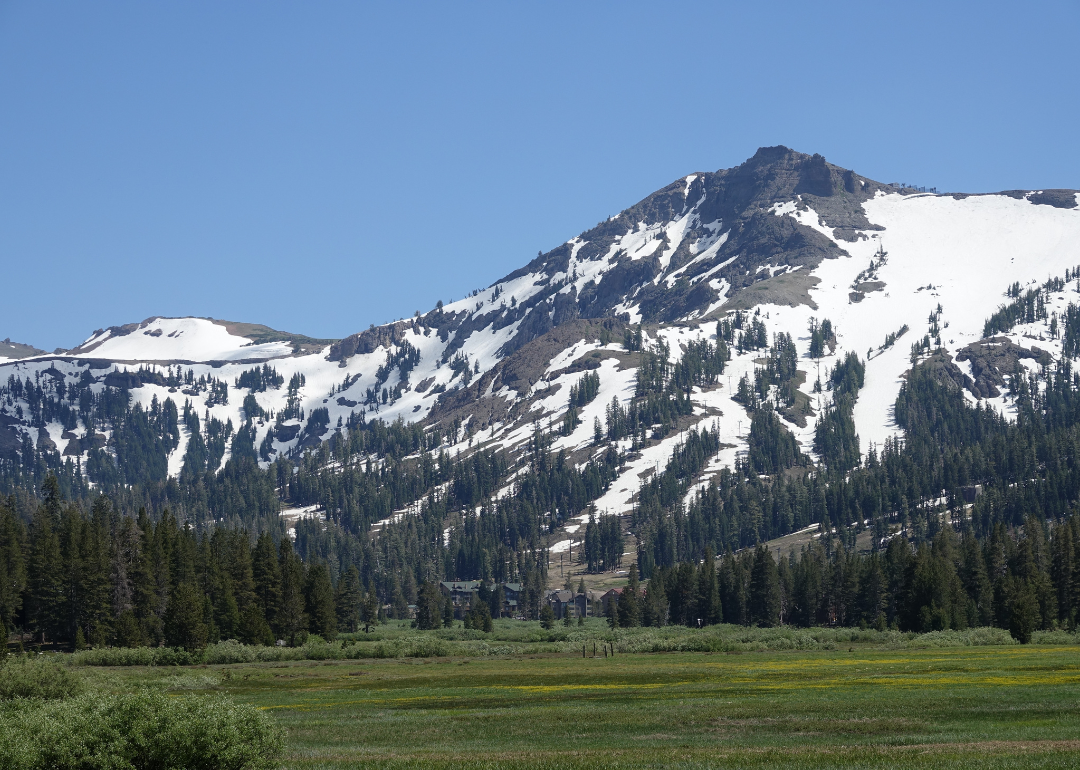
#2. Alpine County

StephanieFarrell // Shutterstock
- Precipitation over the past year: 69.3 inches
- Comparison to 1901-2000 average: 28.3 inches above average (#3 rainiest September-August period since 1895)
- Comparison to state's precipitation over past year: 38.4 inches above statewide average
- Comparison to 1901-2000 average: 28.3 inches above average (#3 rainiest September-August period since 1895)
- Comparison to state's precipitation over past year: 38.4 inches above statewide average
This story features data reporting and writing by Emma Rubin, and is part of a series utilizing data automation across 44 states.
#1. Tuolumne County
ND700 // Shutterstock