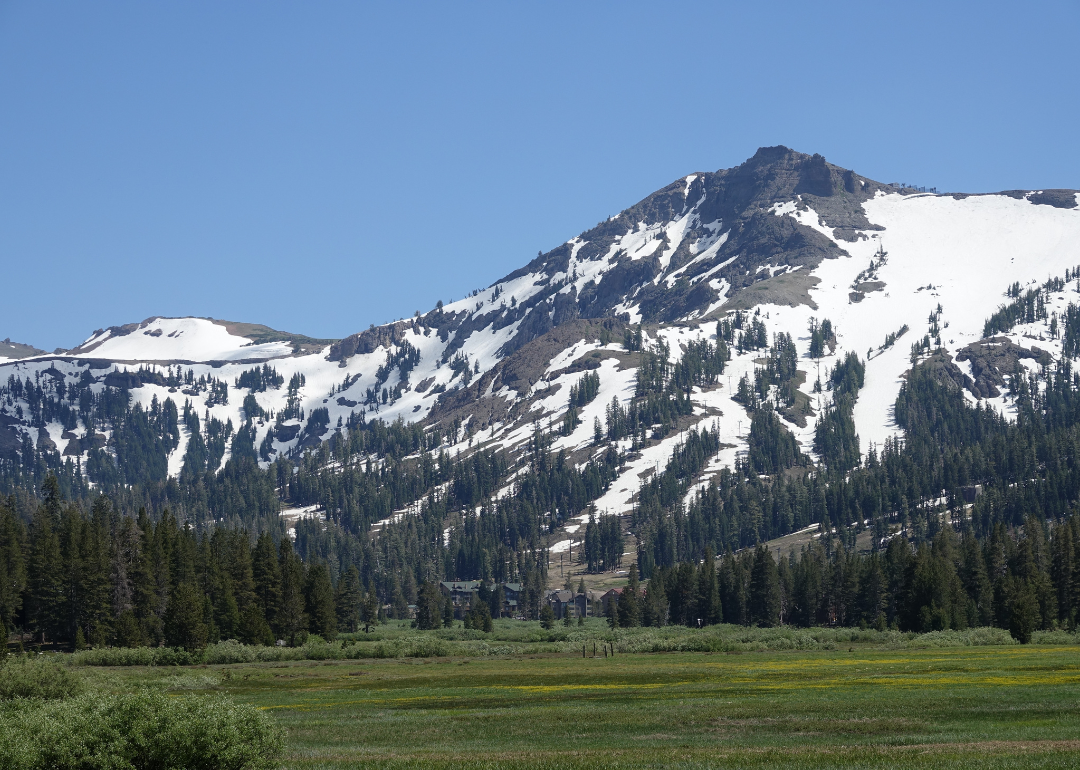
Counties with the most bridges in dire need of repair in California
- Bridges in poor condition: 9.1% (3 of 33 bridges)
- Square meters of bridges in poor condition: 10.3% (617 of 5,993 square meters of bridges)

- Bridges in poor condition: 9.4% (61 of 651 bridges)
- Square meters of bridges in poor condition: 7.8% (117,075 of 1,510,028 square meters of bridges)
- Bridges in poor condition: 9.4% (10 of 106 bridges)
- Square meters of bridges in poor condition: 6.4% (1,811 of 28,292 square meters of bridges)
- Bridges in poor condition: 9.6% (35 of 363 bridges)
- Square meters of bridges in poor condition: 35.1% (343,436 of 979,074 square meters of bridges)

- Bridges in poor condition: 9.8% (20 of 204 bridges)
- Square meters of bridges in poor condition: 6.5% (19,523 of 302,470 square meters of bridges)

- Bridges in poor condition: 10.0% (21 of 210 bridges)
- Square meters of bridges in poor condition: 10.7% (7,568 of 70,885 square meters of bridges)
- Bridges in poor condition: 10.2% (46 of 452 bridges)
- Square meters of bridges in poor condition: 11.5% (25,806 of 224,765 square meters of bridges)
- Bridges in poor condition: 10.2% (5 of 49 bridges)
- Square meters of bridges in poor condition: 6.1% (607 of 10,003 square meters of bridges)
- Bridges in poor condition: 10.7% (8 of 75 bridges)
- Square meters of bridges in poor condition: 10.6% (3,999 of 37,756 square meters of bridges)
- Bridges in poor condition: 10.9% (12 of 110 bridges)
- Square meters of bridges in poor condition: 5.4% (1,464 of 27,258 square meters of bridges)
- Bridges in poor condition: 12.0% (29 of 242 bridges)
- Square meters of bridges in poor condition: 24.7% (25,639 of 103,811 square meters of bridges)
- Bridges in poor condition: 12.3% (15 of 122 bridges)
- Square meters of bridges in poor condition: 14.0% (22,830 of 163,024 square meters of bridges)

- Bridges in poor condition: 12.6% (17 of 135 bridges)
- Square meters of bridges in poor condition: 9.4% (9,923 of 105,710 square meters of bridges)

- Bridges in poor condition: 12.6% (12 of 95 bridges)
- Square meters of bridges in poor condition: 2.6% (1,614 of 60,936 square meters of bridges)

- Bridges in poor condition: 13.1% (8 of 61 bridges)
- Square meters of bridges in poor condition: 6.6% (838 of 12,678 square meters of bridges)

- Bridges in poor condition: 13.4% (86 of 643 bridges)
- Square meters of bridges in poor condition: 14.8% (100,907 of 684,051 square meters of bridges)

- Bridges in poor condition: 14.0% (34 of 243 bridges)
- Square meters of bridges in poor condition: 8.8% (14,481 of 165,016 square meters of bridges)

- Bridges in poor condition: 15.0% (57 of 380 bridges)
- Square meters of bridges in poor condition: 18.5% (45,713 of 247,413 square meters of bridges)

- Bridges in poor condition: 16.6% (32 of 193 bridges)
- Square meters of bridges in poor condition: 9.4% (10,846 of 115,316 square meters of bridges)

- Bridges in poor condition: 23.0% (14 of 61 bridges)
- Square meters of bridges in poor condition: 15.4% (3,847 of 24,985 square meters of bridges)
