The top cities for US job seekers in 2024
There are jobs across the country in cities that fell into the rankings for more than half of the key economic factors that were measured.
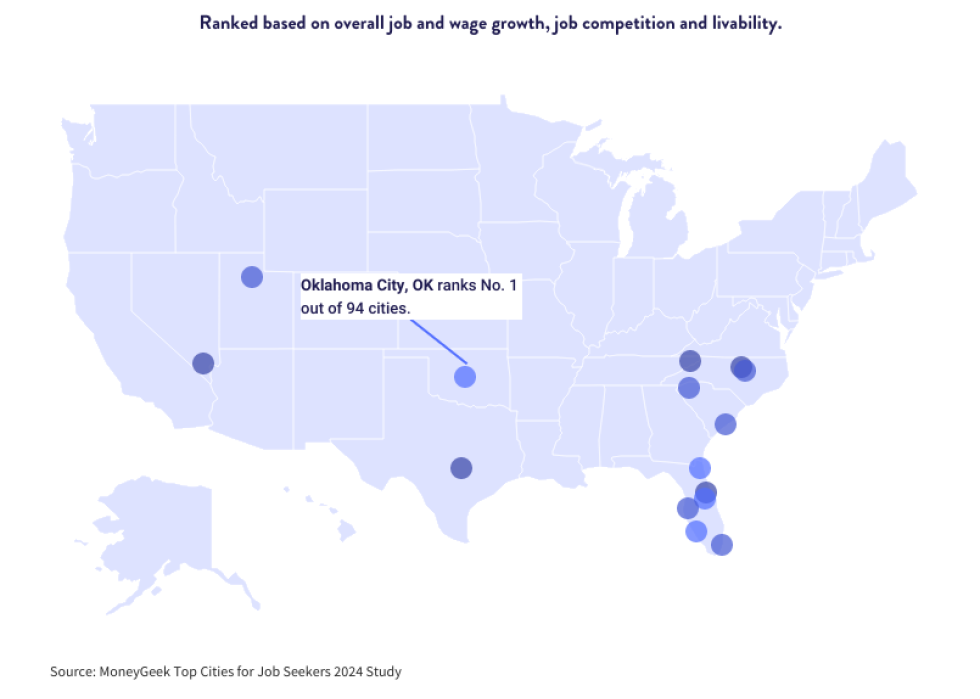
The best (and worst) cities for job seekers in the U.S.
MoneyGeek analyzed 94 of the largest cities in the United States to find the best and worst places for job seekers in 2024. The analysis looked at each community's growth in employment from 2022 to 2023 and from 2020 to 2023, growth in hourly wages from 2022 to 2023, current unemployment rate, current labor force size and average monthly wage over monthly rent ratio to determine the rankings. The most important factors — including three-year and one-year employment growth and growth in hourly wages — were double-weighted (22%), while the other factors each contributed 11%.
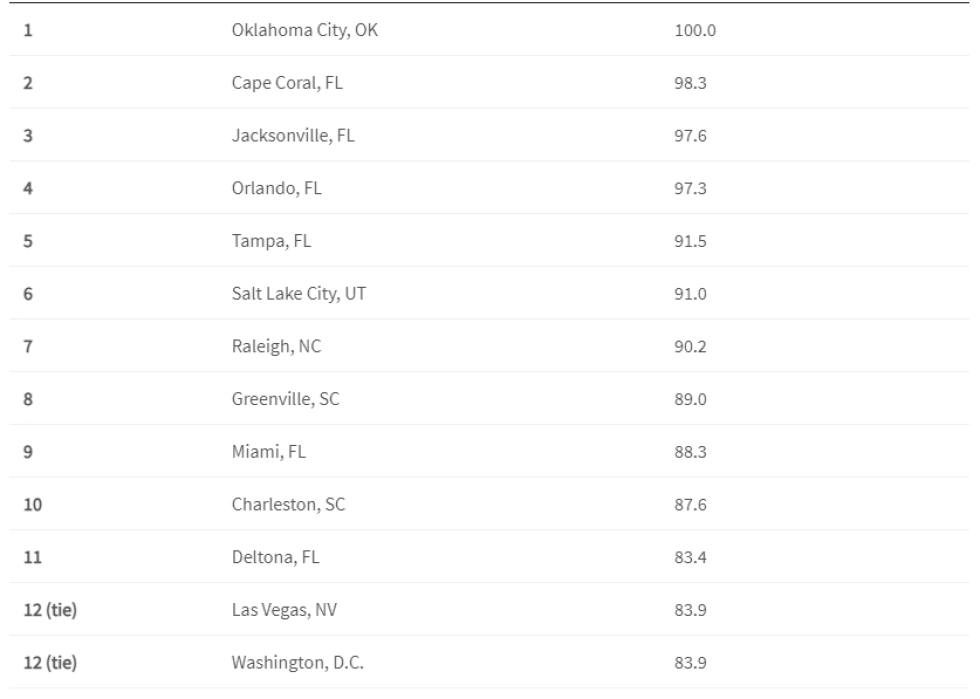
The best cities for job seekers have impressive job and wage growth, low job competition and affordable housing prices; in other words, they provide solid employment opportunities and low-cost living.
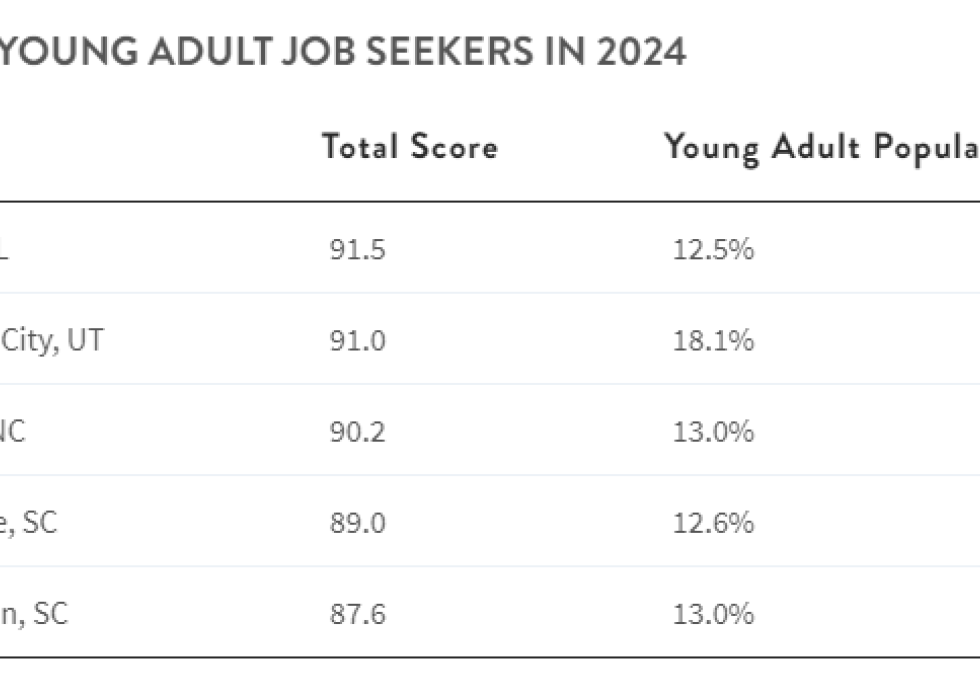
Some of the cities with the highest earnings growth and low unemployment had a higher-than-average concentration of young adults, defined as individuals aged 18 to 24. Of the cities analyzed, young adults constituted 12.2% of the population, on average. Below are the five cities ranked in the 10 best cities that also have an above-average young adult population; these could be excellent places for young people new to the job market to find opportunity and community.
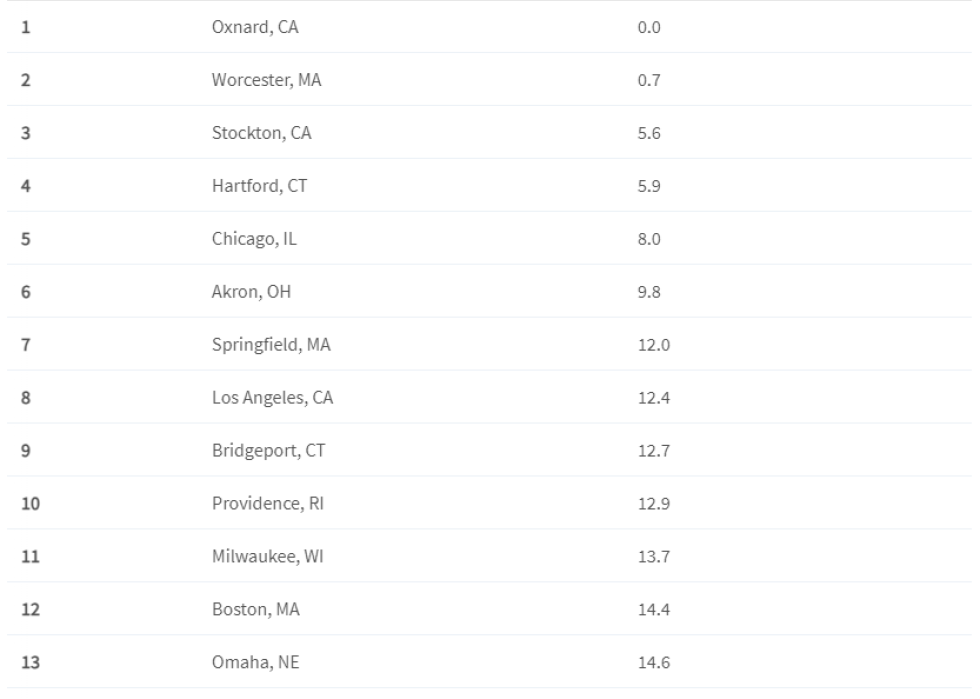
While the top cities on our list are affordable, growing and relatively uncompetitive, the worst cities for job seekers tend to have slower wage and job growth, less affordable housing relative to income and competitive job markets. These 15 cities ranked the lowest on this list.
Factors that make a city ideal for job seekers
MoneyGeek ranked the best and worst cities using four key factors — job growth, wage growth, unemployment rate and housing-to-income ratio — to better understand which cities best served those seeking employment and which fell flat. These factors all contribute to what makes a city attractive or less-than-ideal for job seekers; many cities excel in some areas but fall short in others.
To better understand how well or poorly cities performed in each of the ranking categories, MoneyGeek found the best (and worst) cities for each category. You can find those rankings — along with a brief description of their significance — below.
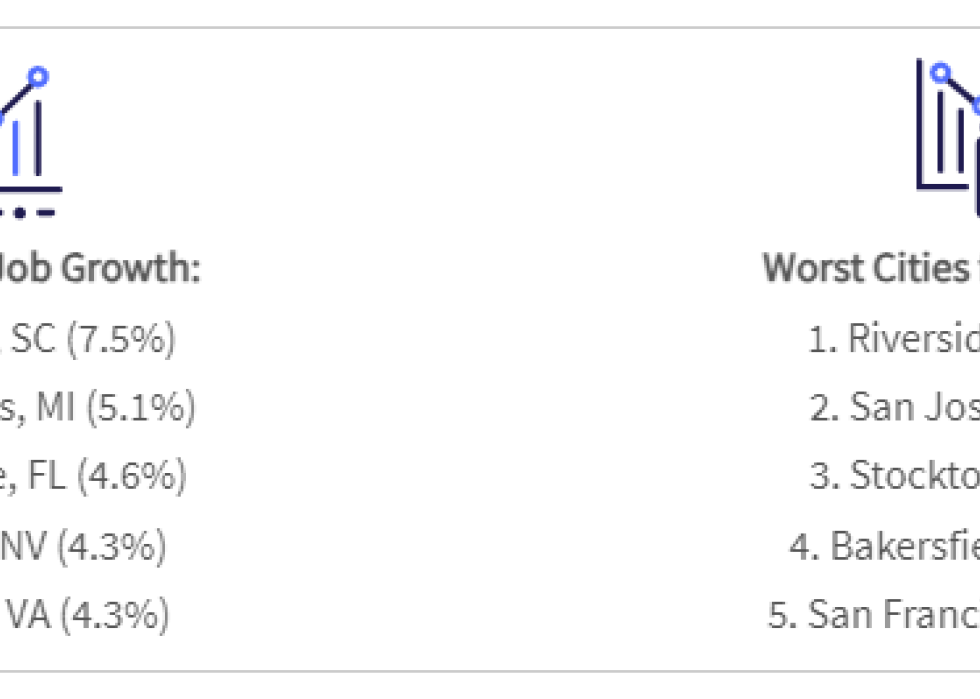
In 2024, Charleston, South Carolina, had the highest job growth in the last 12 months, while the five worst cities for job growth were all in California.
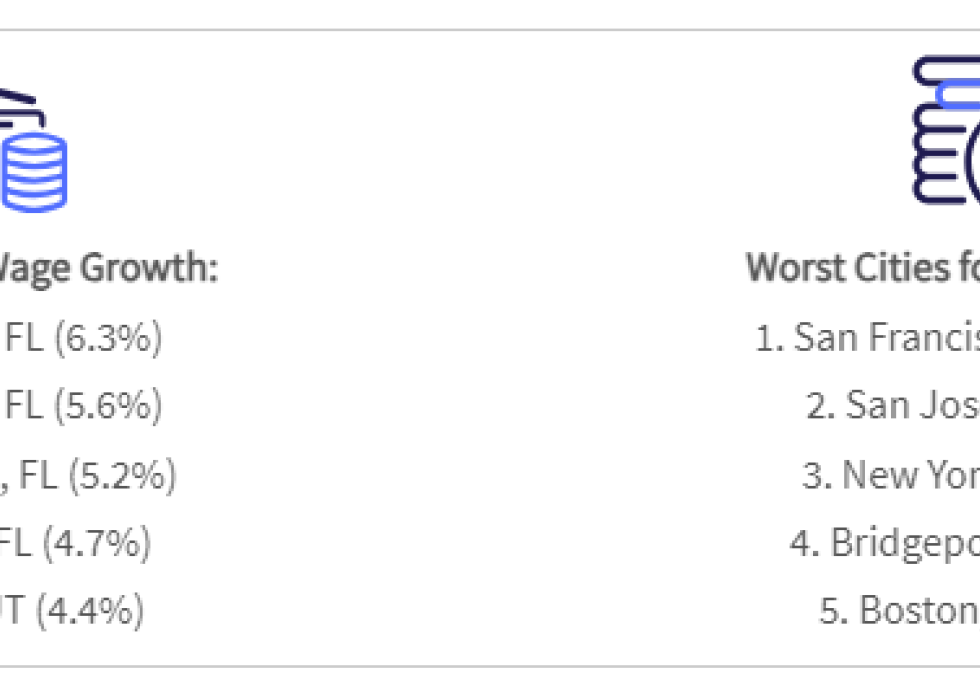
When wages grow, a city is doing something right. Palm Bay, Florida's 12-month wage growth tops MoneyGeek's list with 6.3% wage growth. Meanwhile, San Francisco, California, has experienced a 12.2% wage decline since 2022.
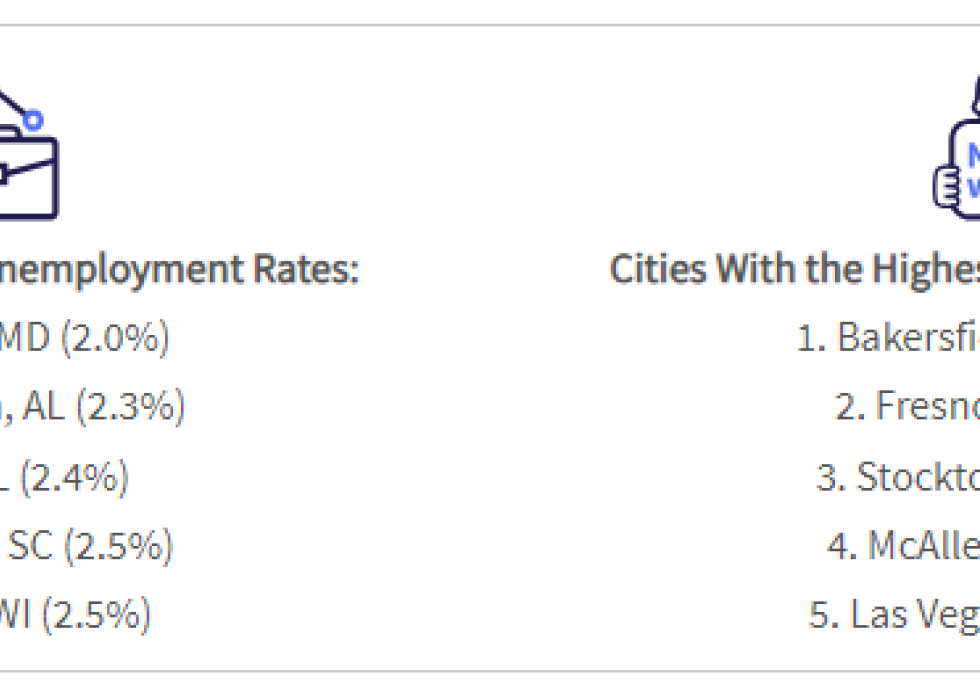
Naturally, it's a good sign for a job seeker if you see a city with low unemployment; ultimately, it means your odds of being hired at a new job should be pretty good. Baltimore, Maryland, is MoneyGeek's standout in this category, with just 2% unemployment.
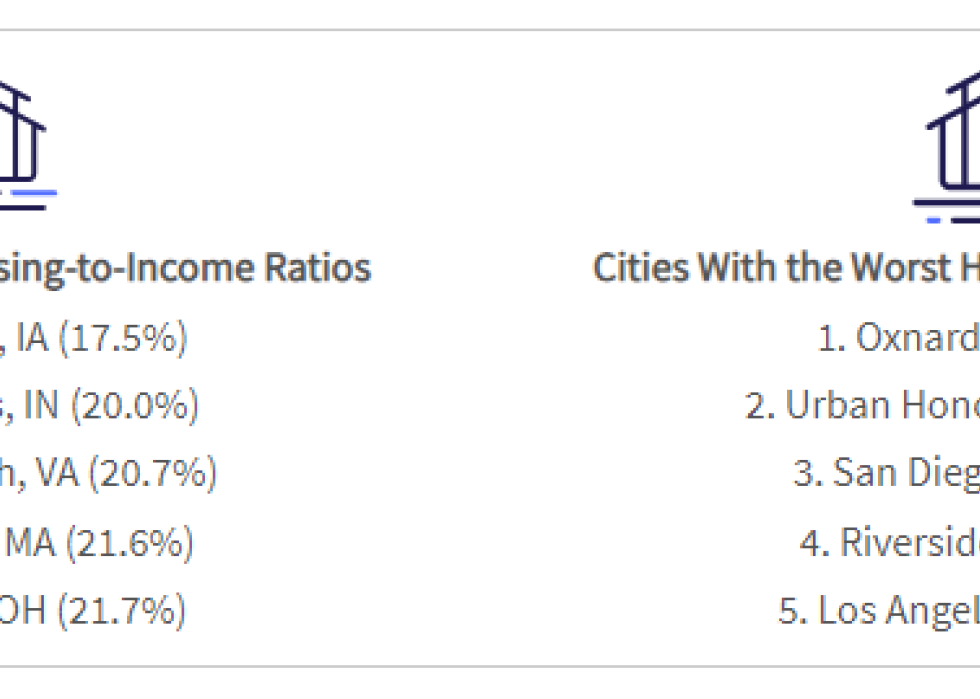
A city's housing-to-income ratio roughly translates to its affordability; the less money you spend on rent and housing compared to your overall income, the more money you have for everything else. That's why your money goes much further in Des Moines, Iowa, than in more expensive cities like Oxnard, California, or Honolulu, Hawaii. In Des Moines, monthly rent costs just under 18% of the average monthly income. After paying for housing in Oxnard or Honolulu, you'll have to spend more than half of your income on housing and be left with the other half to cover all other expenses.
Financial tips for job seekers
Relocating to a new city to find a job can be time-consuming and expensive, especially if this isn't a cross-town journey and you're moving out of state. If you're going to move to a new city without having a job lined up, consider the following:
Ensure you have adequate savings. Start saving as much as possible to ensure you have a financial safety net in your new city. After all, you may move somewhere where jobs are plentiful, but the interview process could take longer than you imagine. A robust savings account also means you can be choosier about the jobs you pick, and you'll have something to sustain you if your first job doesn't last long.
Try not to rely too much on credit cards. Yes, credit cards are an indispensable cash flow tool and, if you have a credit card with rewards, an excellent way to make money. Use your credit cards well, and those cash back rewards could mean significant savings on your purchases. But if you move somewhere without a job and don't find employment immediately, the credit card debt you're accruing could eventually mean that much of your future paycheck will be devoted to paying off revolving debt.
Research your new city and make a plan. As in, figure out where you may live. Will you start off in a hotel or an apartment complex? Or somewhere in between? Have you used a cost of living calculator to crunch the numbers and see what it will cost you to live there, including possible mortgage prices? The more information you have, the better you'll feel about your decision.
Methodology
To rank the best cities for job seekers, MoneyGeek calculated three factors using earnings data and employment statistics from the U.S. Bureau of Labor Statistics and median rent rates reported by the Department of Housing and Urban Development to estimate how good a city is for someone seeking jobs. Data for 94 areas with labor forces of at least 300,000 was analyzed in order to find cities with the best opportunities for job seekers across the U.S.
The first factor that was calculated is overall growth, which incorporates the trends in jobs created and trends in wages.
The next consideration is job competition, which includes the unemployment rate and the overall size of the employment numbers, reflecting greater absolute availability of jobs.
The final factor is housing affordability, which captures the ratio of wages over rents to indicate an area's cost of living.
Additionally, MoneyGeek used 2022 U.S. Census Bureau data to analyze which cities had a higher-than-average population of young adult (18 to 24) residents for job-seeking new college graduates.
MoneyGeek used the following metrics in its analysis:
- Employment Growth Over One Year (22% weight): This metric assesses the increase in employment from December 2022 to December 2023.
- Employment Growth Over Three Years (22% weight): This compares employment figures from December 2020 to December 2023.
- Growth in Hourly Wages Over One Year (22% weight): This evaluates the rise in average hourly earnings from 2022 to 2023.
- Unemployment Rate (11% weight): Data is for 2023.
- Labor Force Size (11% weight): The total civilian labor force in each city in 2023.
- Ratio of Monthly Wages to Monthly Rents (11% weight): Calculated from 2023 data, this ratio measures the affordability of living based on monthly earnings versus rent expenses, with a higher ratio indicating more favorable conditions for workers.
For the purposes of this analysis, only metropolitan statistical areas (MSAs) with a labor force of at least 300,000 were considered in the ranking.
Full dataset
The data points presented are defined as follows:
- Rank: The city's rank in the overall analysis determined by its Total Score, with a lower rank indicating a higher Total Score.
- Total Score: The city's overall score — with a higher score indicating more favorable conditions for job seekers.
Other metrics and weights used in the calculations are specified in the Methodology section above.