Workers suffer the most injuries in these 25 jobs

- Injury and illness rate: 376.3 per 10,000 full-time workers
- Total injury and illness cases: 2,310
- Median days out: 11

- Injury and illness rate: 385.3 per 10,000 full-time workers
- Total injury and illness cases: 90,170
- Median days out: 13

- Injury and illness rate: 386.5 per 10,000 full-time workers
- Total injury and illness cases: 13,750
- Median days out: 12

- Injury and illness rate: 392.7 per 10,000 full-time workers
- Total injury and illness cases: 540
- Median days out: 12

- Injury and illness rate: 394.0 per 10,000 full-time workers
- Total injury and illness cases: 2,830
- Median days out: 14

- Injury and illness rate: 395.9 per 10,000 full-time workers
- Total injury and illness cases: 4,220
- Median days out: 15

- Injury and illness rate: 419.7 per 10,000 full-time workers
- Total injury and illness cases: 5,440
- Median days out: 3

- Injury and illness rate: 423.2 per 10,000 full-time workers
- Total injury and illness cases: 24,120
- Median days out: 11

- Injury and illness rate: 444.2 per 10,000 full-time workers
- Total injury and illness cases: 1,320
- Median days out: 12
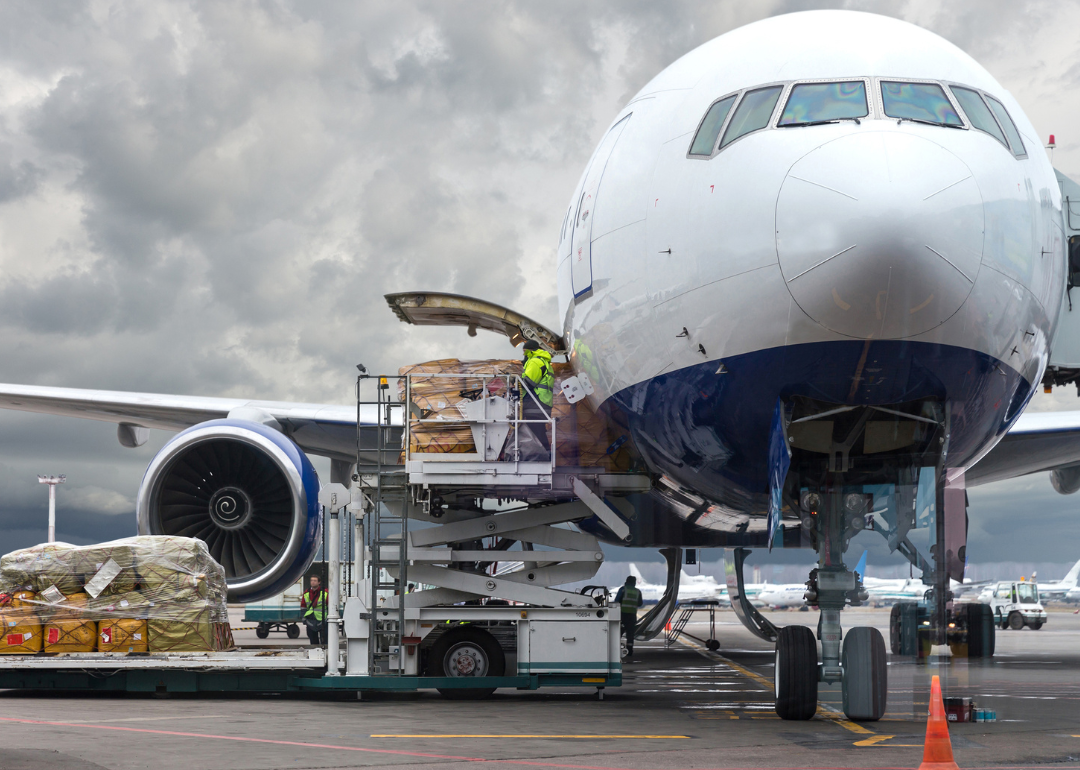
- Injury and illness rate: 460.1 per 10,000 full-time workers
- Total injury and illness cases: 390
- Median days out: 95
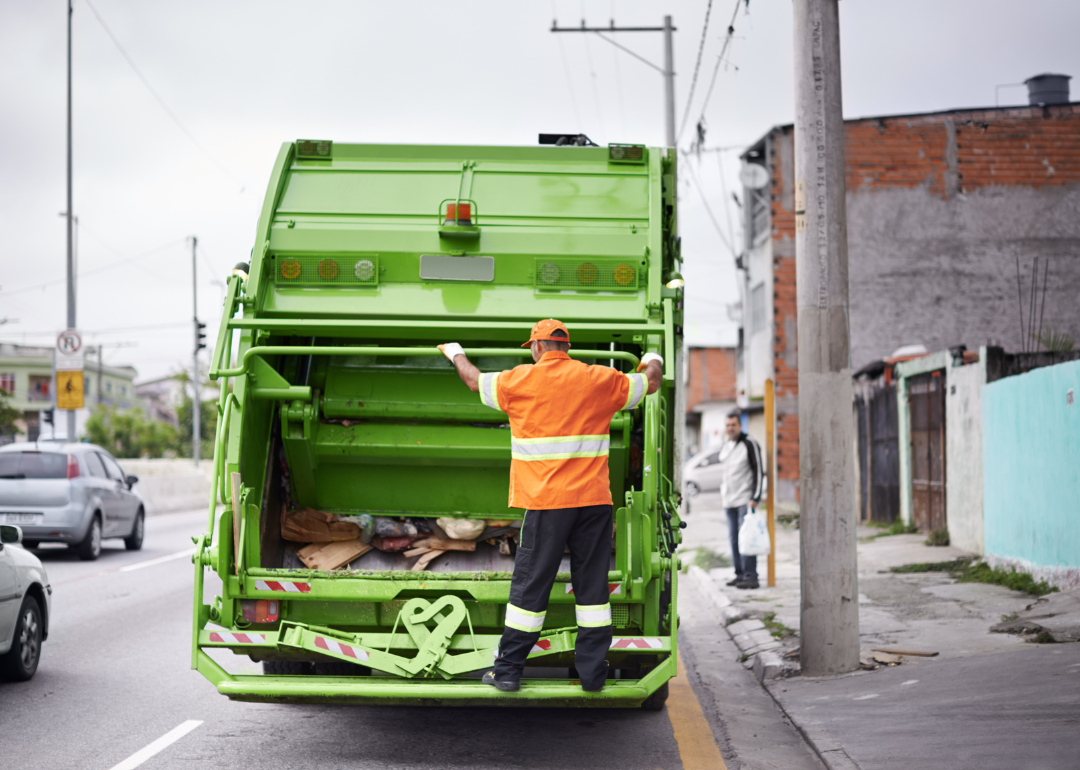
- Injury and illness rate: 476.8 per 10,000 full-time workers
- Total injury and illness cases: 4,650
- Median days out: 19

- Injury and illness rate: 484.6 per 10,000 full-time workers
- Total injury and illness cases: 2,380
- Median days out: 14

- Injury and illness rate: 491.1 per 10,000 full-time workers
- Total injury and illness cases: 7,300
- Median days out: 46

- Injury and illness rate: 539.0 per 10,000 full-time workers
- Total injury and illness cases: 17,890
- Median days out: 14

- Injury and illness rate: 567.9 per 10,000 full-time workers
- Total injury and illness cases: 3,270
- Median days out: 14

- Injury and illness rate: 588.4 per 10,000 full-time workers
- Total injury and illness cases: 30,960
- Median days out: 12

- Injury and illness rate: 685.3 per 10,000 full-time workers
- Total injury and illness cases: 38,930
- Median days out: 11

- Injury and illness rate: 714.4 per 10,000 full-time workers
- Total injury and illness cases: 5,110
- Median days out: 22

- Injury and illness rate: 799.4 per 10,000 full-time workers
- Total injury and illness cases: 27,630
- Median days out: 14

- Injury and illness rate: 849.0 per 10,000 full-time workers
- Total injury and illness cases: 2,780
- Median days out: 11

- Injury and illness rate: 904.4 per 10,000 full-time workers
- Total injury and illness cases: 350
- Median days out: 14

- Injury and illness rate: 1,000.6 per 10,000 full-time workers
- Total injury and illness cases: 6,840
- Median days out: 6

- Injury and illness rate: 1,014.4 per 10,000 full-time workers
- Total injury and illness cases: 103,300
- Median days out: 12

- Injury and illness rate: 1,383.7 per 10,000 full-time workers
- Total injury and illness cases: 5,360
- Median days out: 10

- Injury and illness rate: 3,092.9 per 10,000 full-time workers
- Total injury and illness cases: 6,550
- Median days out: 10
