Cities with the most expensive homes in the Boulder metro area
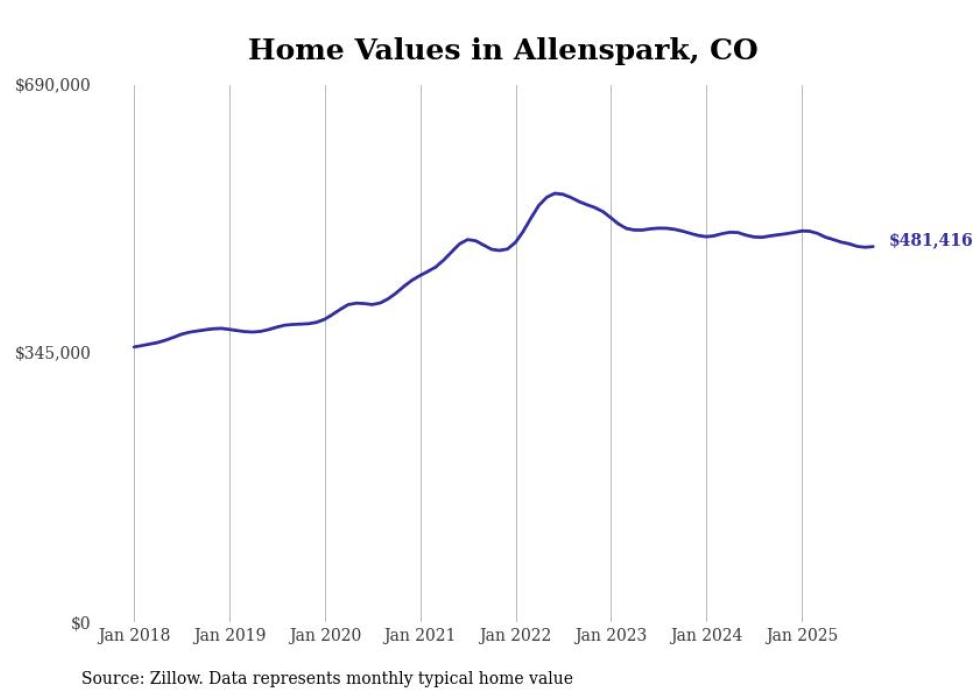
- Typical home value: $481,416
- 1-year price change: -3.0%
- 5-year price change: +14.1%
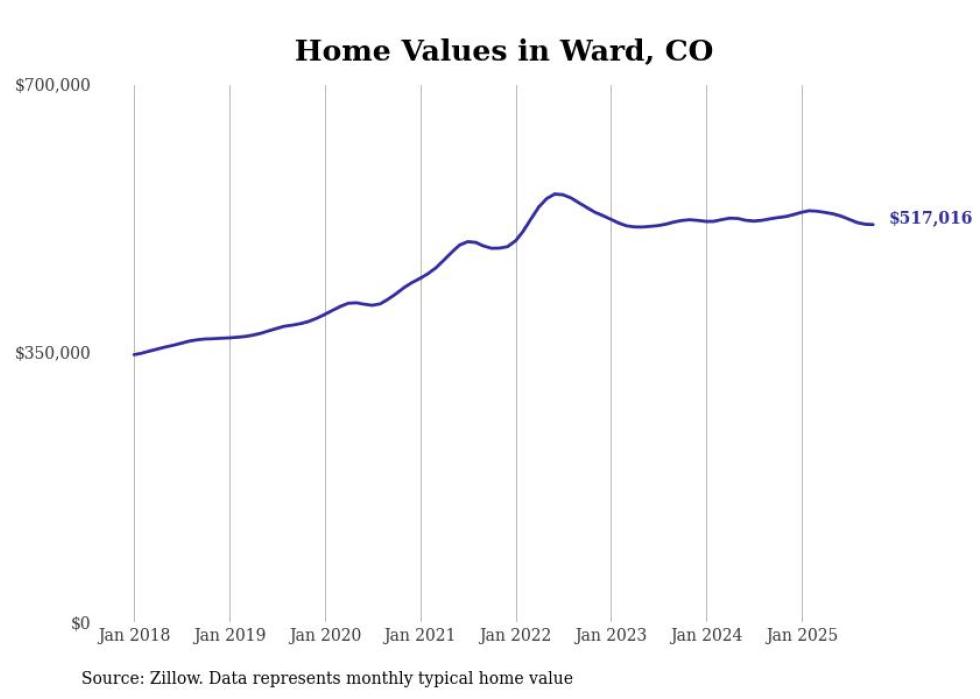
- Typical home value: $517,016
- 1-year price change: -1.7%
- 5-year price change: +21.0%
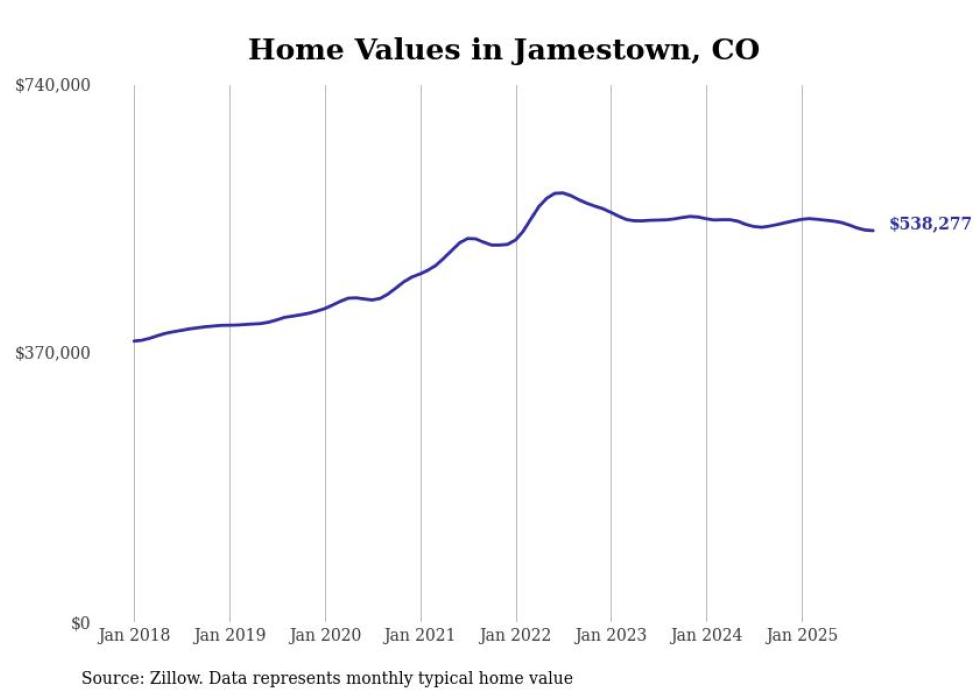
- Typical home value: $538,277
- 1-year price change: -1.5%
- 5-year price change: +17.1%
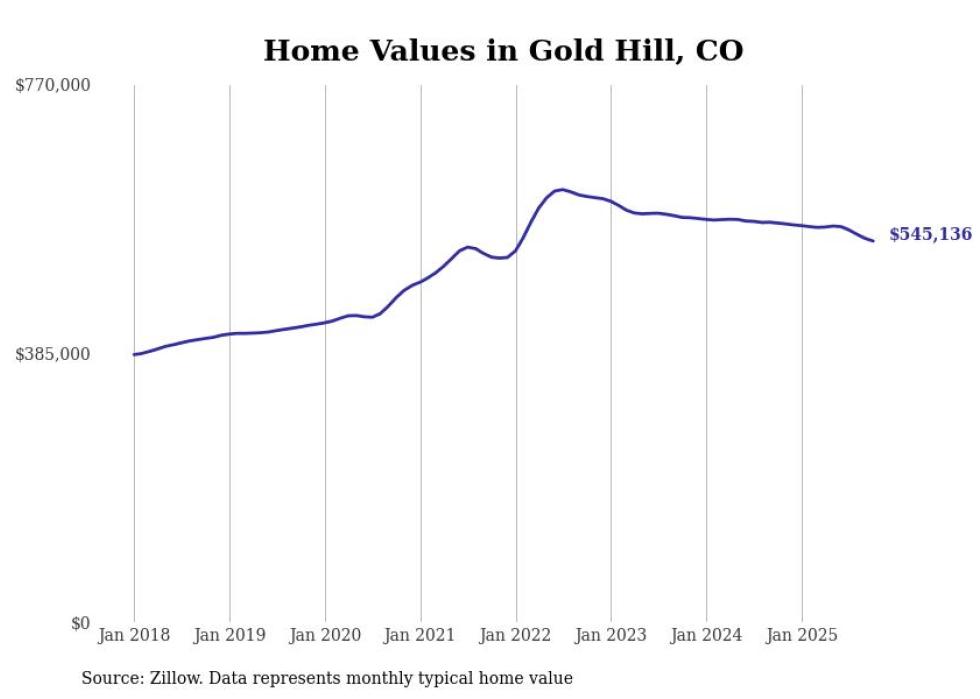
- Typical home value: $545,136
- 1-year price change: -4.5%
- 5-year price change: +17.4%
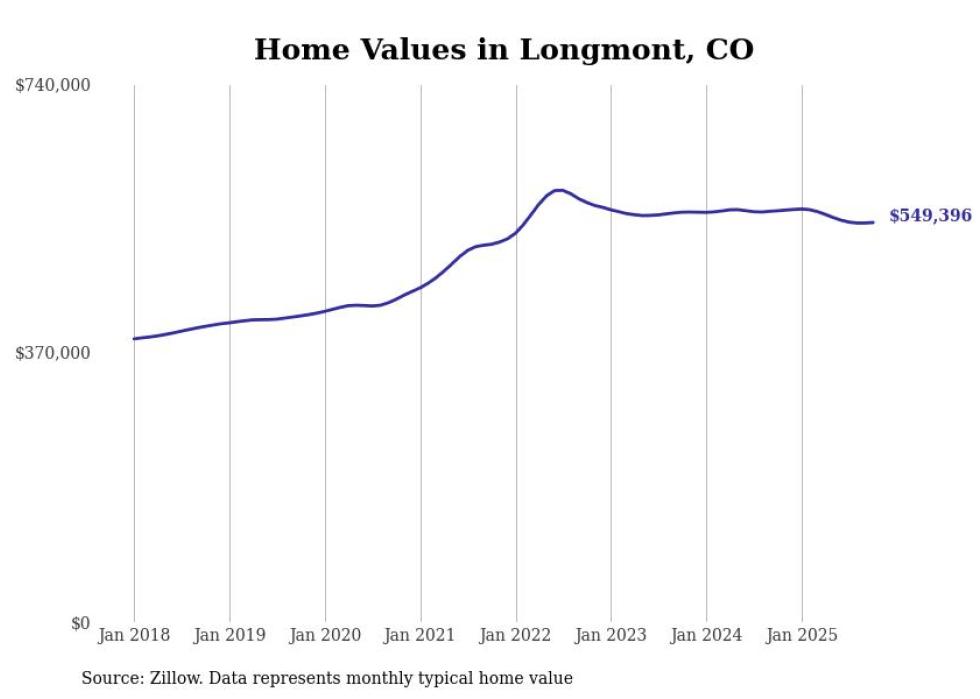
- Typical home value: $549,396
- 1-year price change: -2.9%
- 5-year price change: +23.8%
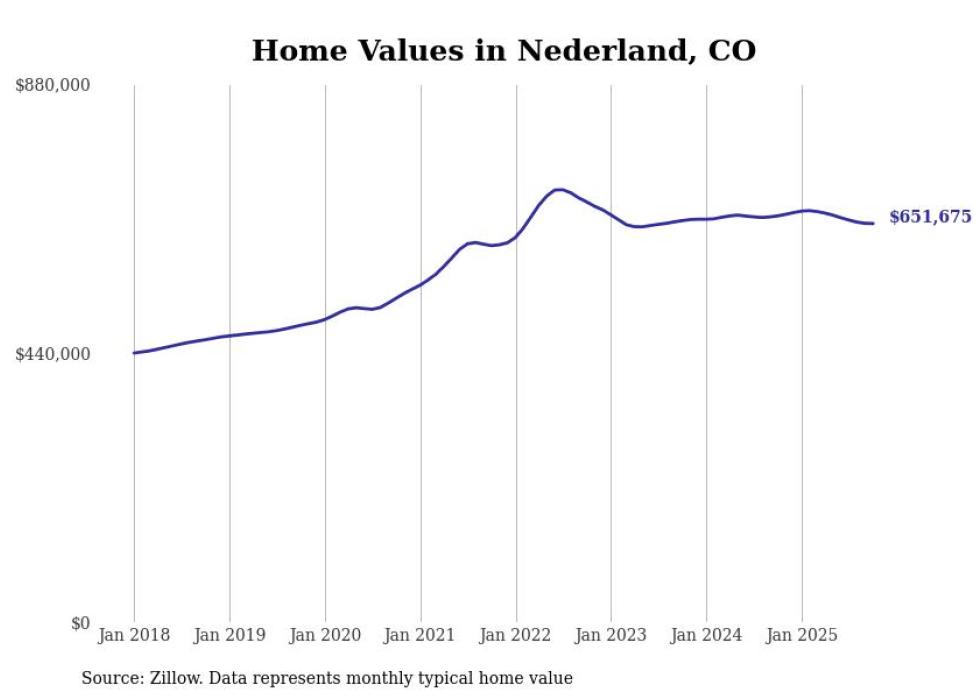
- Typical home value: $651,675
- 1-year price change: -1.9%
- 5-year price change: +23.0%
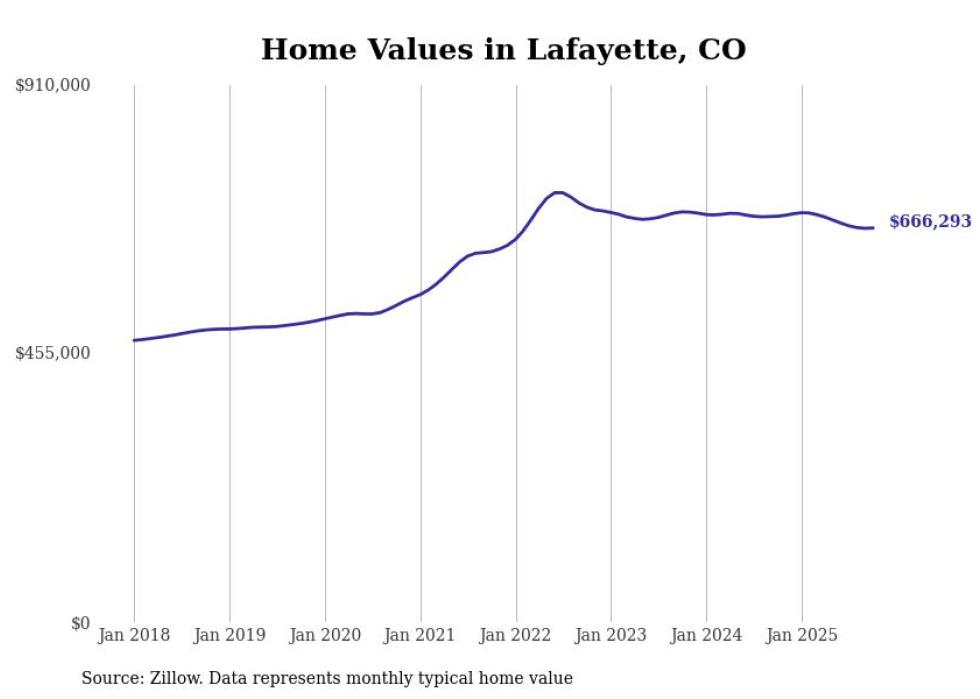
- Typical home value: $666,293
- 1-year price change: -2.9%
- 5-year price change: +24.5%
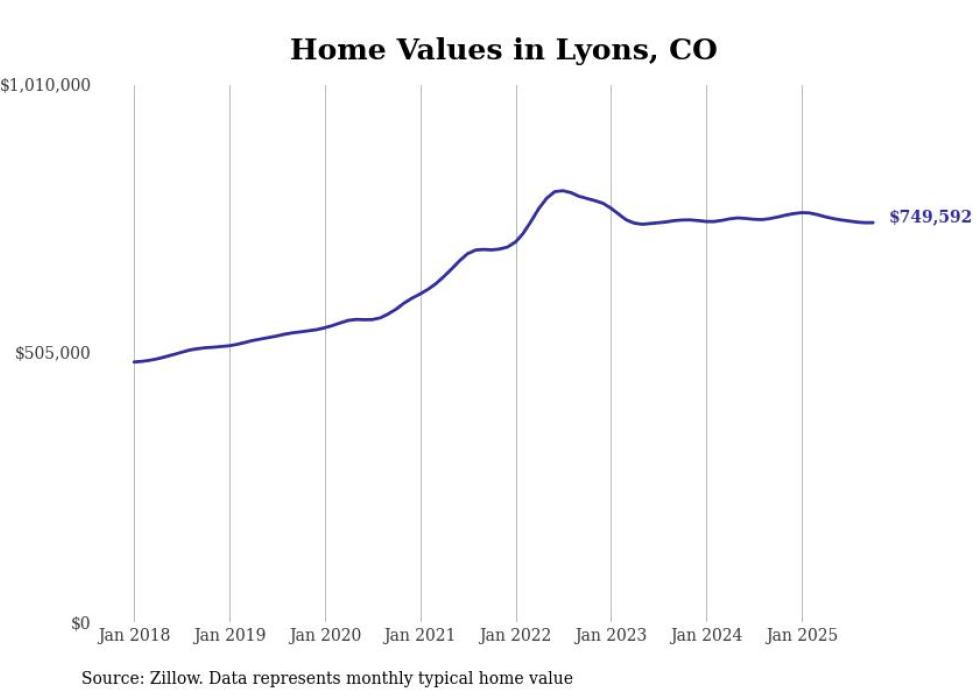
- Typical home value: $749,592
- 1-year price change: -1.4%
- 5-year price change: +27.6%
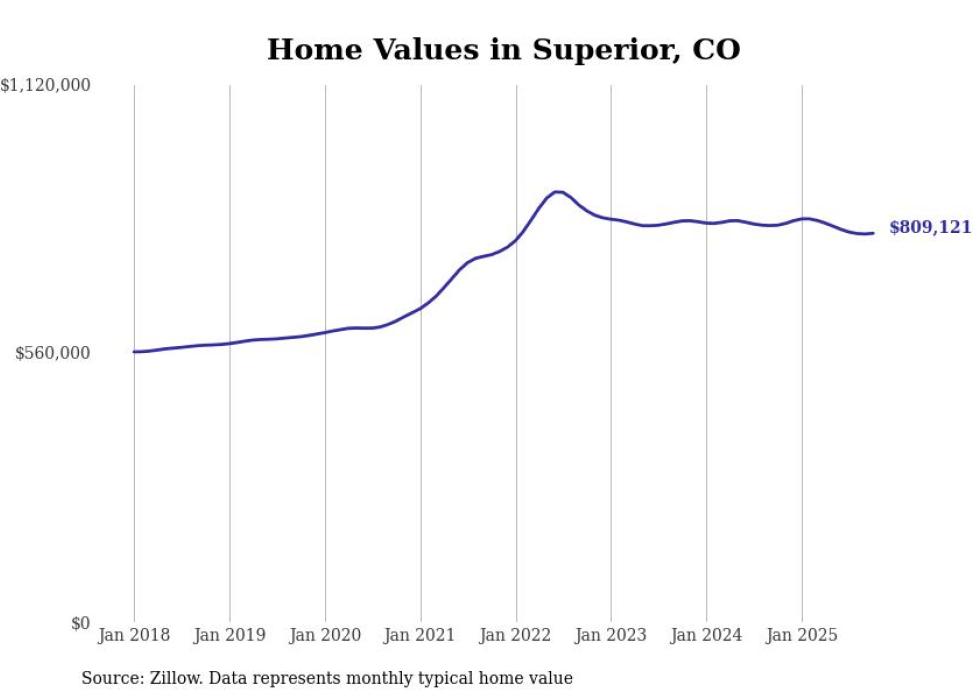
- Typical home value: $809,121
- 1-year price change: -2.0%
- 5-year price change: +29.1%
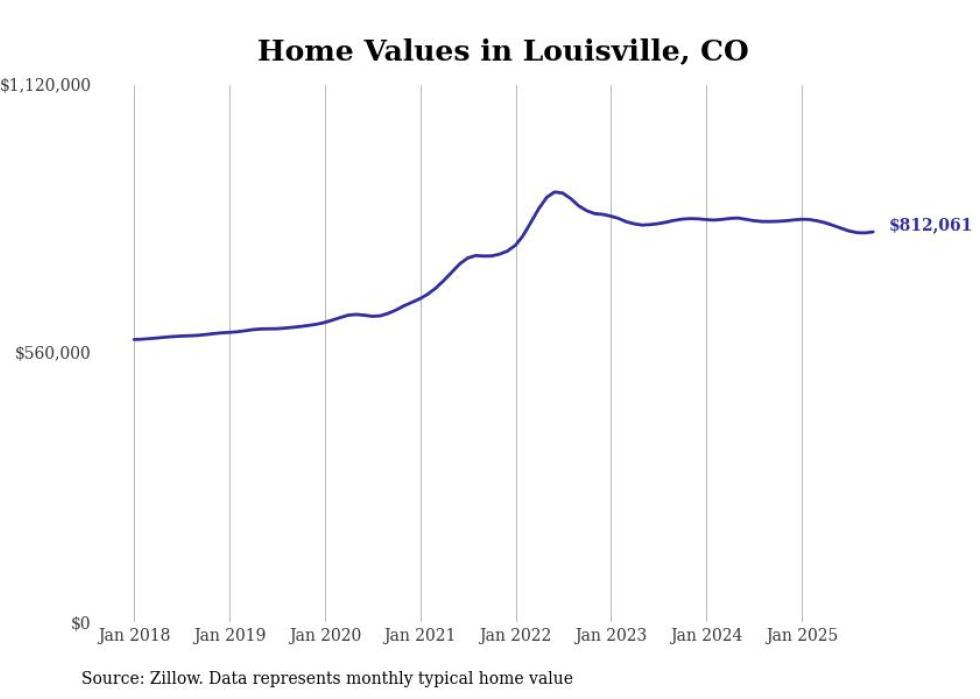
- Typical home value: $812,061
- 1-year price change: -2.6%
- 5-year price change: +25.0%
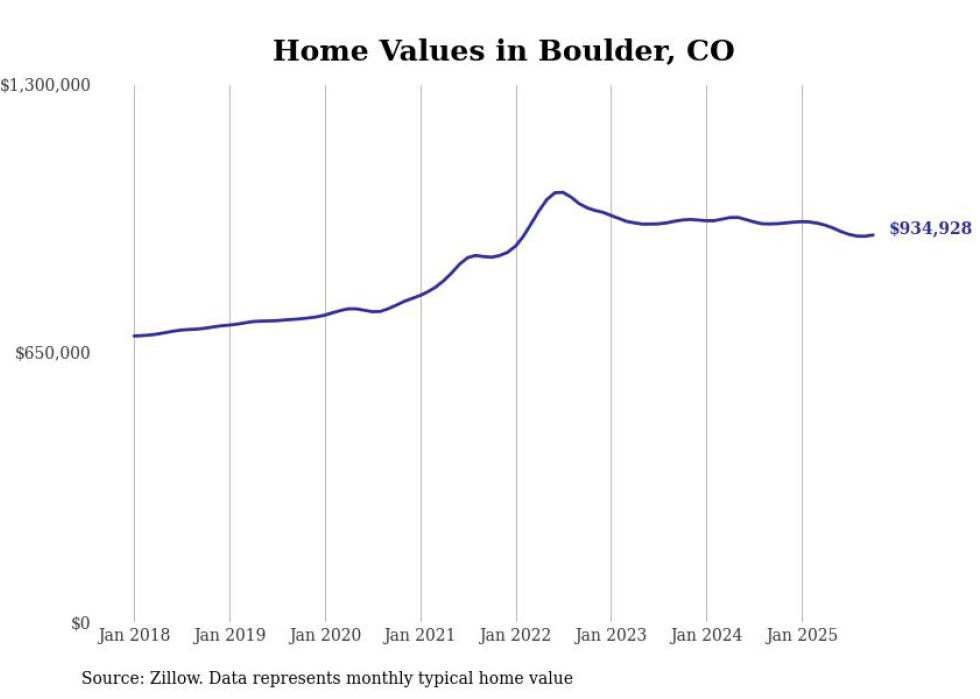
- Typical home value: $934,928
- 1-year price change: -2.9%
- 5-year price change: +22.2%
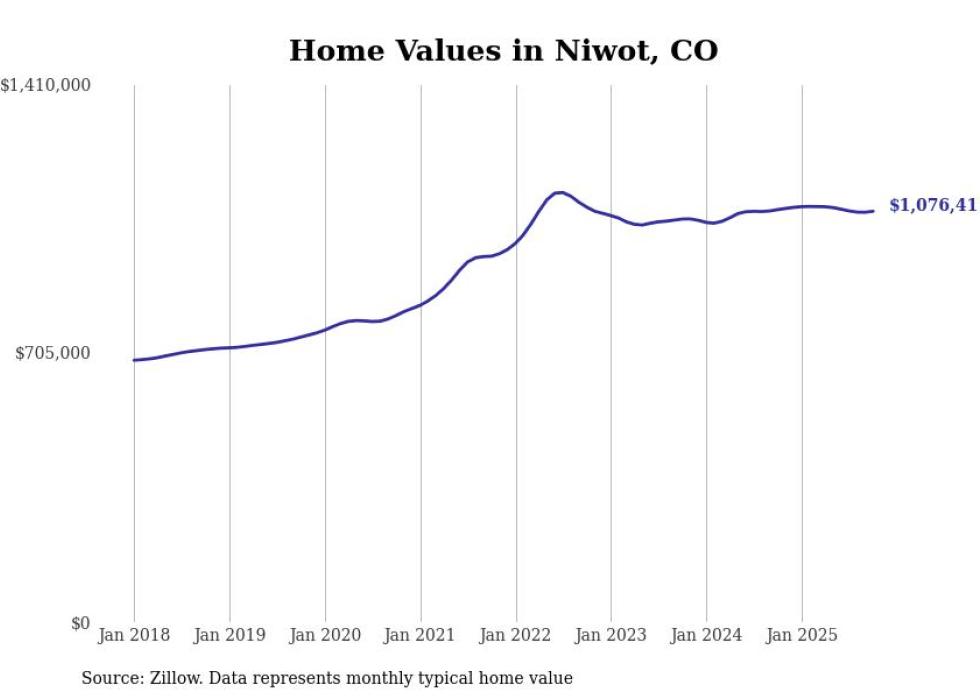
- Typical home value: $1,076,411
- 1-year price change: -0.4%
- 5-year price change: +34.0%