Counties with the highest rates of strokes in Connecticut

Canva
- Age-adjusted rate of all strokes among adults, estimates for 2021: 2.3% (range between 2.0% and 2.6%)
- Death rate for ischemic strokes, 2018-20: 13.6 per 100K people
- Death rate for hemorrhagic strokes, 2018-20: 6.9 per 100K people
- Death rate for ischemic strokes, 2018-20: 13.6 per 100K people
- Death rate for hemorrhagic strokes, 2018-20: 6.9 per 100K people
#8. Middlesex County

Canva
- Age-adjusted rate of all strokes among adults, estimates for 2021: 2.4% (range between 2.1% and 2.8%)
- Death rate for ischemic strokes, 2018-20: 12.5 per 100K people
- Death rate for hemorrhagic strokes, 2018-20: 6.6 per 100K people
- Death rate for ischemic strokes, 2018-20: 12.5 per 100K people
- Death rate for hemorrhagic strokes, 2018-20: 6.6 per 100K people
#7. Fairfield County

illstudio // Shutterstock
- Age-adjusted rate of all strokes among adults, estimates for 2021: 2.4% (range between 2.1% and 2.7%)
- Death rate for ischemic strokes, 2018-20: 13.0 per 100K people
- Death rate for hemorrhagic strokes, 2018-20: 7.3 per 100K people
- Death rate for ischemic strokes, 2018-20: 13.0 per 100K people
- Death rate for hemorrhagic strokes, 2018-20: 7.3 per 100K people
#6. Tolland County
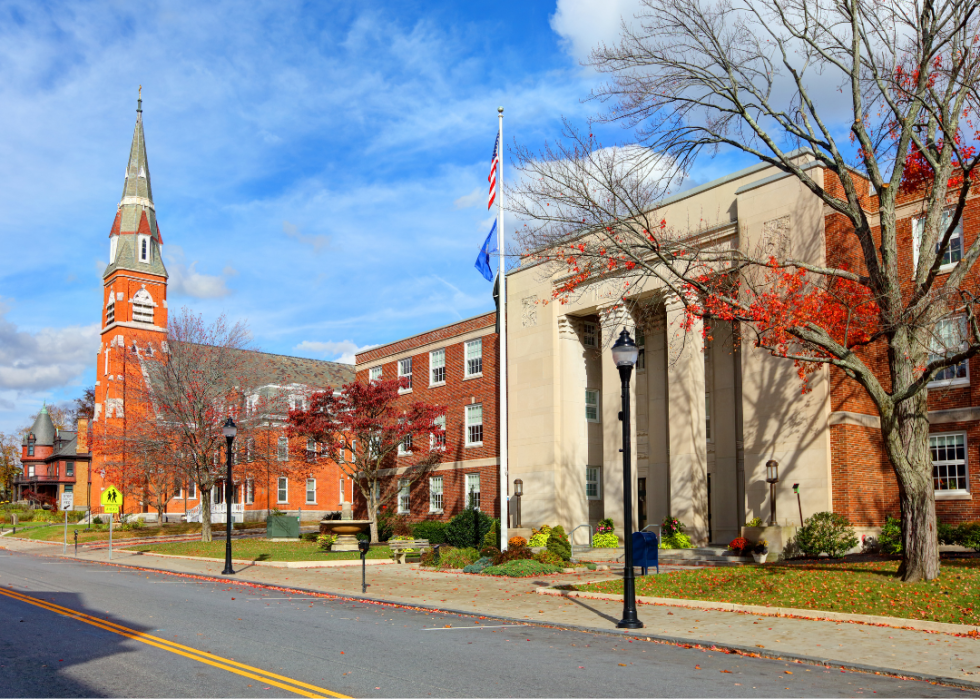
Canva
- Age-adjusted rate of all strokes among adults, estimates for 2021: 2.4% (range between 2.1% and 2.7%)
- Death rate for ischemic strokes, 2018-20: 13.9 per 100K people
- Death rate for hemorrhagic strokes, 2018-20: 6.9 per 100K people
- Death rate for ischemic strokes, 2018-20: 13.9 per 100K people
- Death rate for hemorrhagic strokes, 2018-20: 6.9 per 100K people
#5. Litchfield County
Canva
- Age-adjusted rate of all strokes among adults, estimates for 2021: 2.5% (range between 2.2% and 2.8%)
- Death rate for ischemic strokes, 2018-20: 14.0 per 100K people
- Death rate for hemorrhagic strokes, 2018-20: 7.0 per 100K people
- Death rate for ischemic strokes, 2018-20: 14.0 per 100K people
- Death rate for hemorrhagic strokes, 2018-20: 7.0 per 100K people
You may also like: See how much delivery drivers in Connecticut make
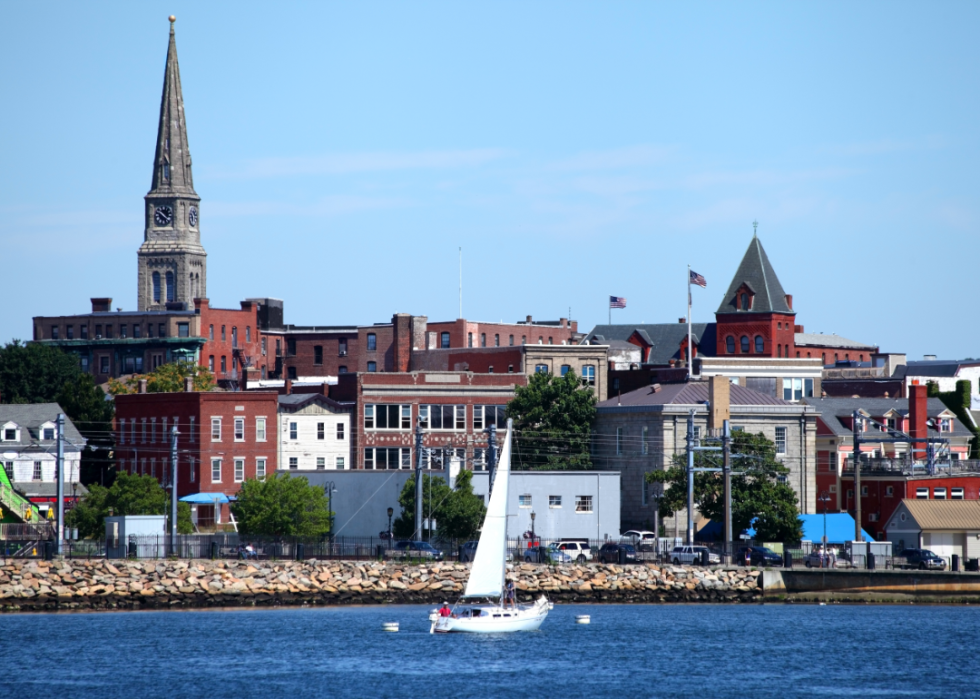
#4. New London County

Canva
- Age-adjusted rate of all strokes among adults, estimates for 2021: 2.6% (range between 2.3% and 2.9%)
- Death rate for ischemic strokes, 2018-20: 13.7 per 100K people
- Death rate for hemorrhagic strokes, 2018-20: 7.0 per 100K people
- Death rate for ischemic strokes, 2018-20: 13.7 per 100K people
- Death rate for hemorrhagic strokes, 2018-20: 7.0 per 100K people
#3. Hartford County

Canva
- Age-adjusted rate of all strokes among adults, estimates for 2021: 2.7% (range between 2.4% and 3.0%)
- Death rate for ischemic strokes, 2018-20: 13.3 per 100K people
- Death rate for hemorrhagic strokes, 2018-20: 6.8 per 100K people
- Death rate for ischemic strokes, 2018-20: 13.3 per 100K people
- Death rate for hemorrhagic strokes, 2018-20: 6.8 per 100K people
#2. New Haven County
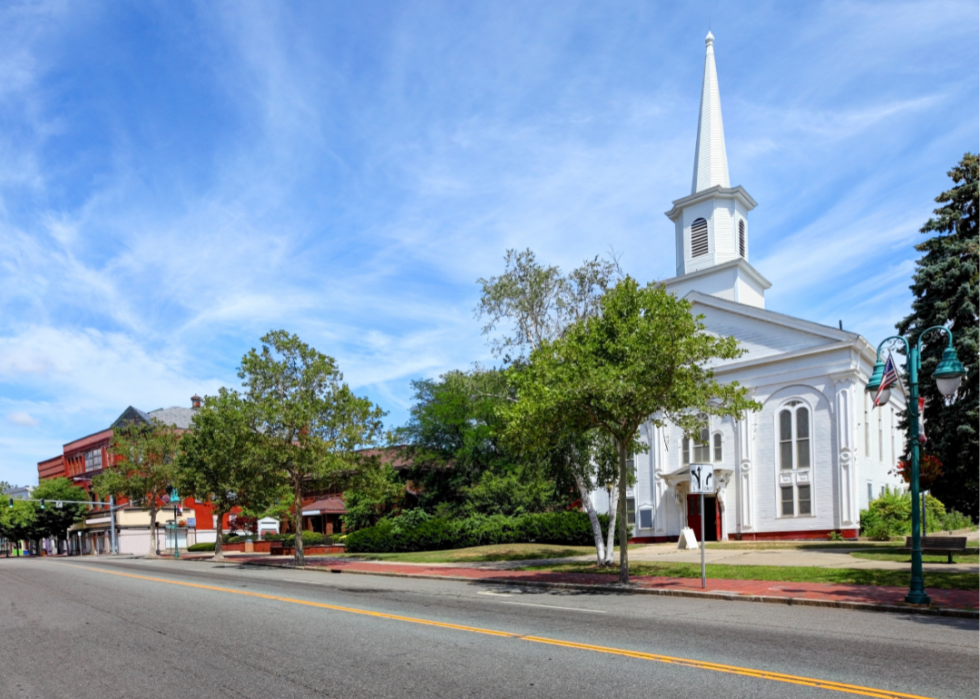
Canva
- Age-adjusted rate of all strokes among adults, estimates for 2021: 2.7% (range between 2.3% and 3.1%)
- Death rate for ischemic strokes, 2018-20: 15.9 per 100K people
- Death rate for hemorrhagic strokes, 2018-20: 7.2 per 100K people
- Death rate for ischemic strokes, 2018-20: 15.9 per 100K people
- Death rate for hemorrhagic strokes, 2018-20: 7.2 per 100K people
This story features data reporting and writing by Emma Rubin and is part of a series utilizing data automation across 49 states.
#1. Windham County

Canva