Counties with the most bridges in dire need of repair in Connecticut

- Bridges in poor condition: 3.9% (36 of 915 bridges)
- Square meters of bridges in poor condition: 3.7% (36,422 of 988,763 square meters of bridges)

- Bridges in poor condition: 4.4% (39 of 892 bridges)
- Square meters of bridges in poor condition: 9.0% (70,126 of 781,160 square meters of bridges)

- Bridges in poor condition: 4.9% (15 of 308 bridges)
- Square meters of bridges in poor condition: 13.0% (24,206 of 185,954 square meters of bridges)

- Bridges in poor condition: 5.1% (44 of 860 bridges)
- Square meters of bridges in poor condition: 4.9% (38,692 of 795,176 square meters of bridges)

- Bridges in poor condition: 5.5% (24 of 433 bridges)
- Square meters of bridges in poor condition: 17.6% (63,681 of 361,265 square meters of bridges)

- Bridges in poor condition: 6.3% (13 of 208 bridges)
- Square meters of bridges in poor condition: 1.4% (1,070 of 78,398 square meters of bridges)

- Bridges in poor condition: 7.2% (34 of 470 bridges)
- Square meters of bridges in poor condition: 5.3% (7,396 of 138,874 square meters of bridges)
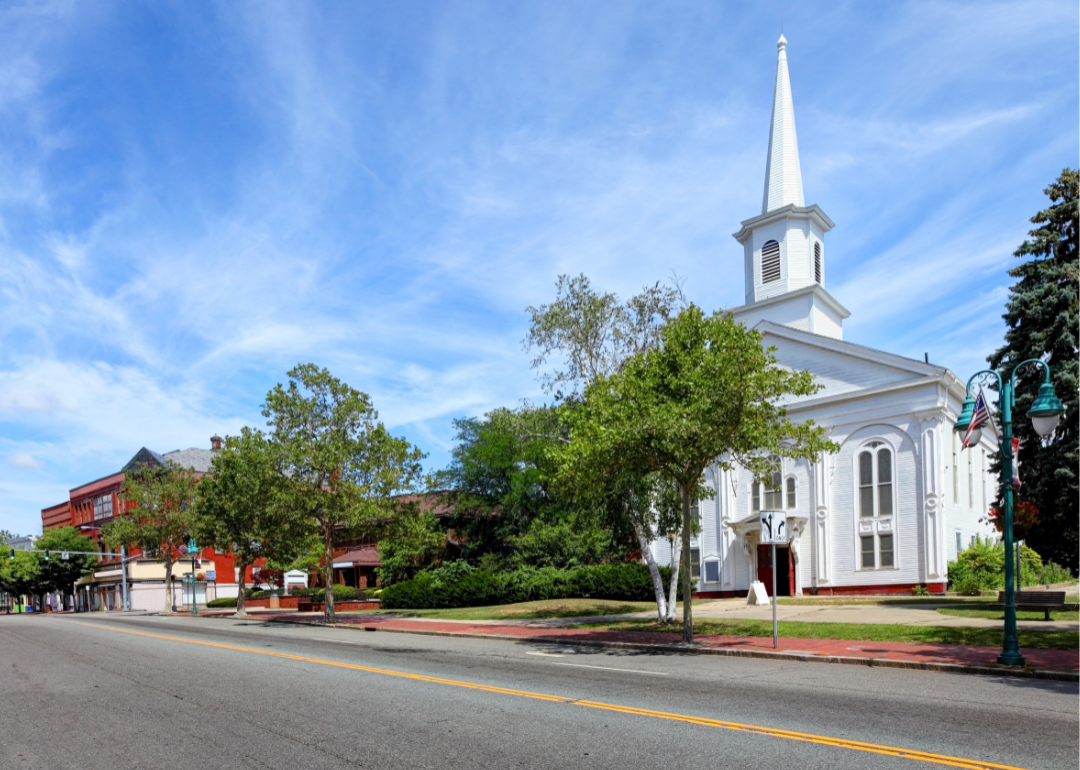
- Bridges in poor condition: 7.5% (20 of 267 bridges)
- Square meters of bridges in poor condition: 4.5% (4,178 of 93,552 square meters of bridges)
