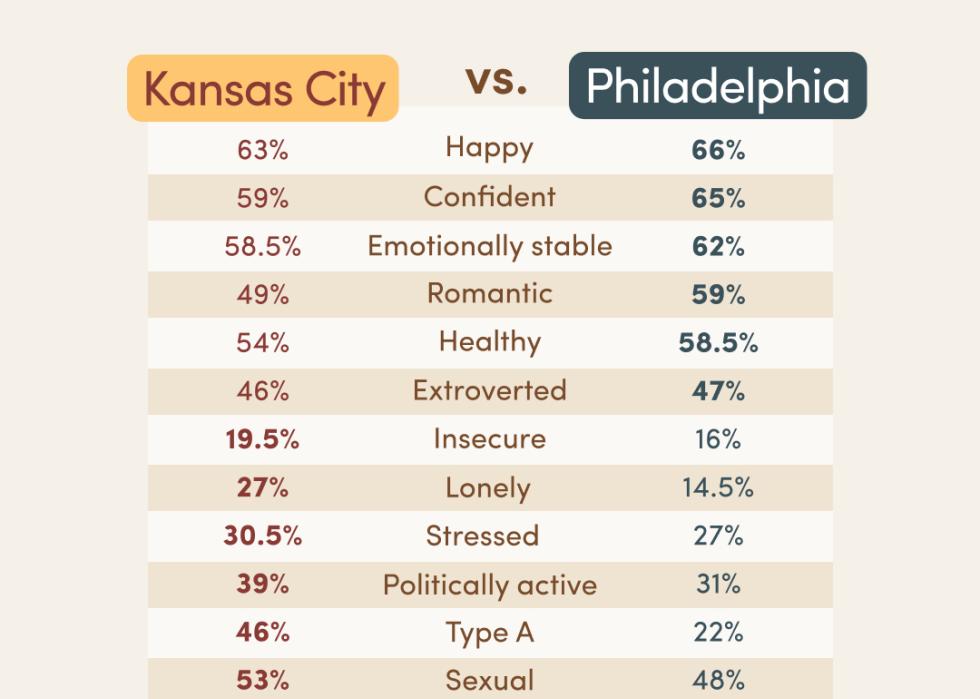
Eagles fans are happier, Chiefs fans are hotter according to new study
This study is based on a 7,100-person online survey, which included (1) 5,000 18-to-65-year-old respondents in the top 50 metropolitan areas (100 respondents per city); (2) 5,000 18-65-year-old respondents in each of the 50 states (100 respondents per state); and (3) a nationally representative sample of 500 18-to-65-year-old respondents to contextualize results. These three categories are not mutually exclusive; some respondents fall within more than one category. The study was fielded in January 2025. Data highlighted in this article is based on respondents in Philadelphia and Kansas City, specifically.
Findings were analyzed by 190 demographic and psychographic cuts, including city, region, gender (when referring to "women" and "men," all people who self-identify as such are included), age, race and ethnicity, relationship status, parenting status, sexual orientation (heterosexual, bisexual, gay, lesbian, pansexual, asexual, queer, etc.), fandoms (music, sports, etc.), and fitness and diet preferences, among other areas of interest.
Metropolitan populations were determined by 2022 Census data. In order to represent as many states as possible within the study, 5 cities that did not fall in the top 50 metropolitan locations were selected in place of cities in states already represented. Cities added to the study included New Orleans, LA (51); Providence, RI (53); Little Rock, AR (59); Honolulu, HI (68); and Omaha, NE (71). Cities replaced in the study included West Palm Beach, FL (39); Jacksonville, FL (41); Grand Rapids, MI (42); Harrisburg, PA (44); and Greensboro, NC (45).
Percentages for each attribute are based on respondents answering the following question with a 4 or a 5 on a 5-point scale: "On a scale of 1 to 5, where 1 is 'Not at all me' and 5 is 'Very much me,' how much do you feel each of the following describes you, personally?"
All data in this study are from this source, unless otherwise noted. Independent research firm, Culture Co-op, conducted and analyzed research and findings.