Counties with the most bridges in dire need of repair in Georgia
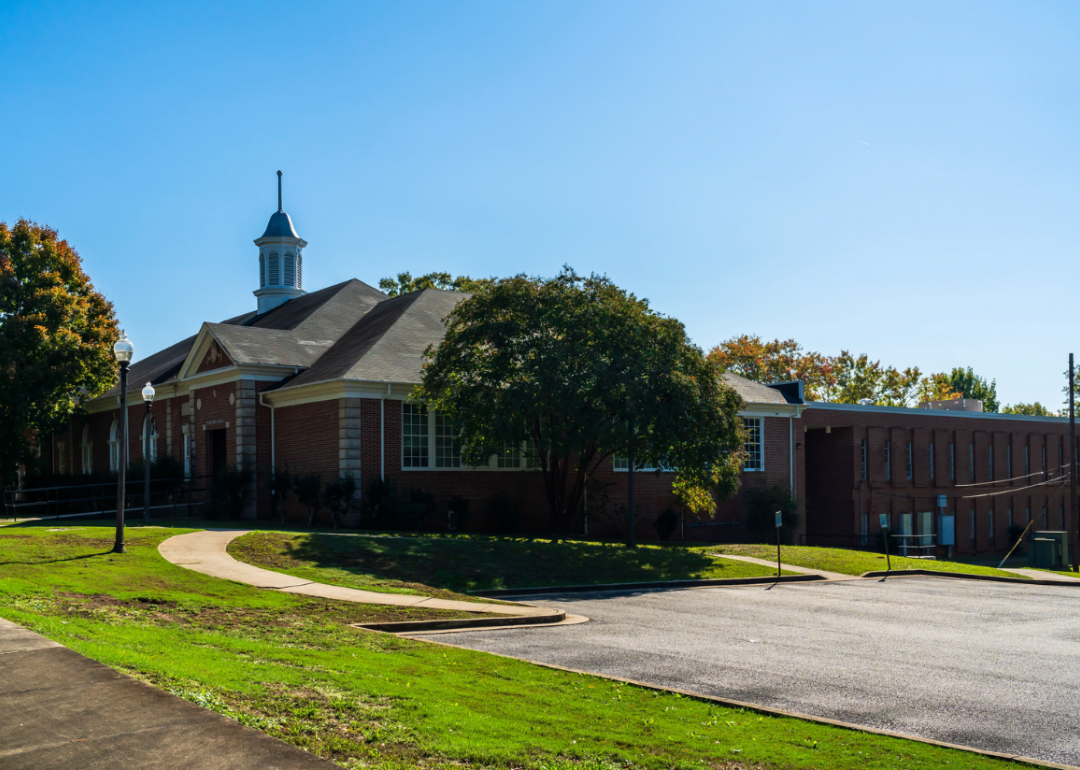
- Bridges in poor condition: 5.7% (5 of 87 bridges)
- Square meters of bridges in poor condition: 2.0% (716 of 36,077 square meters of bridges)

- Bridges in poor condition: 5.9% (4 of 68 bridges)
- Square meters of bridges in poor condition: 1.4% (163 of 11,486 square meters of bridges)
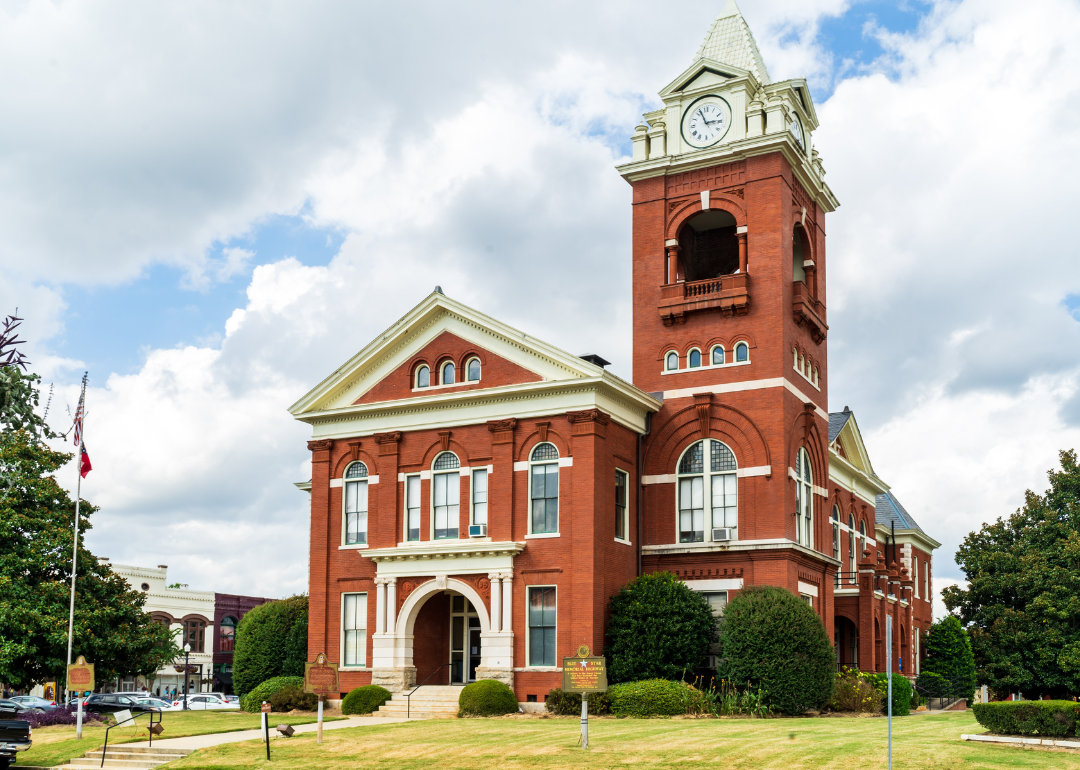
- Bridges in poor condition: 6.5% (3 of 46 bridges)
- Square meters of bridges in poor condition: 0.6% (165 of 27,025 square meters of bridges)
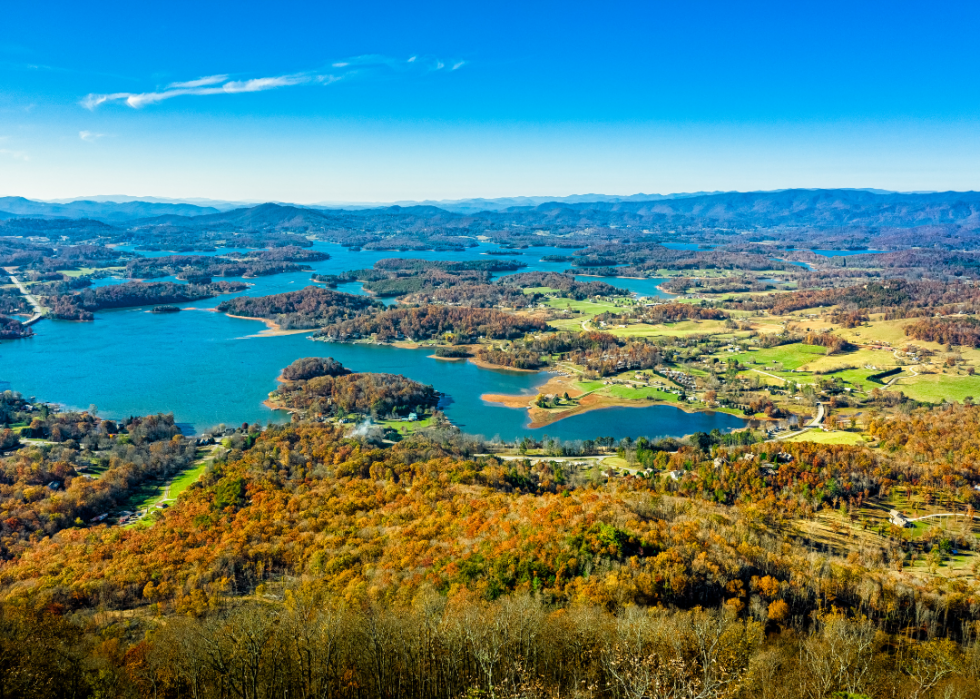
- Bridges in poor condition: 6.5% (3 of 46 bridges)
- Square meters of bridges in poor condition: 1.0% (157 of 15,758 square meters of bridges)
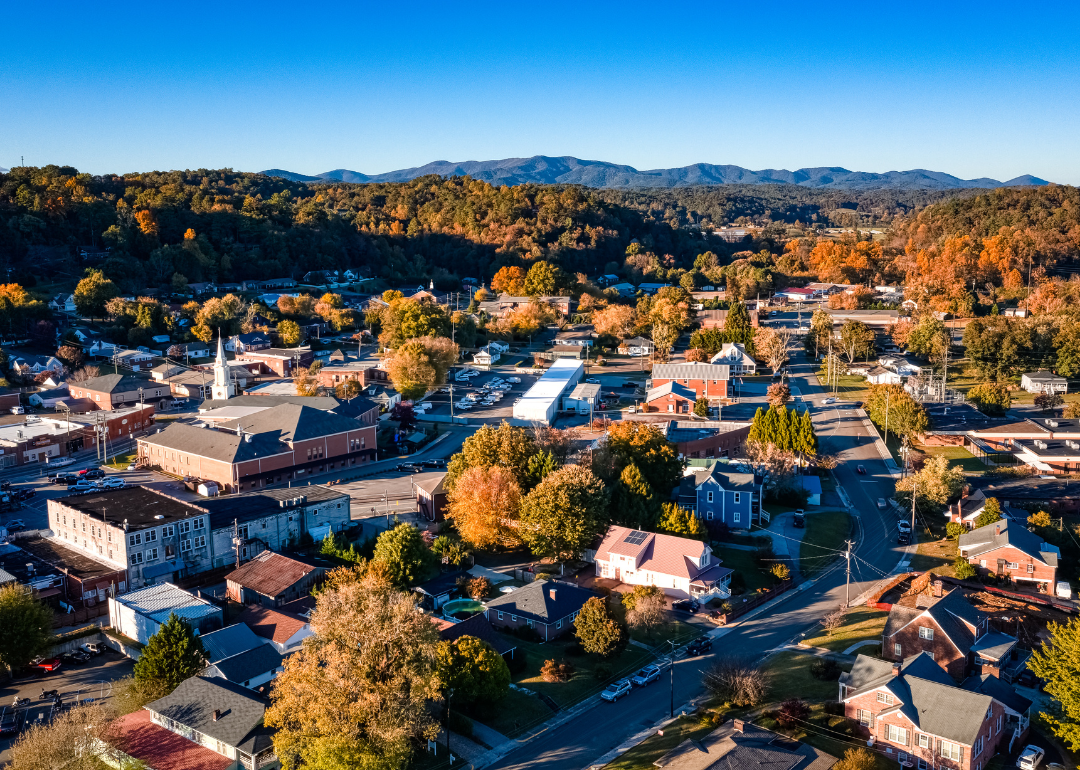
- Bridges in poor condition: 6.9% (7 of 101 bridges)
- Square meters of bridges in poor condition: 3.5% (1,137 of 32,689 square meters of bridges)

- Bridges in poor condition: 7.0% (5 of 71 bridges)
- Square meters of bridges in poor condition: 3.4% (1,807 of 53,503 square meters of bridges)
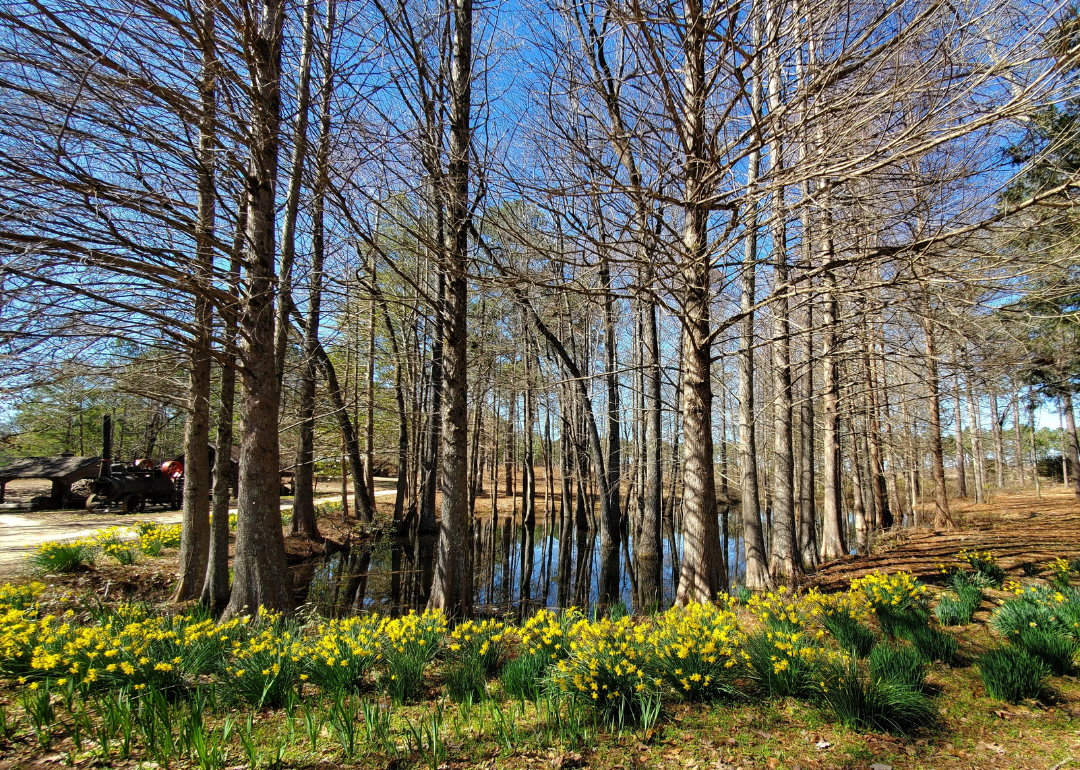
- Bridges in poor condition: 7.4% (5 of 68 bridges)
- Square meters of bridges in poor condition: 4.4% (832 of 18,869 square meters of bridges)

- Bridges in poor condition: 7.4% (5 of 68 bridges)
- Square meters of bridges in poor condition: 7.0% (1,062 of 15,139 square meters of bridges)

- Bridges in poor condition: 7.4% (2 of 27 bridges)
- Square meters of bridges in poor condition: 1.7% (448 of 26,774 square meters of bridges)
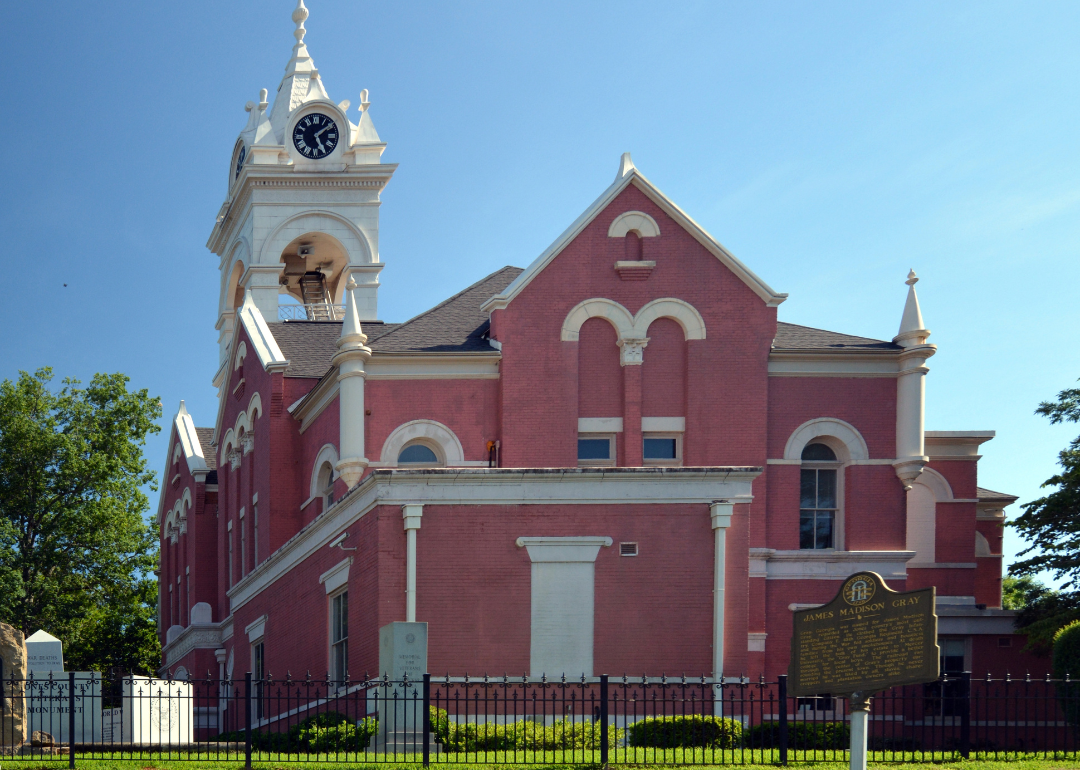
- Bridges in poor condition: 7.4% (4 of 54 bridges)
- Square meters of bridges in poor condition: 6.0% (899 of 14,875 square meters of bridges)
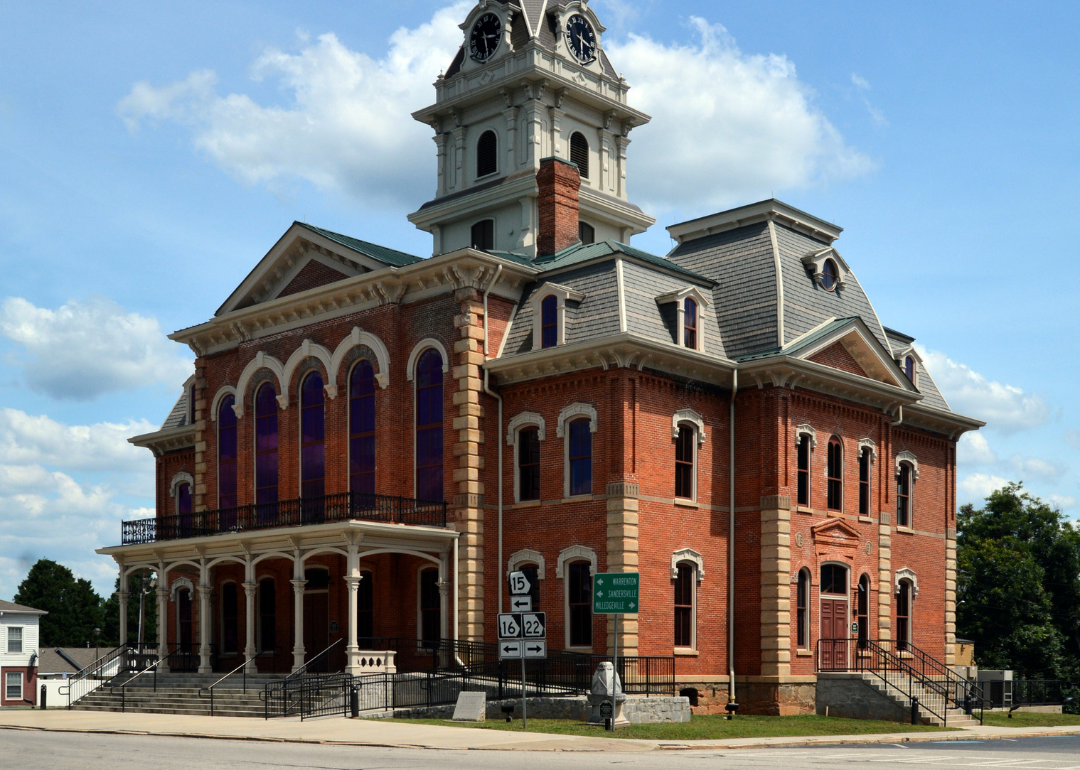
- Bridges in poor condition: 7.8% (5 of 64 bridges)
- Square meters of bridges in poor condition: 3.1% (484 of 15,629 square meters of bridges)
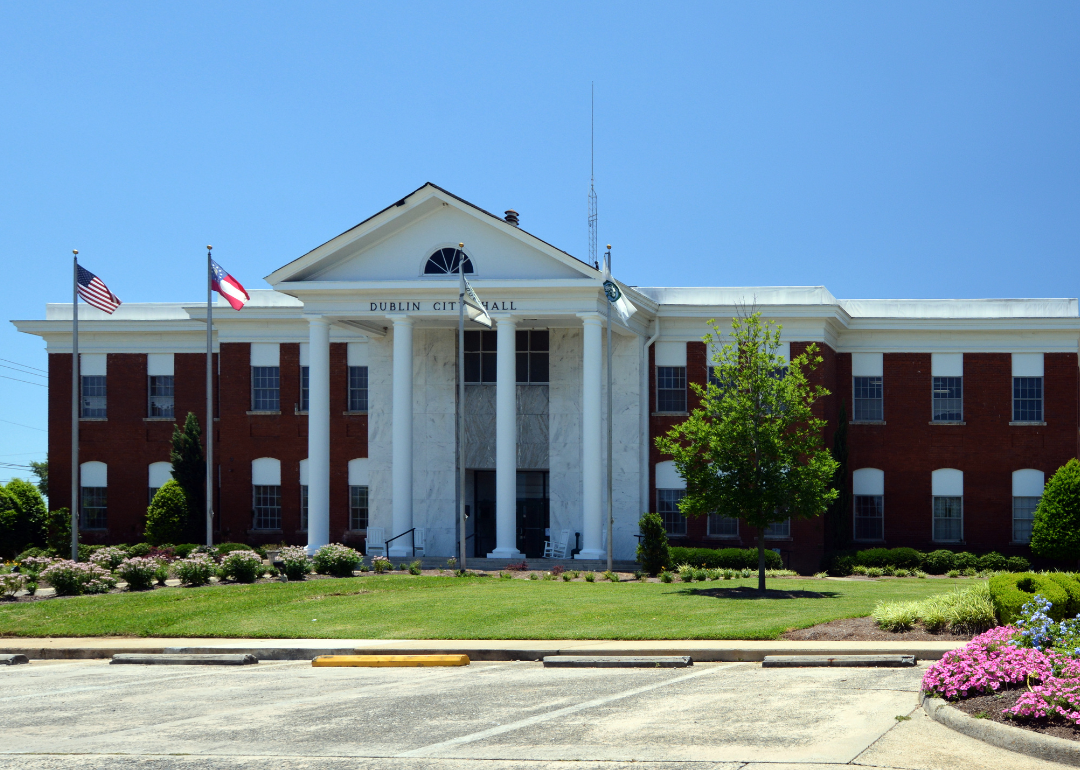
- Bridges in poor condition: 8.7% (15 of 173 bridges)
- Square meters of bridges in poor condition: 3.2% (3,129 of 97,699 square meters of bridges)
- Bridges in poor condition: 9.4% (6 of 64 bridges)
- Square meters of bridges in poor condition: 7.0% (1,703 of 24,302 square meters of bridges)
- Bridges in poor condition: 9.6% (5 of 52 bridges)
- Square meters of bridges in poor condition: 3.2% (555 of 17,177 square meters of bridges)
- Bridges in poor condition: 10.0% (2 of 20 bridges)
- Square meters of bridges in poor condition: 2.3% (204 of 8,805 square meters of bridges)
- Bridges in poor condition: 10.6% (12 of 113 bridges)
- Square meters of bridges in poor condition: 3.5% (1,223 of 34,693 square meters of bridges)
- Bridges in poor condition: 11.1% (8 of 72 bridges)
- Square meters of bridges in poor condition: 6.3% (3,509 of 55,595 square meters of bridges)
- Bridges in poor condition: 13.5% (18 of 133 bridges)
- Square meters of bridges in poor condition: 6.9% (3,363 of 49,056 square meters of bridges)
- Bridges in poor condition: 14.5% (12 of 83 bridges)
- Square meters of bridges in poor condition: 5.6% (1,838 of 32,564 square meters of bridges)
- Bridges in poor condition: 17.4% (8 of 46 bridges)
- Square meters of bridges in poor condition: 15.8% (1,896 of 11,996 square meters of bridges)
