Counties with the highest rates of strokes in Idaho
Charles Knowles // Shutterstock
- Age-adjusted rate of all strokes among adults, estimates for 2021: 2.4% (range between 2.1% and 2.7%)
- Death rate for ischemic strokes, 2018-20: 14.2 per 100K people
- Death rate for hemorrhagic strokes, 2018-20: 6.7 per 100K people
- Death rate for ischemic strokes, 2018-20: 14.2 per 100K people
- Death rate for hemorrhagic strokes, 2018-20: 6.7 per 100K people
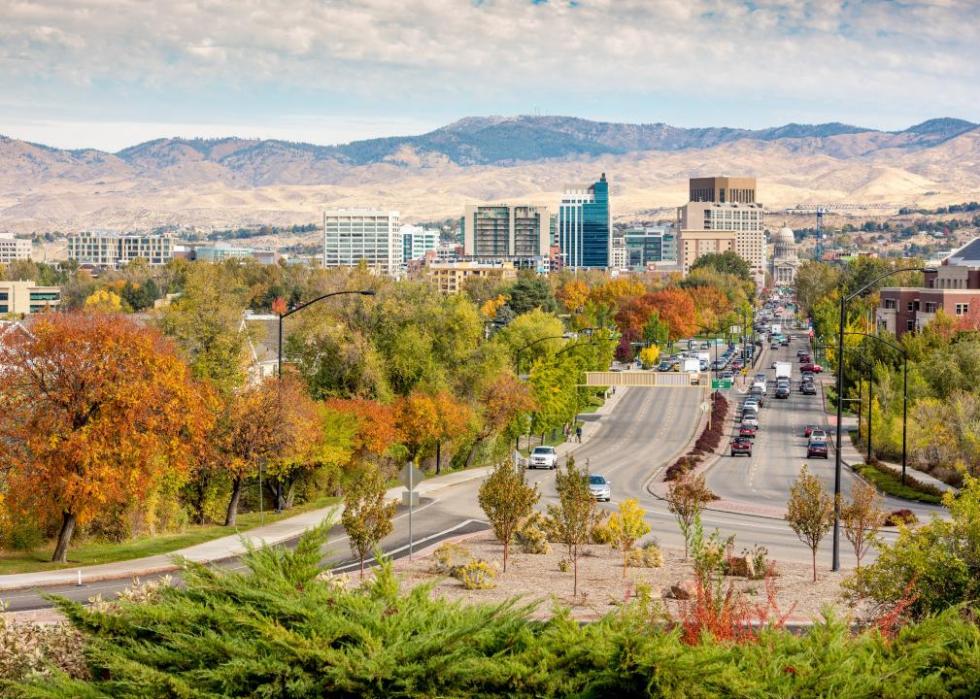
#44. Ada County

Canva
- Age-adjusted rate of all strokes among adults, estimates for 2021: 2.5% (range between 2.1% and 2.8%)
- Death rate for ischemic strokes, 2018-20: 15.8 per 100K people
- Death rate for hemorrhagic strokes, 2018-20: 8.7 per 100K people
- Death rate for ischemic strokes, 2018-20: 15.8 per 100K people
- Death rate for hemorrhagic strokes, 2018-20: 8.7 per 100K people
#43. Blaine County
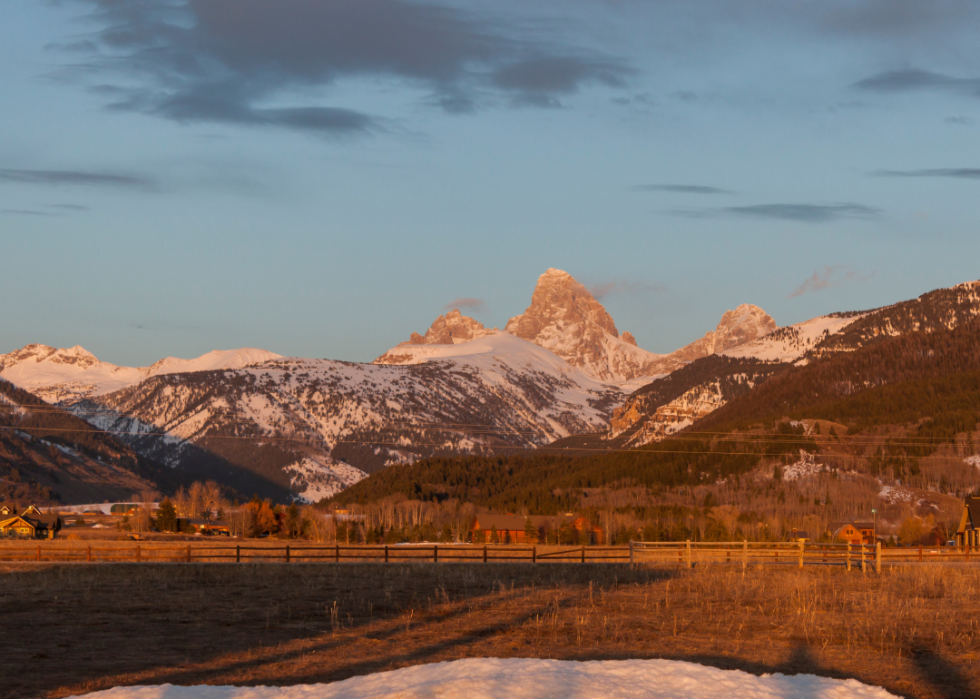
Canva
- Age-adjusted rate of all strokes among adults, estimates for 2021: 2.5% (range between 2.1% and 2.8%)
- Death rate for ischemic strokes, 2018-20: 21.7 per 100K people
- Death rate for hemorrhagic strokes, 2018-20: 6.5 per 100K people
- Death rate for ischemic strokes, 2018-20: 21.7 per 100K people
- Death rate for hemorrhagic strokes, 2018-20: 6.5 per 100K people
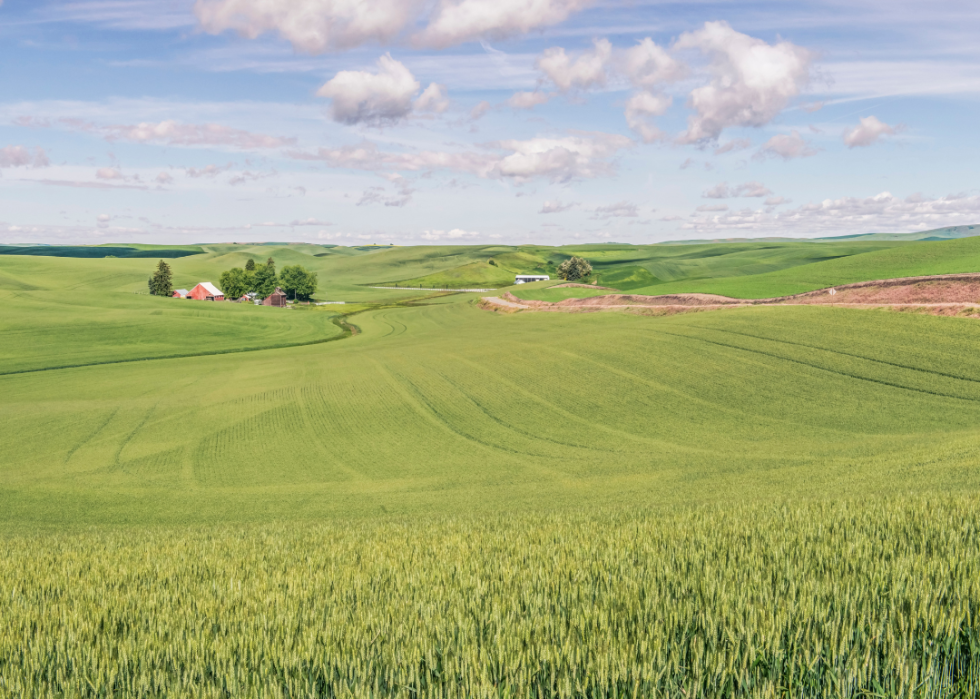
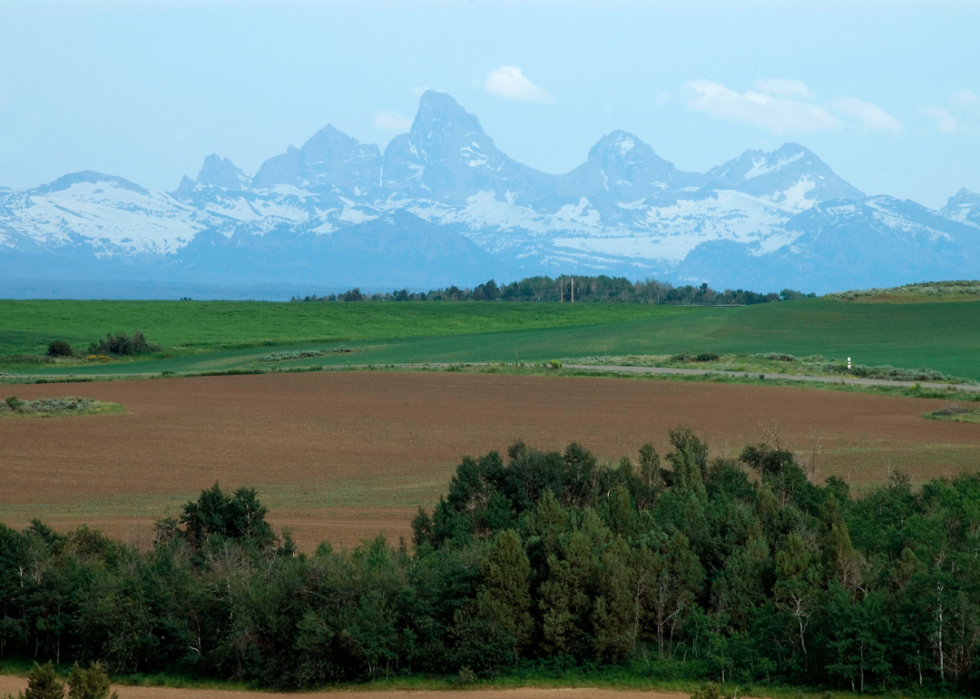
#42. Teton County

Canva
- Age-adjusted rate of all strokes among adults, estimates for 2021: 2.6% (range between 2.3% and 3.0%)
- Death rate for ischemic strokes, 2018-20: 13.4 per 100K people
- Death rate for hemorrhagic strokes, 2018-20: 6.6 per 100K people
- Death rate for ischemic strokes, 2018-20: 13.4 per 100K people
- Death rate for hemorrhagic strokes, 2018-20: 6.6 per 100K people
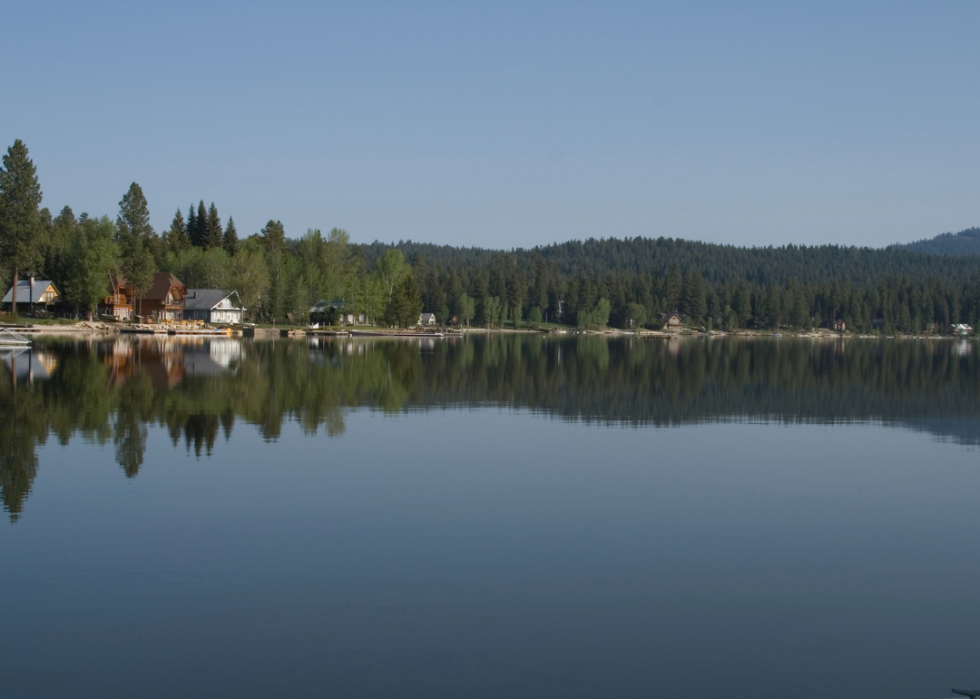
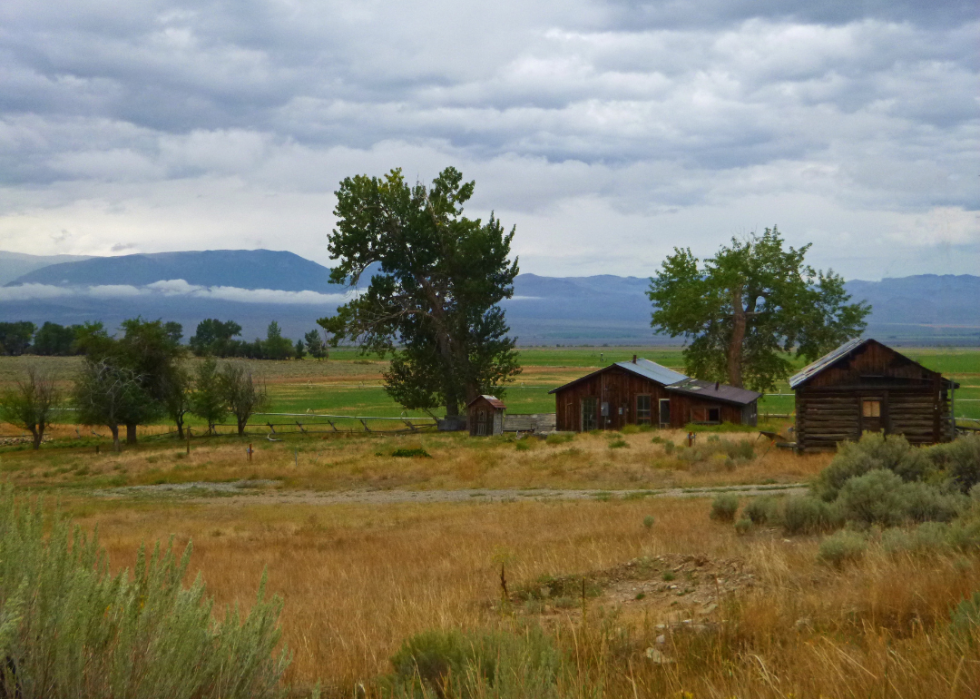
#41. Boise County
Danita Delimont // Shutterstock
- Age-adjusted rate of all strokes among adults, estimates for 2021: 2.6% (range between 2.3% and 3.0%)
- Death rate for ischemic strokes, 2018-20: 20.6 per 100K people
- Death rate for hemorrhagic strokes, 2018-20: 7.6 per 100K people
- Death rate for ischemic strokes, 2018-20: 20.6 per 100K people
- Death rate for hemorrhagic strokes, 2018-20: 7.6 per 100K people
You may also like: Least educated counties in Idaho
#40. Latah County

Canva
- Age-adjusted rate of all strokes among adults, estimates for 2021: 2.6% (range between 2.3% and 3.0%)
- Death rate for ischemic strokes, 2018-20: 21.5 per 100K people
- Death rate for hemorrhagic strokes, 2018-20: 8.9 per 100K people
- Death rate for ischemic strokes, 2018-20: 21.5 per 100K people
- Death rate for hemorrhagic strokes, 2018-20: 8.9 per 100K people
#39. Bonneville County
Canva
- Age-adjusted rate of all strokes among adults, estimates for 2021: 2.7% (range between 2.4% and 3.1%)
- Death rate for ischemic strokes, 2018-20: 12.4 per 100K people
- Death rate for hemorrhagic strokes, 2018-20: 4.0 per 100K people
- Death rate for ischemic strokes, 2018-20: 12.4 per 100K people
- Death rate for hemorrhagic strokes, 2018-20: 4.0 per 100K people
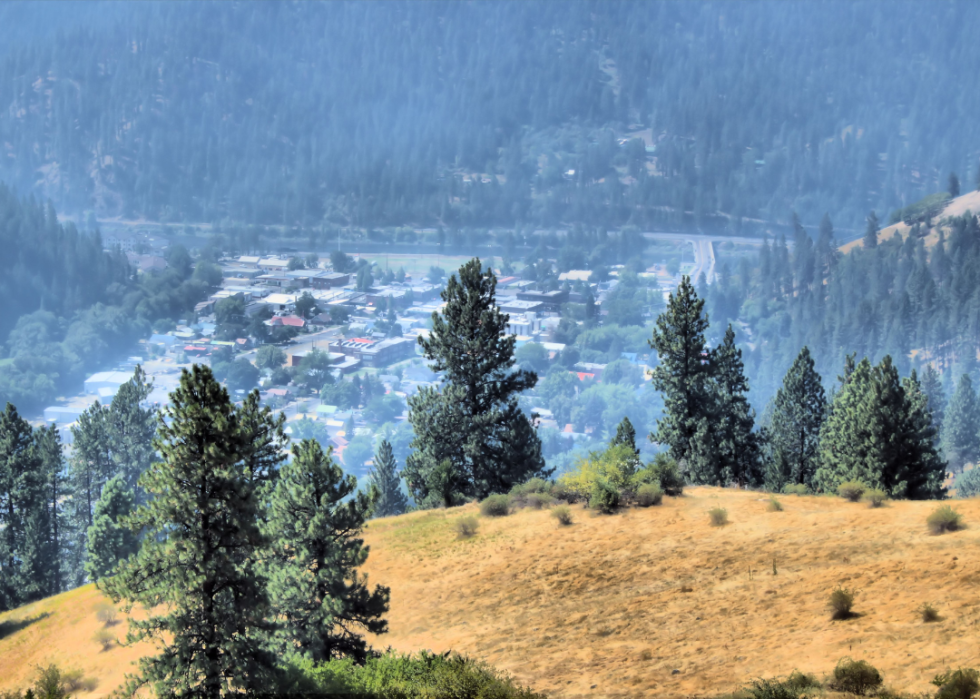
#38. Valley County
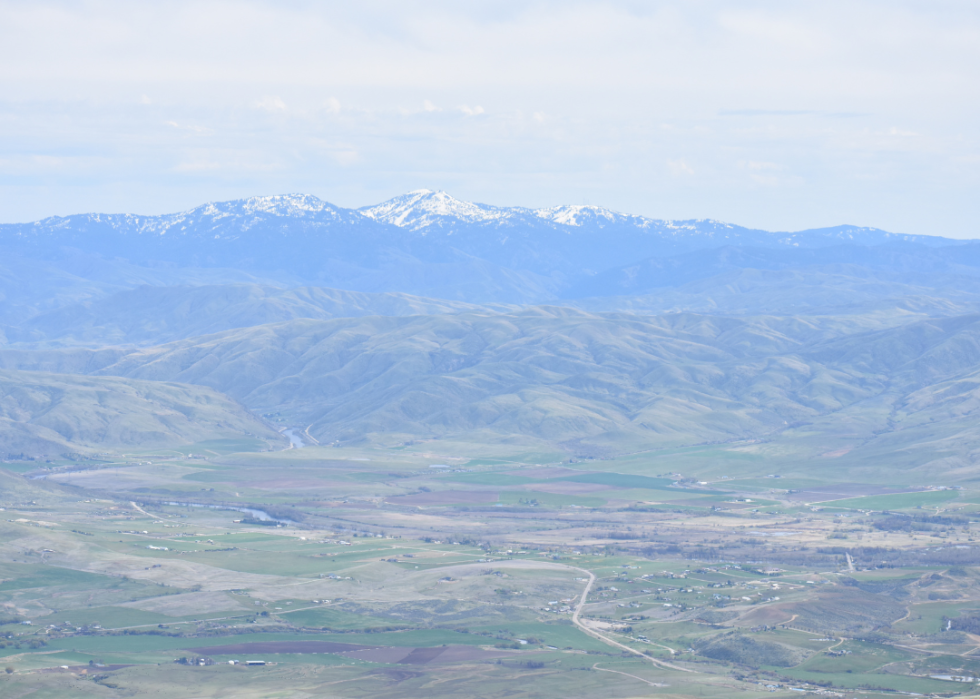
MKStyle // Shutterstock
- Age-adjusted rate of all strokes among adults, estimates for 2021: 2.7% (range between 2.4% and 3.1%)
- Death rate for ischemic strokes, 2018-20: 15.4 per 100K people
- Death rate for hemorrhagic strokes, 2018-20: 6.6 per 100K people
- Death rate for ischemic strokes, 2018-20: 15.4 per 100K people
- Death rate for hemorrhagic strokes, 2018-20: 6.6 per 100K people
#37. Gem County
Canva
- Age-adjusted rate of all strokes among adults, estimates for 2021: 2.7% (range between 2.4% and 3.1%)
- Death rate for ischemic strokes, 2018-20: 19.9 per 100K people
- Death rate for hemorrhagic strokes, 2018-20: 6.5 per 100K people
- Death rate for ischemic strokes, 2018-20: 19.9 per 100K people
- Death rate for hemorrhagic strokes, 2018-20: 6.5 per 100K people
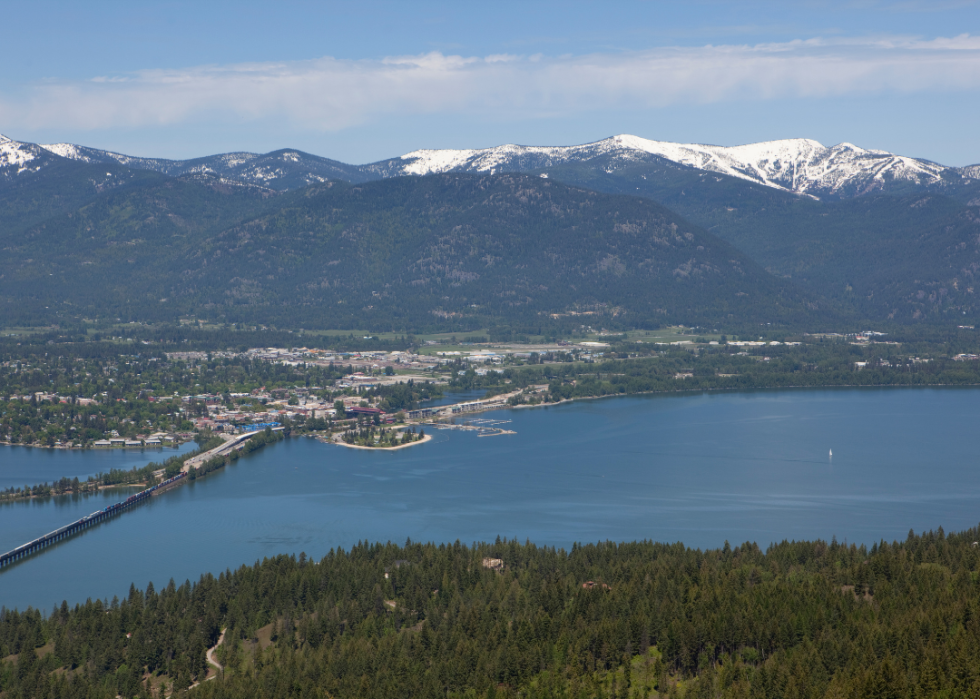
#36. Bonner County
Canva
- Age-adjusted rate of all strokes among adults, estimates for 2021: 2.7% (range between 2.3% and 3.0%)
- Death rate for ischemic strokes, 2018-20: 20.0 per 100K people
- Death rate for hemorrhagic strokes, 2018-20: 6.3 per 100K people
- Death rate for ischemic strokes, 2018-20: 20.0 per 100K people
- Death rate for hemorrhagic strokes, 2018-20: 6.3 per 100K people
You may also like: Best places to live in Idaho
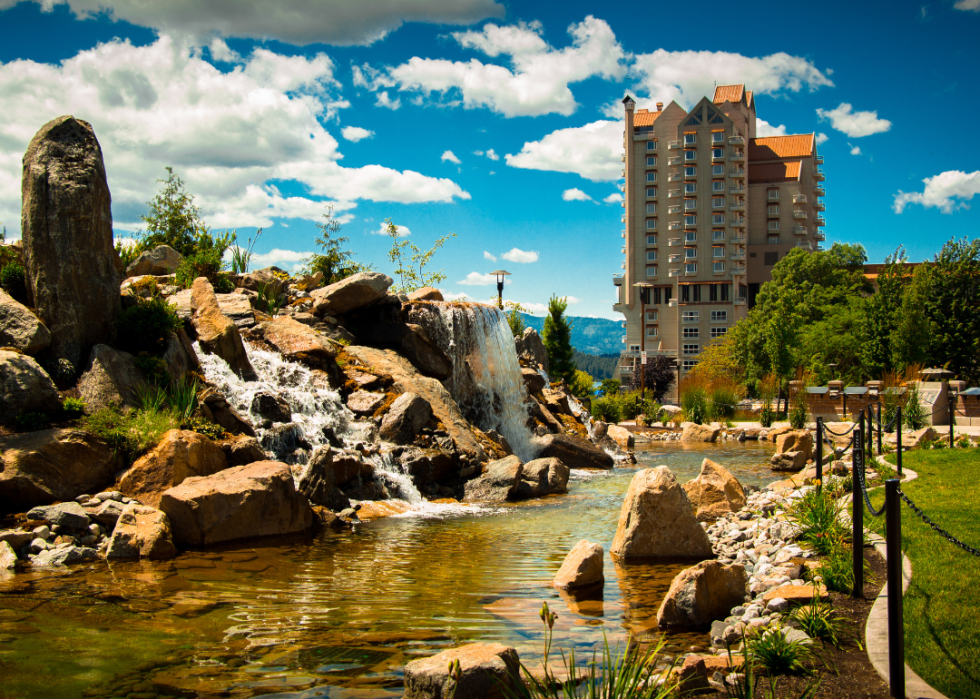
#35. Kootenai County
Canva
- Age-adjusted rate of all strokes among adults, estimates for 2021: 2.7% (range between 2.3% and 3.0%)
- Death rate for ischemic strokes, 2018-20: 20.7 per 100K people
- Death rate for hemorrhagic strokes, 2018-20: 9.1 per 100K people
- Death rate for ischemic strokes, 2018-20: 20.7 per 100K people
- Death rate for hemorrhagic strokes, 2018-20: 9.1 per 100K people
#34. Caribou County
Canva
- Age-adjusted rate of all strokes among adults, estimates for 2021: 2.7% (range between 2.3% and 3.1%)
- Death rate for ischemic strokes, 2018-20: 21.1 per 100K people
- Death rate for hemorrhagic strokes, 2018-20: 7.5 per 100K people
- Death rate for ischemic strokes, 2018-20: 21.1 per 100K people
- Death rate for hemorrhagic strokes, 2018-20: 7.5 per 100K people
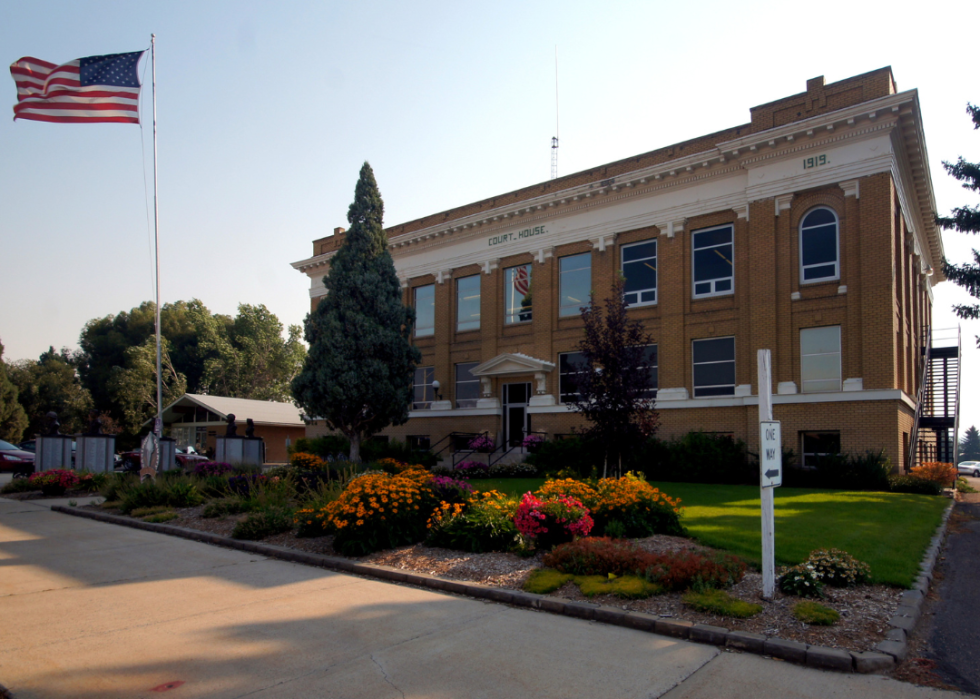
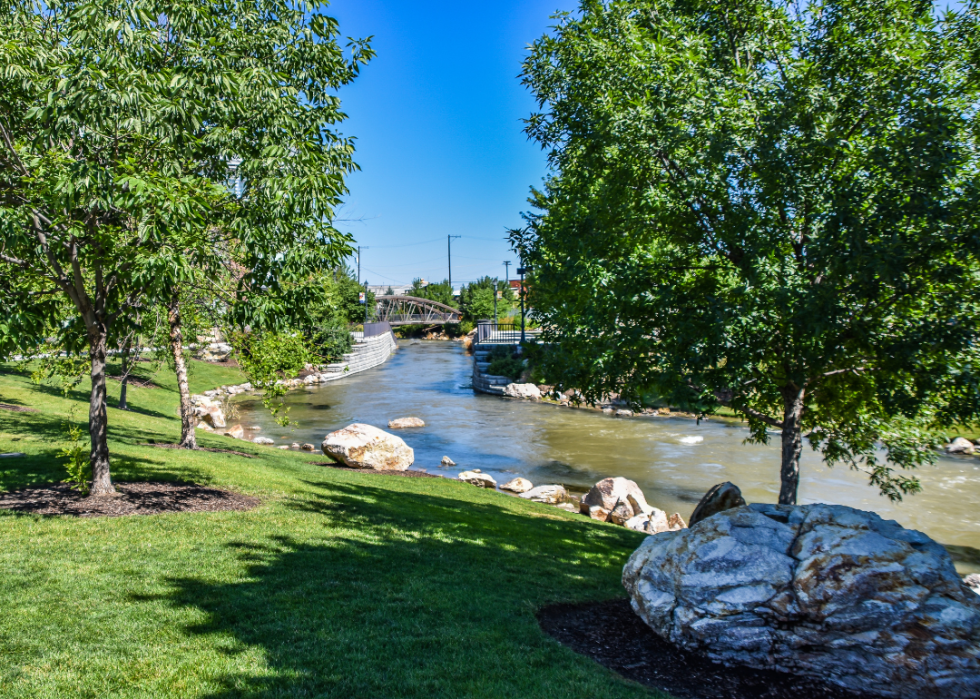
#33. Oneida County
B Brown // Shutterstock
- Age-adjusted rate of all strokes among adults, estimates for 2021: 2.7% (range between 2.4% and 3.0%)
- Death rate for ischemic strokes, 2018-20: 23.2 per 100K people
- Death rate for hemorrhagic strokes, 2018-20: 6.9 per 100K people
- Death rate for ischemic strokes, 2018-20: 23.2 per 100K people
- Death rate for hemorrhagic strokes, 2018-20: 6.9 per 100K people
#32. Jefferson County
Canva
- Age-adjusted rate of all strokes among adults, estimates for 2021: 2.8% (range between 2.5% and 3.2%)
- Death rate for ischemic strokes, 2018-20: 19.2 per 100K people
- Death rate for hemorrhagic strokes, 2018-20: 6.2 per 100K people
- Death rate for ischemic strokes, 2018-20: 19.2 per 100K people
- Death rate for hemorrhagic strokes, 2018-20: 6.2 per 100K people
#31. Bear Lake County

Canva
- Age-adjusted rate of all strokes among adults, estimates for 2021: 2.8% (range between 2.5% and 3.2%)
- Death rate for ischemic strokes, 2018-20: 19.8 per 100K people
- Death rate for hemorrhagic strokes, 2018-20: 6.8 per 100K people
- Death rate for ischemic strokes, 2018-20: 19.8 per 100K people
- Death rate for hemorrhagic strokes, 2018-20: 6.8 per 100K people
You may also like: Counties with the worst commutes in Idaho
#30. Nez Perce County
Canva
- Age-adjusted rate of all strokes among adults, estimates for 2021: 2.8% (range between 2.4% and 3.2%)
- Death rate for ischemic strokes, 2018-20: 21.5 per 100K people
- Death rate for hemorrhagic strokes, 2018-20: 8.7 per 100K people
- Death rate for ischemic strokes, 2018-20: 21.5 per 100K people
- Death rate for hemorrhagic strokes, 2018-20: 8.7 per 100K people
#29. Bannock County
Canva
- Age-adjusted rate of all strokes among adults, estimates for 2021: 2.8% (range between 2.4% and 3.1%)
- Death rate for ischemic strokes, 2018-20: 26.0 per 100K people
- Death rate for hemorrhagic strokes, 2018-20: 4.7 per 100K people
- Death rate for ischemic strokes, 2018-20: 26.0 per 100K people
- Death rate for hemorrhagic strokes, 2018-20: 4.7 per 100K people
#28. Fremont County
Canva
- Age-adjusted rate of all strokes among adults, estimates for 2021: 2.9% (range between 2.5% and 3.3%)
- Death rate for ischemic strokes, 2018-20: 14.9 per 100K people
- Death rate for hemorrhagic strokes, 2018-20: 7.4 per 100K people
- Death rate for ischemic strokes, 2018-20: 14.9 per 100K people
- Death rate for hemorrhagic strokes, 2018-20: 7.4 per 100K people
#27. Lemhi County

Canva
- Age-adjusted rate of all strokes among adults, estimates for 2021: 2.9% (range between 2.5% and 3.3%)
- Death rate for ischemic strokes, 2018-20: 15.3 per 100K people
- Death rate for hemorrhagic strokes, 2018-20: 3.6 per 100K people
- Death rate for ischemic strokes, 2018-20: 15.3 per 100K people
- Death rate for hemorrhagic strokes, 2018-20: 3.6 per 100K people
#26. Adams County
Canva
- Age-adjusted rate of all strokes among adults, estimates for 2021: 2.9% (range between 2.5% and 3.2%)
- Death rate for ischemic strokes, 2018-20: 16.4 per 100K people
- Death rate for hemorrhagic strokes, 2018-20: 7.0 per 100K people
- Death rate for ischemic strokes, 2018-20: 16.4 per 100K people
- Death rate for hemorrhagic strokes, 2018-20: 7.0 per 100K people
You may also like: See how Idaho will be affected if Roe v. Wade is overturned
#25. Clearwater County
Canva
- Age-adjusted rate of all strokes among adults, estimates for 2021: 2.9% (range between 2.5% and 3.3%)
- Death rate for ischemic strokes, 2018-20: 16.5 per 100K people
- Death rate for hemorrhagic strokes, 2018-20: 6.7 per 100K people
- Death rate for ischemic strokes, 2018-20: 16.5 per 100K people
- Death rate for hemorrhagic strokes, 2018-20: 6.7 per 100K people
#24. Canyon County
Canva
- Age-adjusted rate of all strokes among adults, estimates for 2021: 2.9% (range between 2.5% and 3.3%)
- Death rate for ischemic strokes, 2018-20: 17.0 per 100K people
- Death rate for hemorrhagic strokes, 2018-20: 6.6 per 100K people
- Death rate for ischemic strokes, 2018-20: 17.0 per 100K people
- Death rate for hemorrhagic strokes, 2018-20: 6.6 per 100K people
#23. Payette County

Canva
- Age-adjusted rate of all strokes among adults, estimates for 2021: 2.9% (range between 2.5% and 3.3%)
- Death rate for ischemic strokes, 2018-20: 19.6 per 100K people
- Death rate for hemorrhagic strokes, 2018-20: 8.3 per 100K people
- Death rate for ischemic strokes, 2018-20: 19.6 per 100K people
- Death rate for hemorrhagic strokes, 2018-20: 8.3 per 100K people
#22. Twin Falls County
Canva
- Age-adjusted rate of all strokes among adults, estimates for 2021: 2.9% (range between 2.5% and 3.2%)
- Death rate for ischemic strokes, 2018-20: 20.2 per 100K people
- Death rate for hemorrhagic strokes, 2018-20: 6.6 per 100K people
- Death rate for ischemic strokes, 2018-20: 20.2 per 100K people
- Death rate for hemorrhagic strokes, 2018-20: 6.6 per 100K people
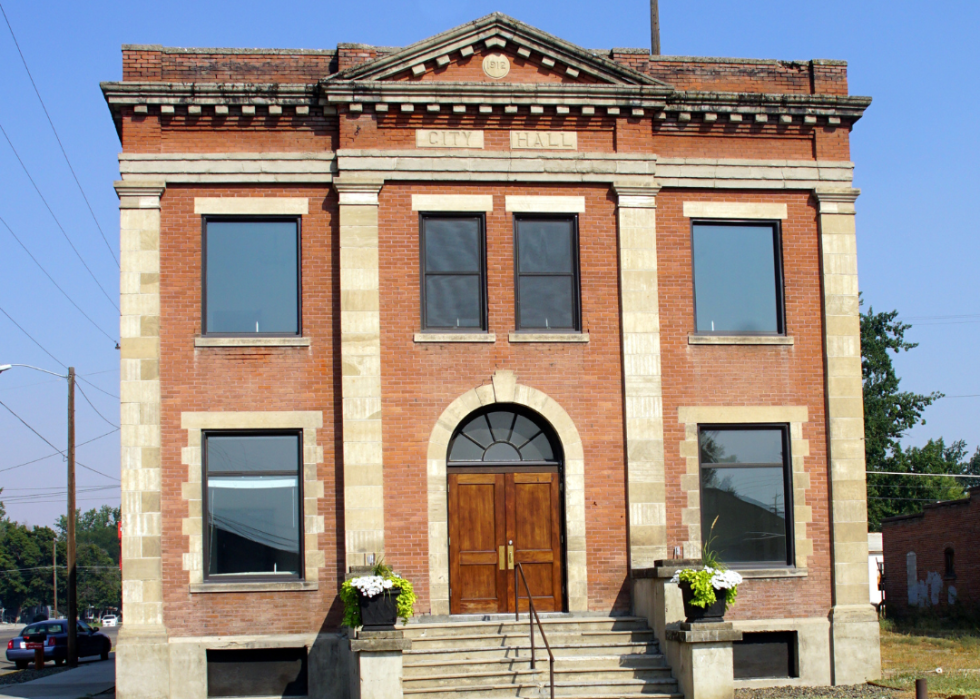
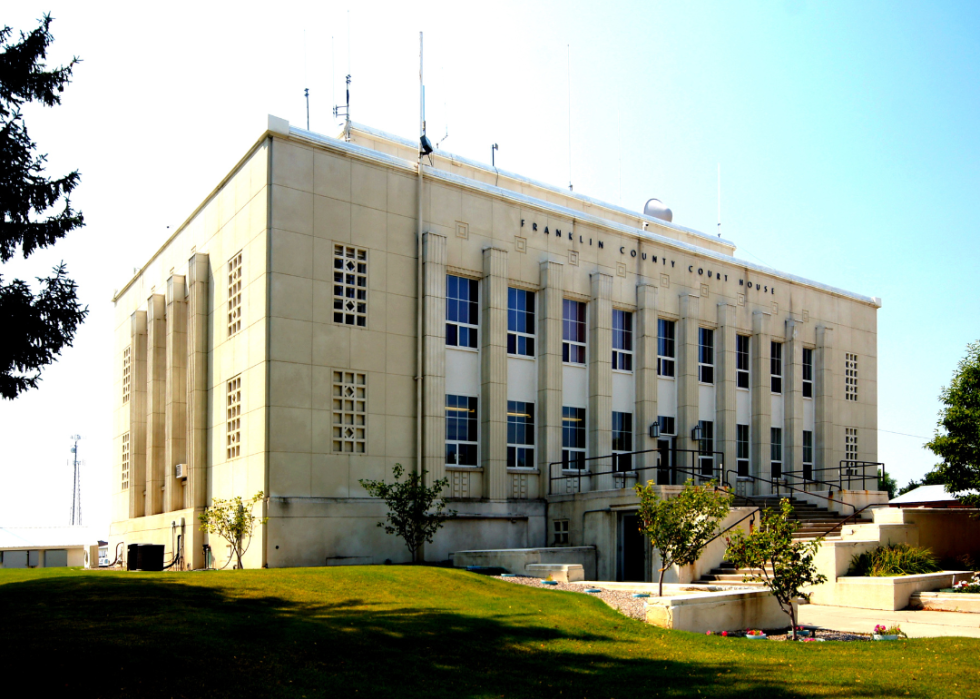
#21. Franklin County

Canva
- Age-adjusted rate of all strokes among adults, estimates for 2021: 3.0% (range between 2.6% and 3.4%)
- Death rate for ischemic strokes, 2018-20: 15.5 per 100K people
- Death rate for hemorrhagic strokes, 2018-20: 6.8 per 100K people
- Death rate for ischemic strokes, 2018-20: 15.5 per 100K people
- Death rate for hemorrhagic strokes, 2018-20: 6.8 per 100K people
You may also like: Countries Idaho imports the most goods from
#20. Idaho County
Canva
- Age-adjusted rate of all strokes among adults, estimates for 2021: 3.0% (range between 2.5% and 3.4%)
- Death rate for ischemic strokes, 2018-20: 16.7 per 100K people
- Death rate for hemorrhagic strokes, 2018-20: 7.9 per 100K people
- Death rate for ischemic strokes, 2018-20: 16.7 per 100K people
- Death rate for hemorrhagic strokes, 2018-20: 7.9 per 100K people
#19. Custer County
Canva
- Age-adjusted rate of all strokes among adults, estimates for 2021: 3.0% (range between 2.6% and 3.4%)
- Death rate for ischemic strokes, 2018-20: 20.4 per 100K people
- Death rate for hemorrhagic strokes, 2018-20: 9.0 per 100K people
- Death rate for ischemic strokes, 2018-20: 20.4 per 100K people
- Death rate for hemorrhagic strokes, 2018-20: 9.0 per 100K people
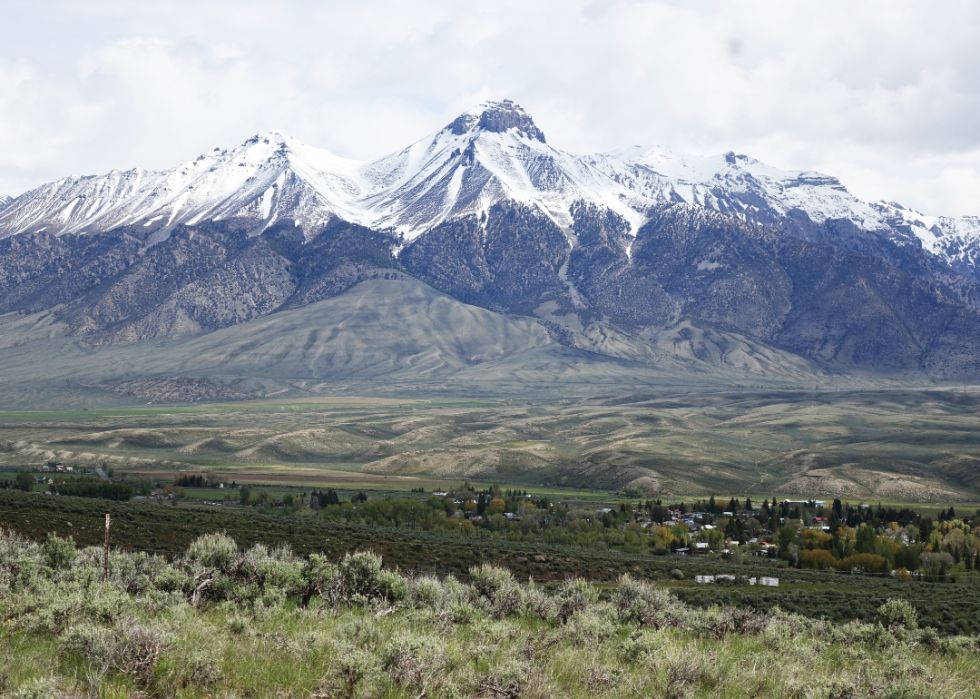
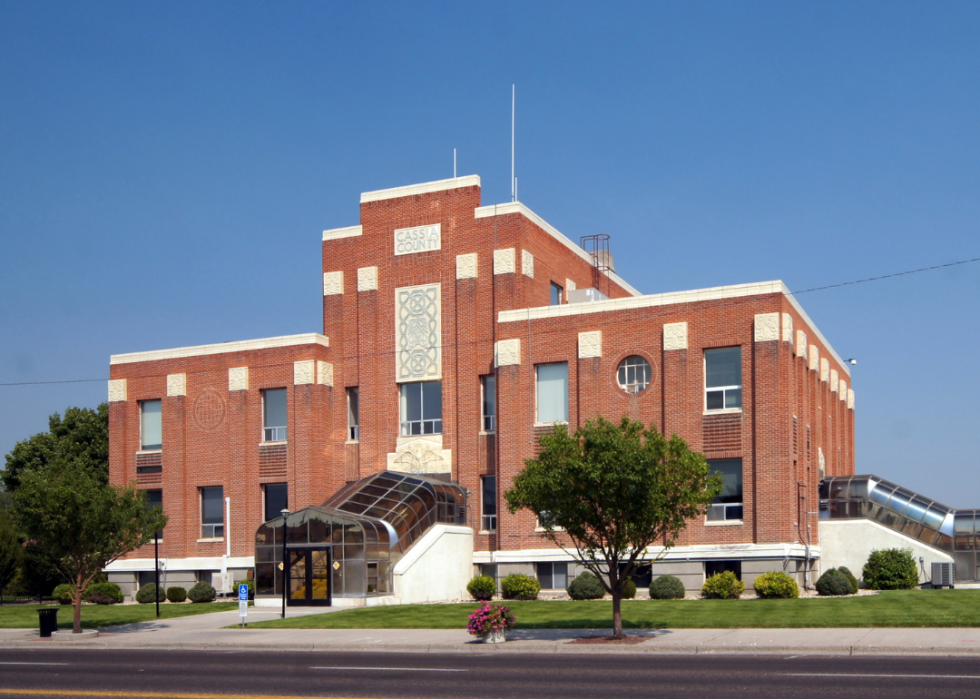
#18. Cassia County
Tucker James // Shutterstock
- Age-adjusted rate of all strokes among adults, estimates for 2021: 3.0% (range between 2.7% and 3.4%)
- Death rate for ischemic strokes, 2018-20: 20.5 per 100K people
- Death rate for hemorrhagic strokes, 2018-20: 8.4 per 100K people
- Death rate for ischemic strokes, 2018-20: 20.5 per 100K people
- Death rate for hemorrhagic strokes, 2018-20: 8.4 per 100K people
#17. Bingham County
Canva
- Age-adjusted rate of all strokes among adults, estimates for 2021: 3.0% (range between 2.6% and 3.3%)
- Death rate for ischemic strokes, 2018-20: 22.5 per 100K people
- Death rate for hemorrhagic strokes, 2018-20: 6.1 per 100K people
- Death rate for ischemic strokes, 2018-20: 22.5 per 100K people
- Death rate for hemorrhagic strokes, 2018-20: 6.1 per 100K people
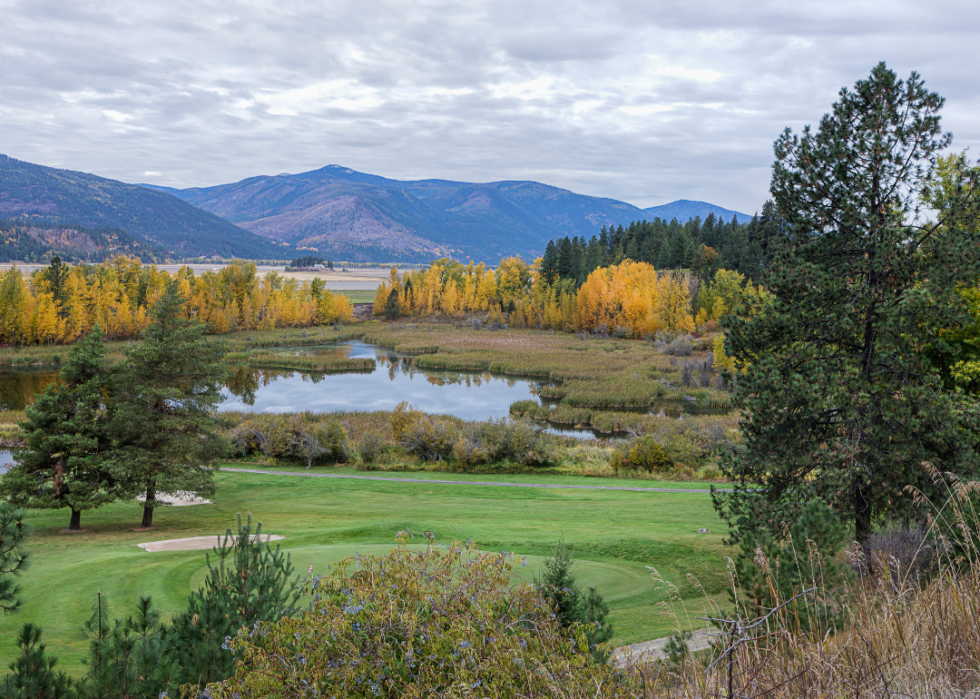
#16. Boundary County

Canva
- Age-adjusted rate of all strokes among adults, estimates for 2021: 3.1% (range between 2.6% and 3.5%)
- Death rate for ischemic strokes, 2018-20: 13.9 per 100K people
- Death rate for hemorrhagic strokes, 2018-20: 8.2 per 100K people
- Death rate for ischemic strokes, 2018-20: 13.9 per 100K people
- Death rate for hemorrhagic strokes, 2018-20: 8.2 per 100K people
You may also like: Highest-rated specialty museums in Idaho, according to Tripadvisor
#15. Camas County
Canva
- Age-adjusted rate of all strokes among adults, estimates for 2021: 3.1% (range between 2.8% and 3.5%)
- Death rate for ischemic strokes, 2018-20: 15.7 per 100K people
- Death rate for hemorrhagic strokes, 2018-20: 7.2 per 100K people
- Death rate for ischemic strokes, 2018-20: 15.7 per 100K people
- Death rate for hemorrhagic strokes, 2018-20: 7.2 per 100K people
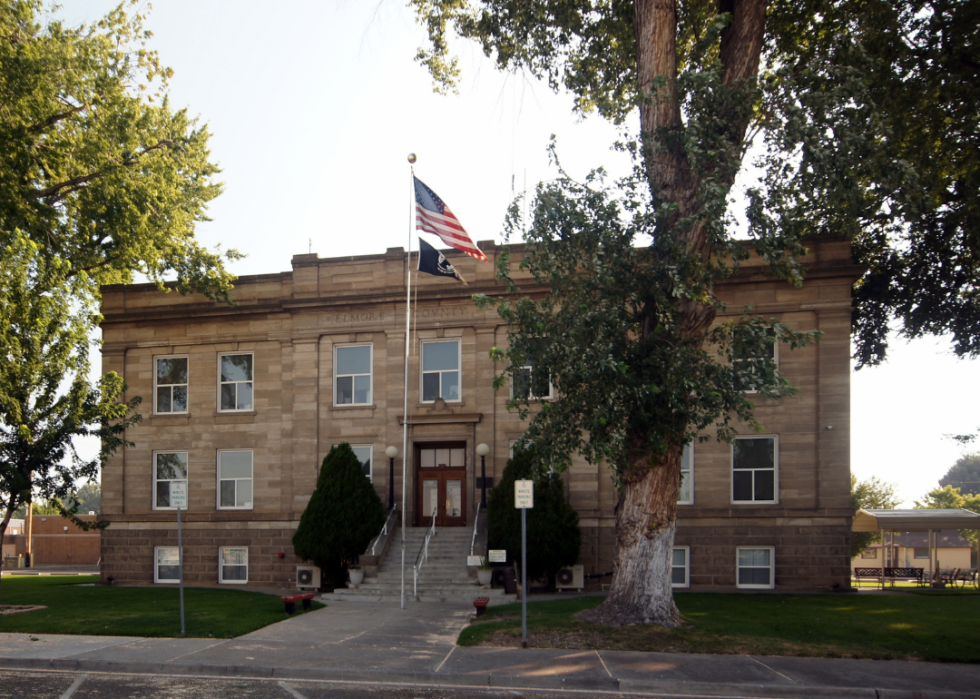
#14. Elmore County
Canva
- Age-adjusted rate of all strokes among adults, estimates for 2021: 3.1% (range between 2.7% and 3.5%)
- Death rate for ischemic strokes, 2018-20: 19.8 per 100K people
- Death rate for hemorrhagic strokes, 2018-20: 7.8 per 100K people
- Death rate for ischemic strokes, 2018-20: 19.8 per 100K people
- Death rate for hemorrhagic strokes, 2018-20: 7.8 per 100K people
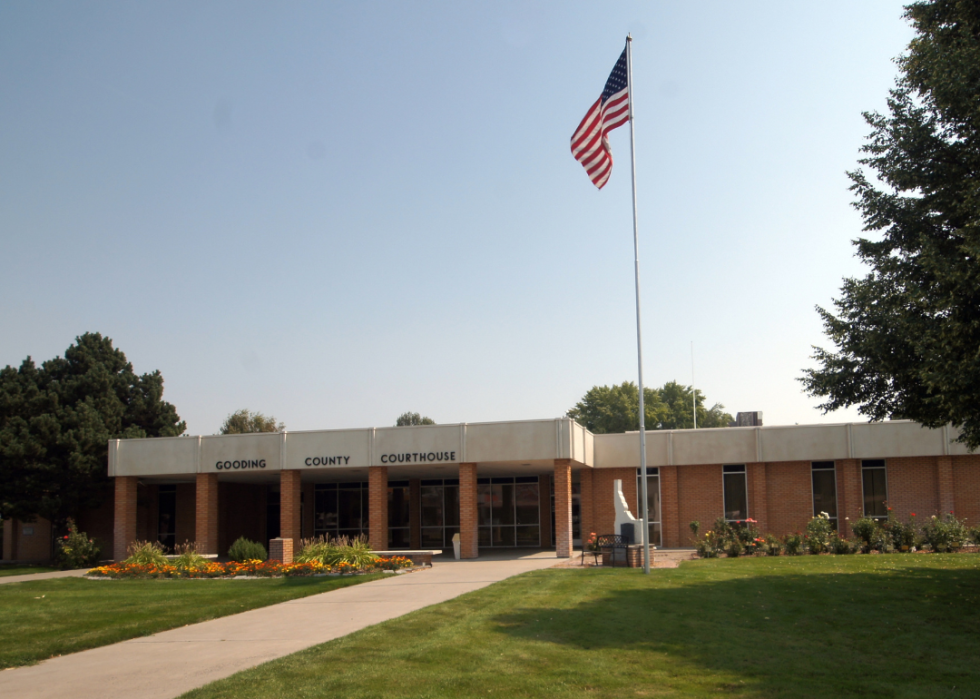
#13. Gooding County
Canva
- Age-adjusted rate of all strokes among adults, estimates for 2021: 3.1% (range between 2.8% and 3.6%)
- Death rate for ischemic strokes, 2018-20: 20.0 per 100K people
- Death rate for hemorrhagic strokes, 2018-20: 9.2 per 100K people
- Death rate for ischemic strokes, 2018-20: 20.0 per 100K people
- Death rate for hemorrhagic strokes, 2018-20: 9.2 per 100K people
#12. Power County
Canva
- Age-adjusted rate of all strokes among adults, estimates for 2021: 3.1% (range between 2.7% and 3.5%)
- Death rate for ischemic strokes, 2018-20: 24.7 per 100K people
- Death rate for hemorrhagic strokes, 2018-20: 6.5 per 100K people
- Death rate for ischemic strokes, 2018-20: 24.7 per 100K people
- Death rate for hemorrhagic strokes, 2018-20: 6.5 per 100K people
#11. Madison County
Canva
- Age-adjusted rate of all strokes among adults, estimates for 2021: 3.2% (range between 2.8% and 3.6%)
- Death rate for ischemic strokes, 2018-20: 14.7 per 100K people
- Death rate for hemorrhagic strokes, 2018-20: 7.7 per 100K people
- Death rate for ischemic strokes, 2018-20: 14.7 per 100K people
- Death rate for hemorrhagic strokes, 2018-20: 7.7 per 100K people
You may also like: Highest-rated football recruits from Idaho over the last 20 years
#10. Lincoln County
Canva
- Age-adjusted rate of all strokes among adults, estimates for 2021: 3.2% (range between 2.8% and 3.6%)
- Death rate for ischemic strokes, 2018-20: 15.7 per 100K people
- Death rate for hemorrhagic strokes, 2018-20: 4.9 per 100K people
- Death rate for ischemic strokes, 2018-20: 15.7 per 100K people
- Death rate for hemorrhagic strokes, 2018-20: 4.9 per 100K people
#9. Washington County
Canva
- Age-adjusted rate of all strokes among adults, estimates for 2021: 3.2% (range between 2.8% and 3.6%)
- Death rate for ischemic strokes, 2018-20: 17.3 per 100K people
- Death rate for hemorrhagic strokes, 2018-20: 7.6 per 100K people
- Death rate for ischemic strokes, 2018-20: 17.3 per 100K people
- Death rate for hemorrhagic strokes, 2018-20: 7.6 per 100K people
#8. Minidoka County
melissamn // Shutterstock
- Age-adjusted rate of all strokes among adults, estimates for 2021: 3.2% (range between 2.8% and 3.6%)
- Death rate for ischemic strokes, 2018-20: 19.3 per 100K people
- Death rate for hemorrhagic strokes, 2018-20: 6.5 per 100K people
- Death rate for ischemic strokes, 2018-20: 19.3 per 100K people
- Death rate for hemorrhagic strokes, 2018-20: 6.5 per 100K people
#7. Lewis County

Norm Lane // Shutterstock
- Age-adjusted rate of all strokes among adults, estimates for 2021: 3.2% (range between 2.8% and 3.6%)
- Death rate for ischemic strokes, 2018-20: 19.6 per 100K people
- Death rate for hemorrhagic strokes, 2018-20: 7.2 per 100K people
- Death rate for ischemic strokes, 2018-20: 19.6 per 100K people
- Death rate for hemorrhagic strokes, 2018-20: 7.2 per 100K people
#6. Benewah County
David Gilder // Shutterstock
- Age-adjusted rate of all strokes among adults, estimates for 2021: 3.2% (range between 2.8% and 3.6%)
- Death rate for ischemic strokes, 2018-20: 24.4 per 100K people
- Death rate for hemorrhagic strokes, 2018-20: -1.0 per 100K people
- Death rate for ischemic strokes, 2018-20: 24.4 per 100K people
- Death rate for hemorrhagic strokes, 2018-20: -1.0 per 100K people
You may also like: See how much delivery drivers in Idaho make
#5. Clark County
Canva
- Age-adjusted rate of all strokes among adults, estimates for 2021: 3.3% (range between 2.9% and 3.7%)
- Death rate for ischemic strokes, 2018-20: 18.0 per 100K people
- Death rate for hemorrhagic strokes, 2018-20: 7.3 per 100K people
- Death rate for ischemic strokes, 2018-20: 18.0 per 100K people
- Death rate for hemorrhagic strokes, 2018-20: 7.3 per 100K people
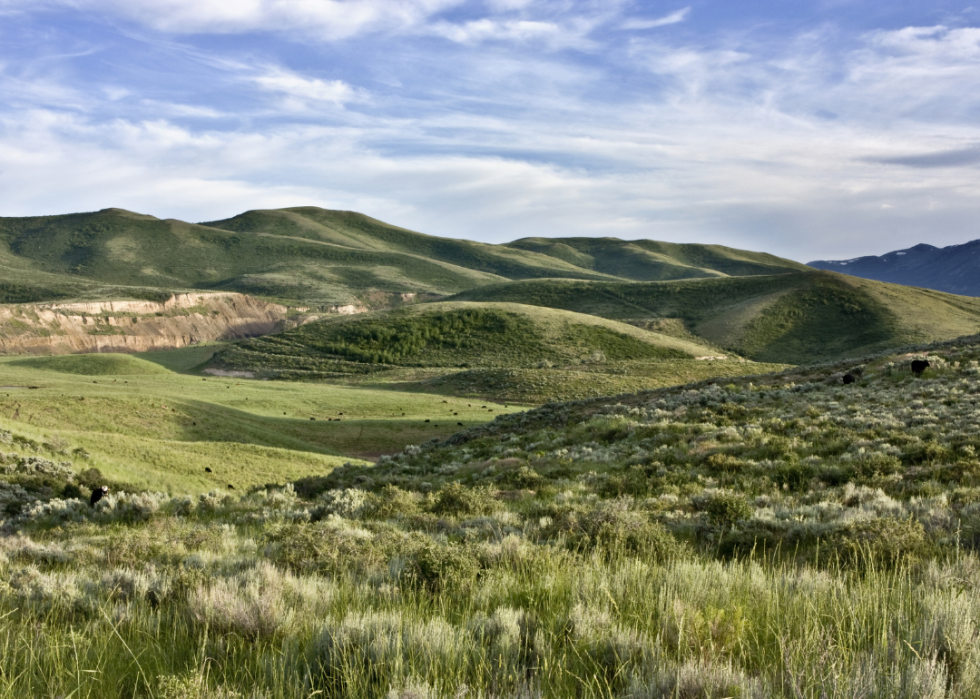
#4. Owyhee County
davidrh // Shutterstock
- Age-adjusted rate of all strokes among adults, estimates for 2021: 3.3% (range between 2.9% and 3.8%)
- Death rate for ischemic strokes, 2018-20: 20.1 per 100K people
- Death rate for hemorrhagic strokes, 2018-20: 9.1 per 100K people
- Death rate for ischemic strokes, 2018-20: 20.1 per 100K people
- Death rate for hemorrhagic strokes, 2018-20: 9.1 per 100K people
#3. Butte County
Canva
- Age-adjusted rate of all strokes among adults, estimates for 2021: 3.3% (range between 2.9% and 3.7%)
- Death rate for ischemic strokes, 2018-20: 20.2 per 100K people
- Death rate for hemorrhagic strokes, 2018-20: 8.1 per 100K people
- Death rate for ischemic strokes, 2018-20: 20.2 per 100K people
- Death rate for hemorrhagic strokes, 2018-20: 8.1 per 100K people
#2. Jerome County
jfergusonphotos // Shutterstock
- Age-adjusted rate of all strokes among adults, estimates for 2021: 3.3% (range between 2.9% and 3.7%)
- Death rate for ischemic strokes, 2018-20: 21.9 per 100K people
- Death rate for hemorrhagic strokes, 2018-20: 6.4 per 100K people
- Death rate for ischemic strokes, 2018-20: 21.9 per 100K people
- Death rate for hemorrhagic strokes, 2018-20: 6.4 per 100K people
This story features data reporting and writing by Emma Rubin and is part of a series utilizing data automation across 49 states.
#1. Shoshone County

Canva