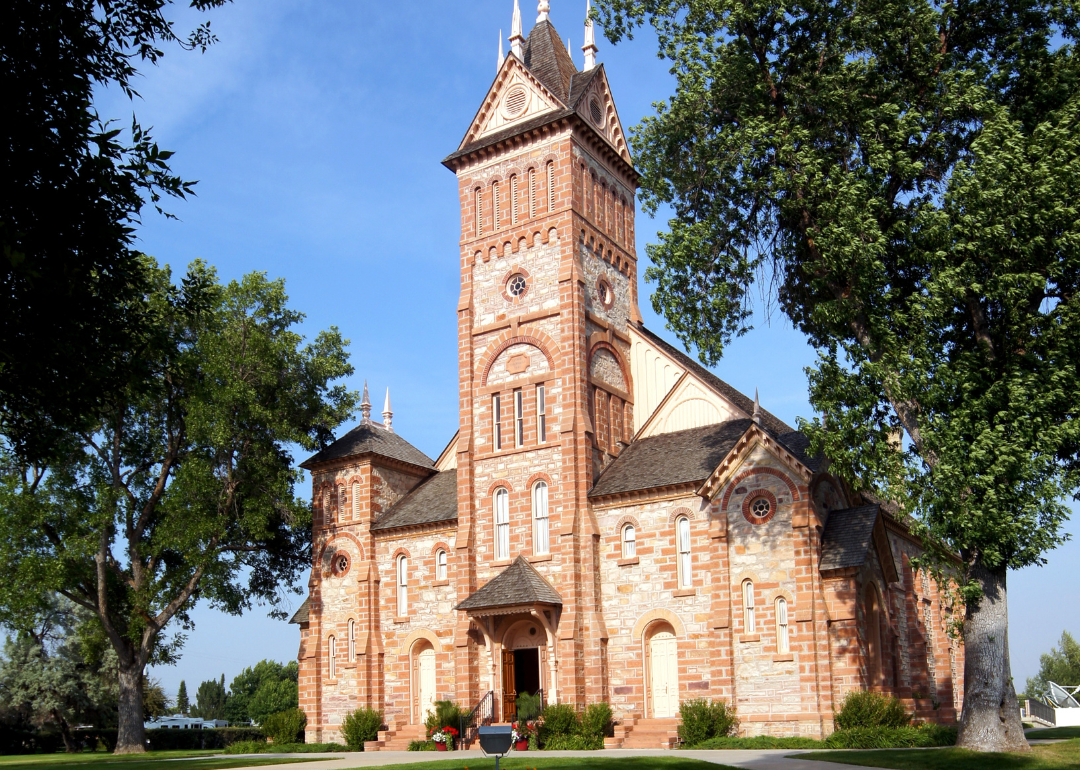
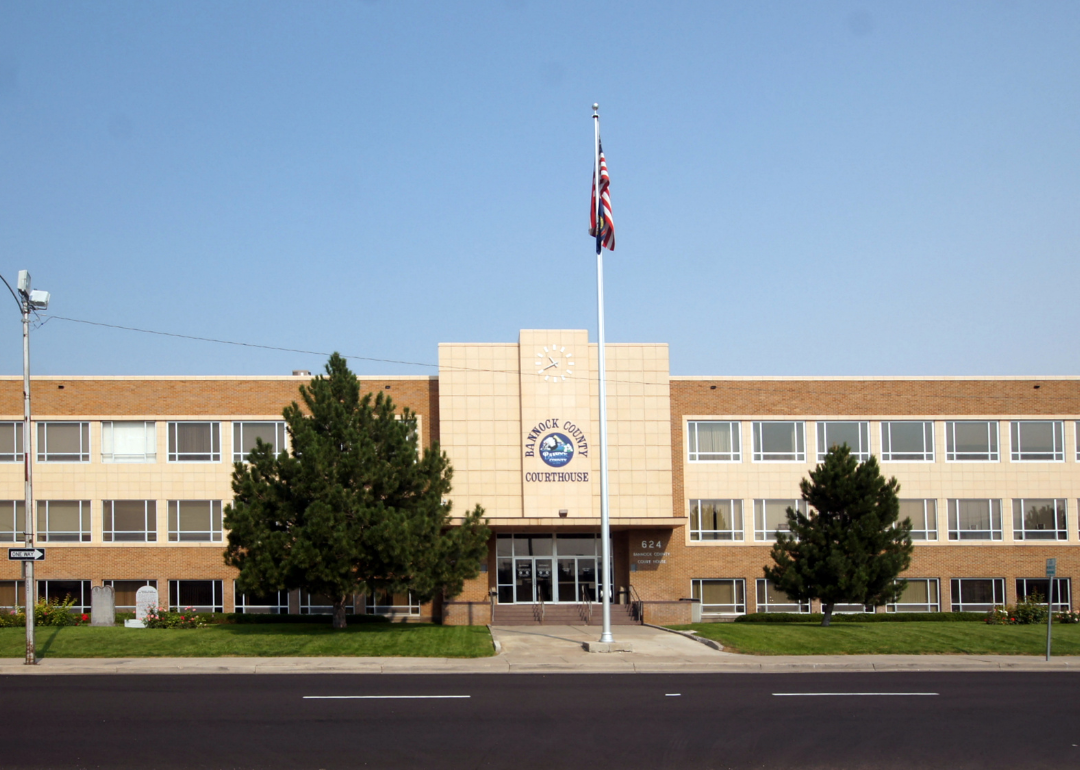
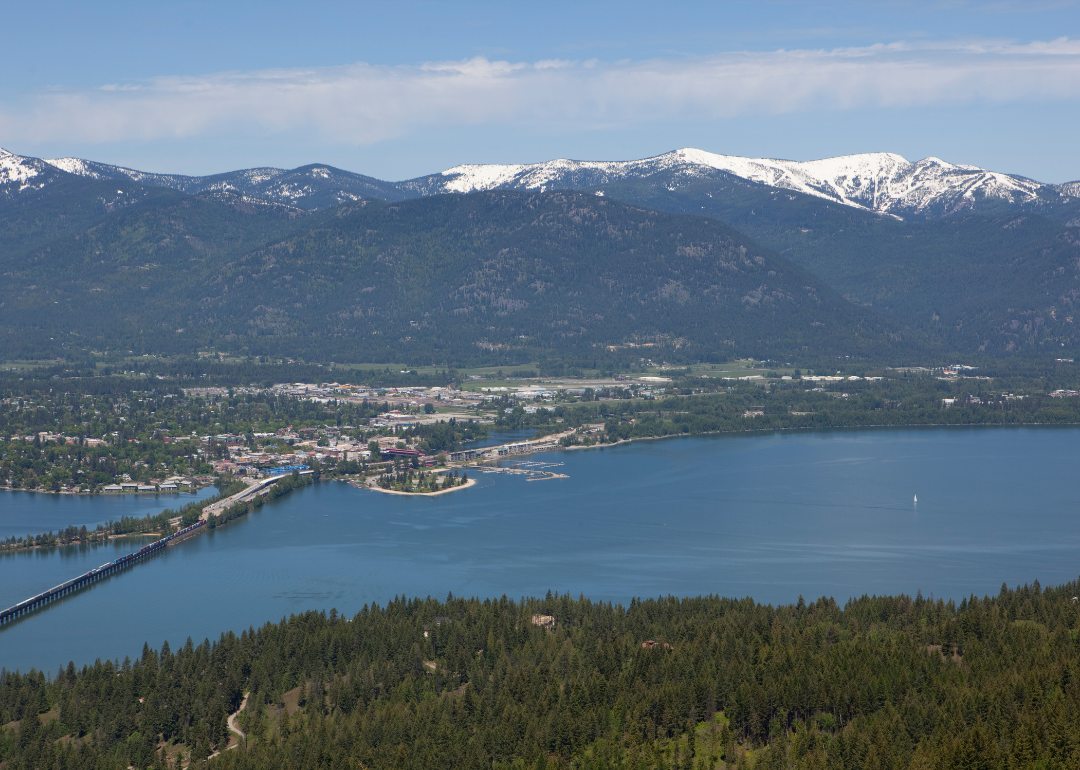
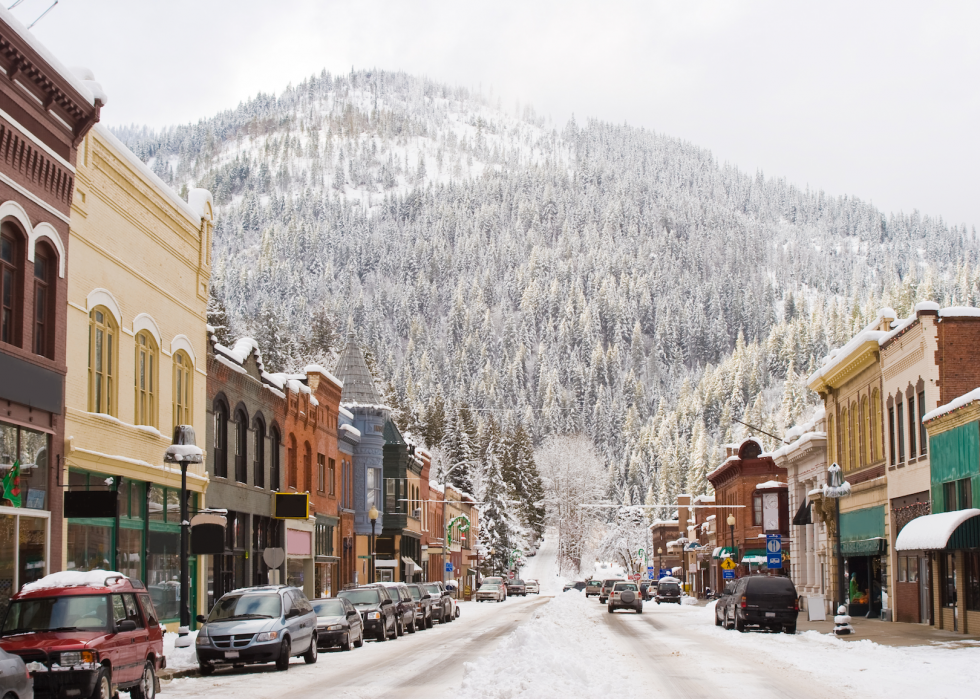
Counties with the most bridges in dire need of repair in Idaho
- Bridges in poor condition: 5.2% (6 of 115 bridges)
- Square meters of bridges in poor condition: 3.5% (637 of 18,026 square meters of bridges)
- Bridges in poor condition: 6.3% (5 of 80 bridges)
- Square meters of bridges in poor condition: 6.7% (1,289 of 19,104 square meters of bridges)
- Bridges in poor condition: 6.5% (5 of 77 bridges)
- Square meters of bridges in poor condition: 1.5% (527 of 34,969 square meters of bridges)
- Bridges in poor condition: 6.6% (9 of 136 bridges)
- Square meters of bridges in poor condition: 4.9% (1,746 of 35,647 square meters of bridges)
- Bridges in poor condition: 7.4% (9 of 122 bridges)
- Square meters of bridges in poor condition: 3.7% (814 of 21,893 square meters of bridges)

- Bridges in poor condition: 8.1% (3 of 37 bridges)
- Square meters of bridges in poor condition: 5.3% (317 of 6,019 square meters of bridges)
- Bridges in poor condition: 8.2% (8 of 98 bridges)
- Square meters of bridges in poor condition: 12.5% (6,252 of 50,139 square meters of bridges)
- Bridges in poor condition: 8.5% (4 of 47 bridges)
- Square meters of bridges in poor condition: 2.2% (360 of 16,144 square meters of bridges)
- Bridges in poor condition: 8.8% (3 of 34 bridges)
- Square meters of bridges in poor condition: 10.9% (1,268 of 11,620 square meters of bridges)

- Bridges in poor condition: 8.9% (5 of 56 bridges)
- Square meters of bridges in poor condition: 7.8% (537 of 6,877 square meters of bridges)

- Bridges in poor condition: 9.0% (10 of 111 bridges)
- Square meters of bridges in poor condition: 3.7% (1,212 of 32,420 square meters of bridges)
- Bridges in poor condition: 9.9% (12 of 121 bridges)
- Square meters of bridges in poor condition: 7.5% (5,920 of 78,745 square meters of bridges)

- Bridges in poor condition: 10.4% (5 of 48 bridges)
- Square meters of bridges in poor condition: 1.8% (362 of 20,444 square meters of bridges)
- Bridges in poor condition: 10.6% (11 of 104 bridges)
- Square meters of bridges in poor condition: 2.8% (2,396 of 84,467 square meters of bridges)

- Bridges in poor condition: 10.8% (9 of 83 bridges)
- Square meters of bridges in poor condition: 5.0% (1,703 of 34,131 square meters of bridges)
- Bridges in poor condition: 11.2% (29 of 260 bridges)
- Square meters of bridges in poor condition: 6.2% (7,682 of 122,974 square meters of bridges)
- Bridges in poor condition: 12.5% (5 of 40 bridges)
- Square meters of bridges in poor condition: 12.9% (1,461 of 11,343 square meters of bridges)
- Bridges in poor condition: 12.5% (11 of 88 bridges)
- Square meters of bridges in poor condition: 18.4% (2,212 of 11,995 square meters of bridges)
- Bridges in poor condition: 13.0% (3 of 23 bridges)
- Square meters of bridges in poor condition: 8.3% (620 of 7,436 square meters of bridges)

- Bridges in poor condition: 20.8% (11 of 53 bridges)
- Square meters of bridges in poor condition: 13.8% (992 of 7,163 square meters of bridges)