Cities with the most expensive homes in the Bloomington, Illinois metro area
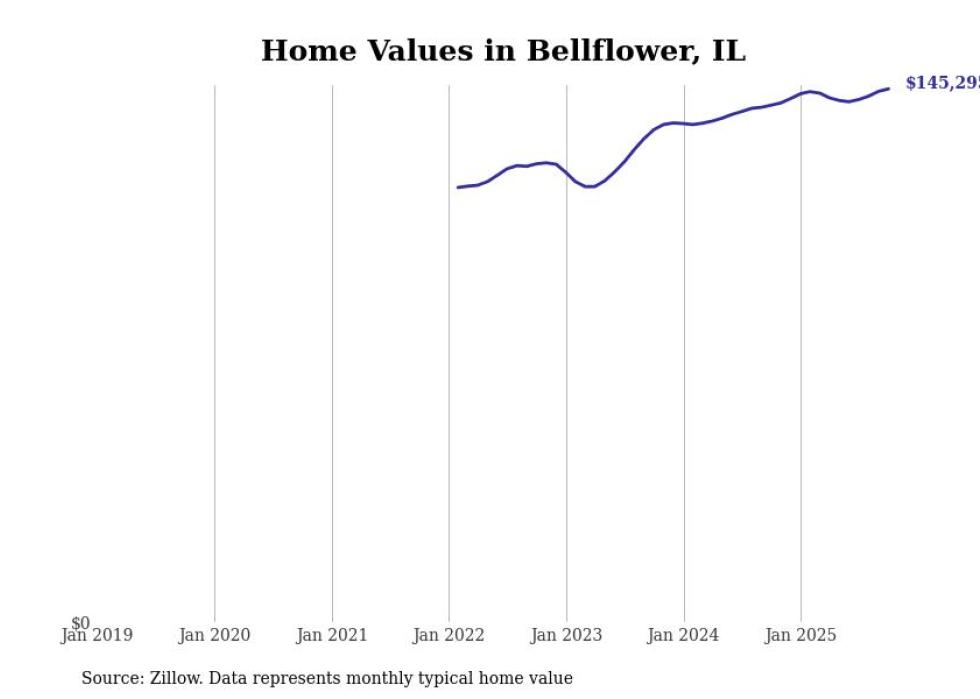
- Typical home value: $145,295
- 1-year price change: +3.2%
- 5-year price change: data not available
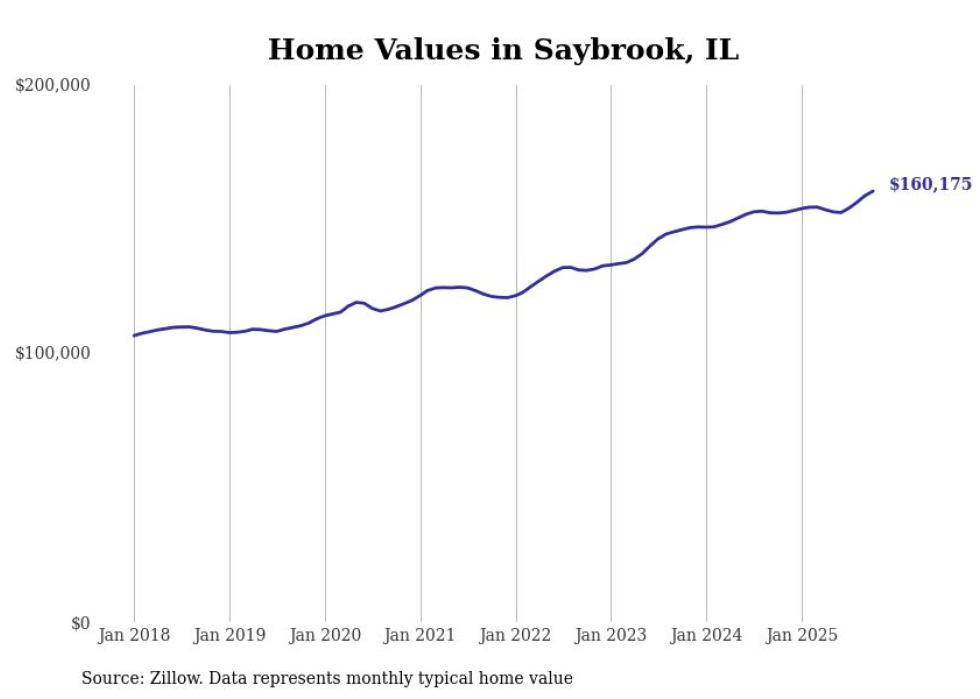
- Typical home value: $160,175
- 1-year price change: +5.4%
- 5-year price change: +36.7%
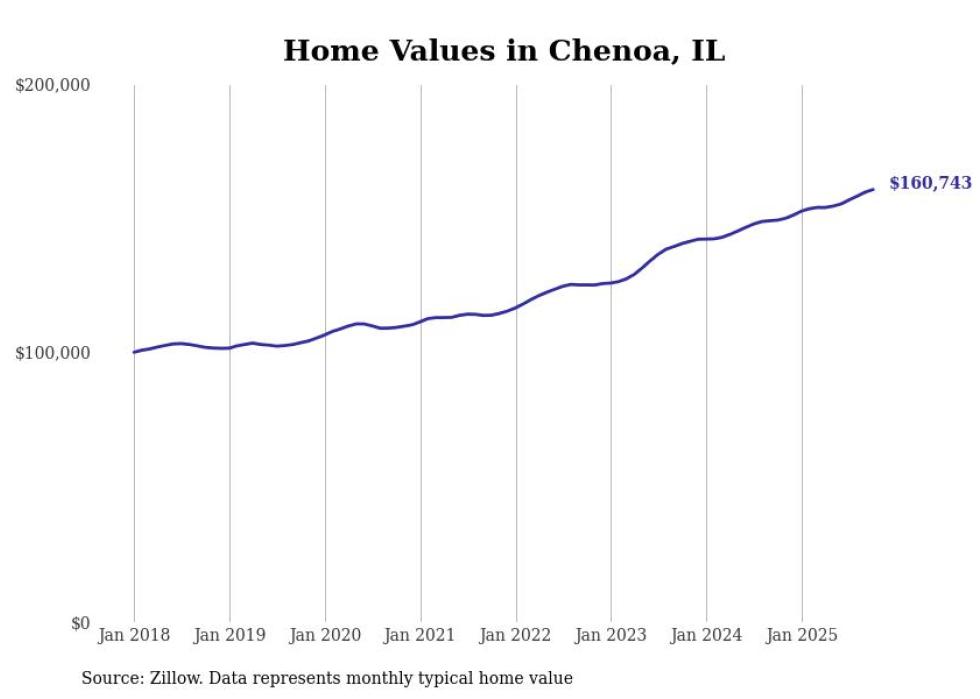
- Typical home value: $160,743
- 1-year price change: +7.6%
- 5-year price change: +46.8%
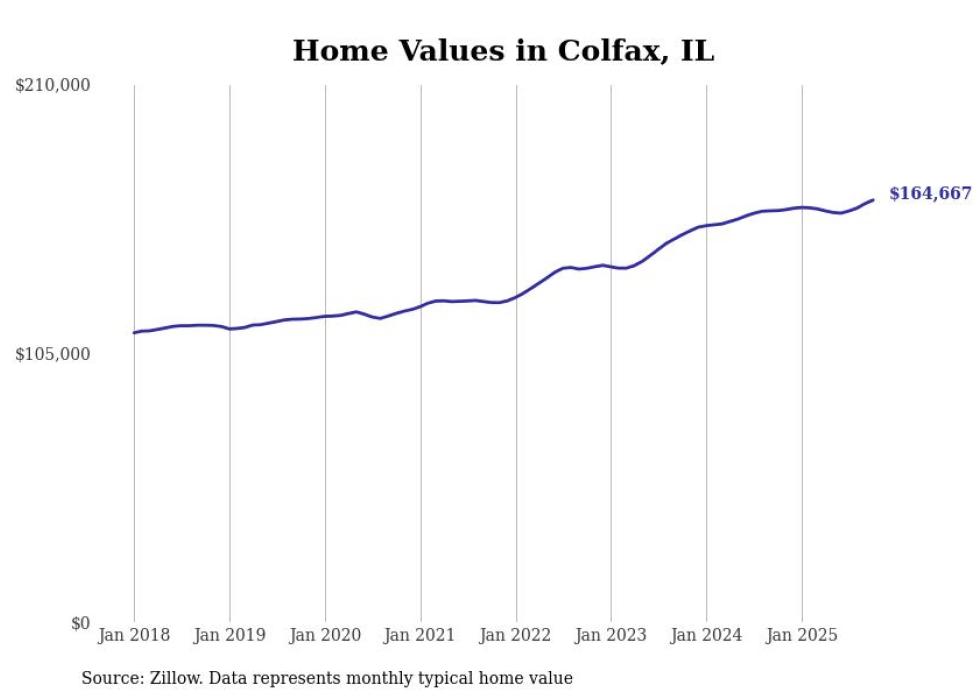
- Typical home value: $164,667
- 1-year price change: +2.6%
- 5-year price change: +36.7%
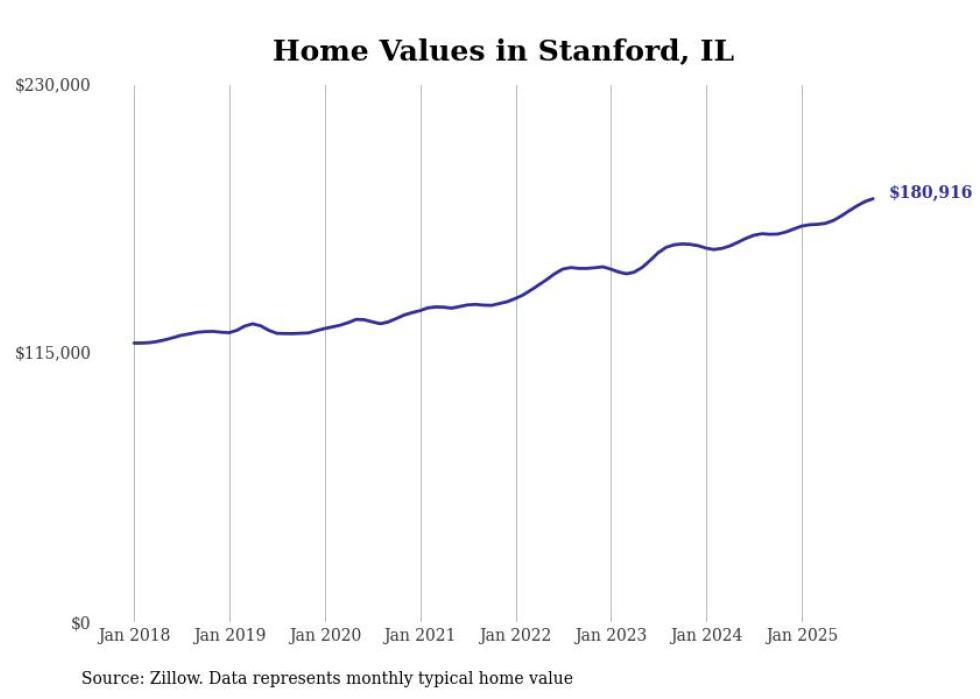
- Typical home value: $180,916
- 1-year price change: +9.1%
- 5-year price change: +39.5%
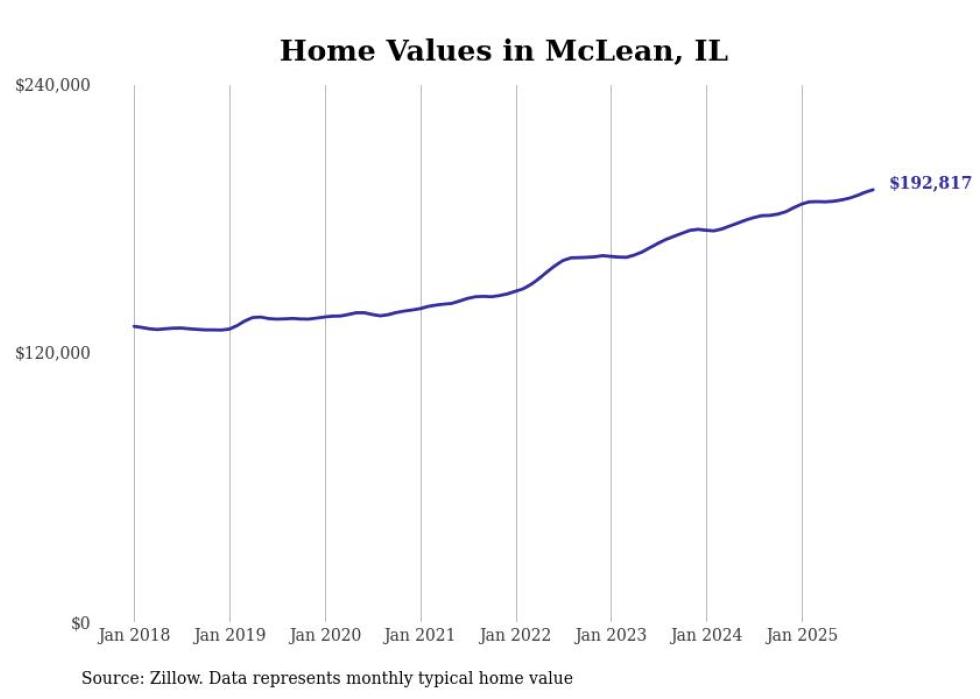
- Typical home value: $192,817
- 1-year price change: +6.0%
- 5-year price change: +39.7%
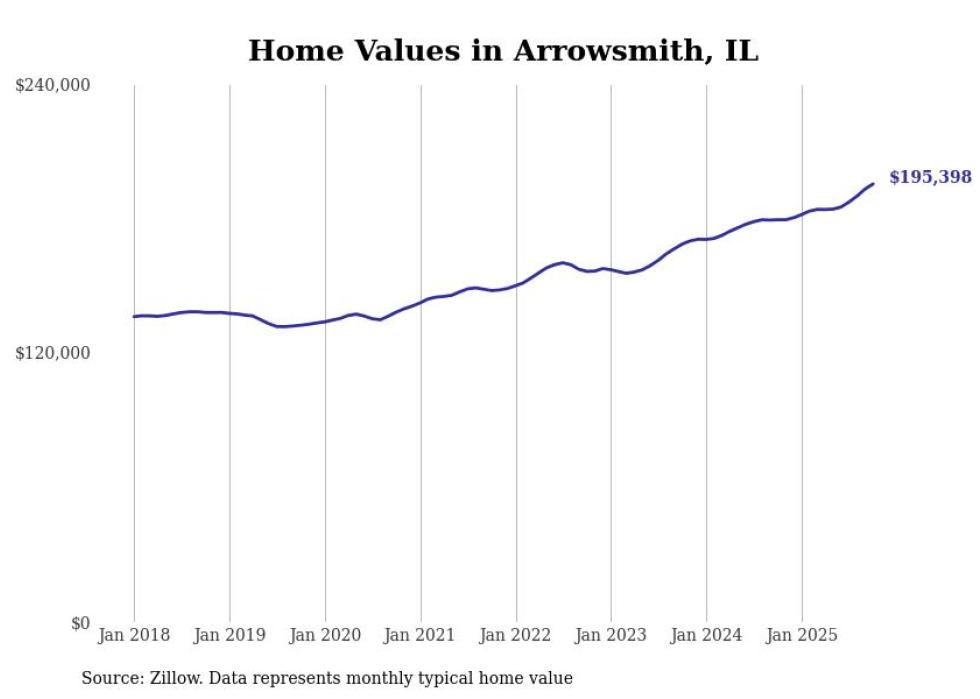
- Typical home value: $195,398
- 1-year price change: +8.9%
- 5-year price change: +41.4%
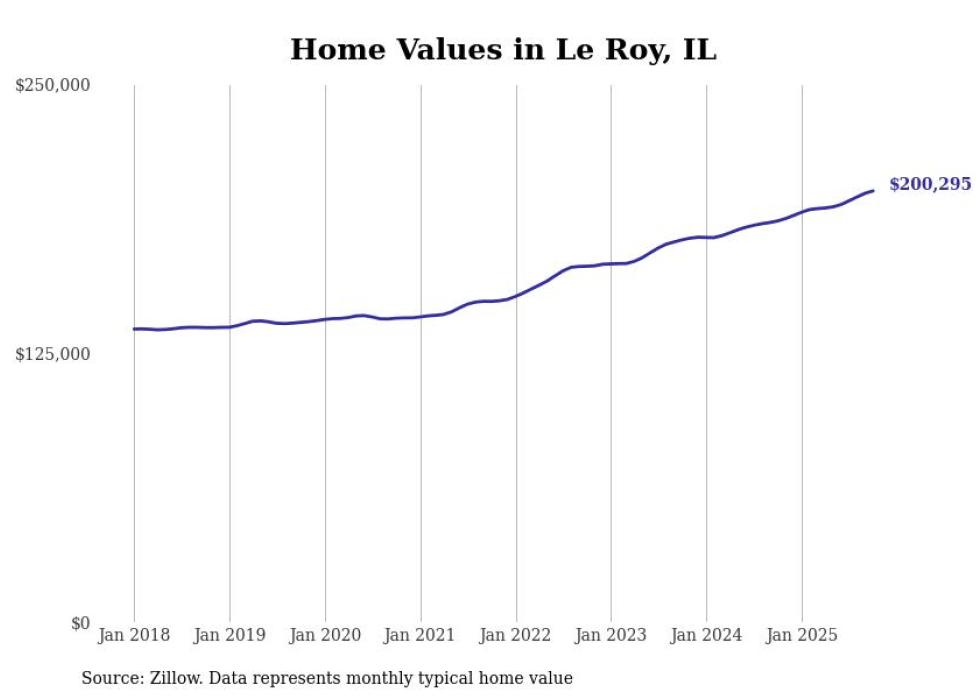
- Typical home value: $200,295
- 1-year price change: +7.5%
- 5-year price change: +41.9%
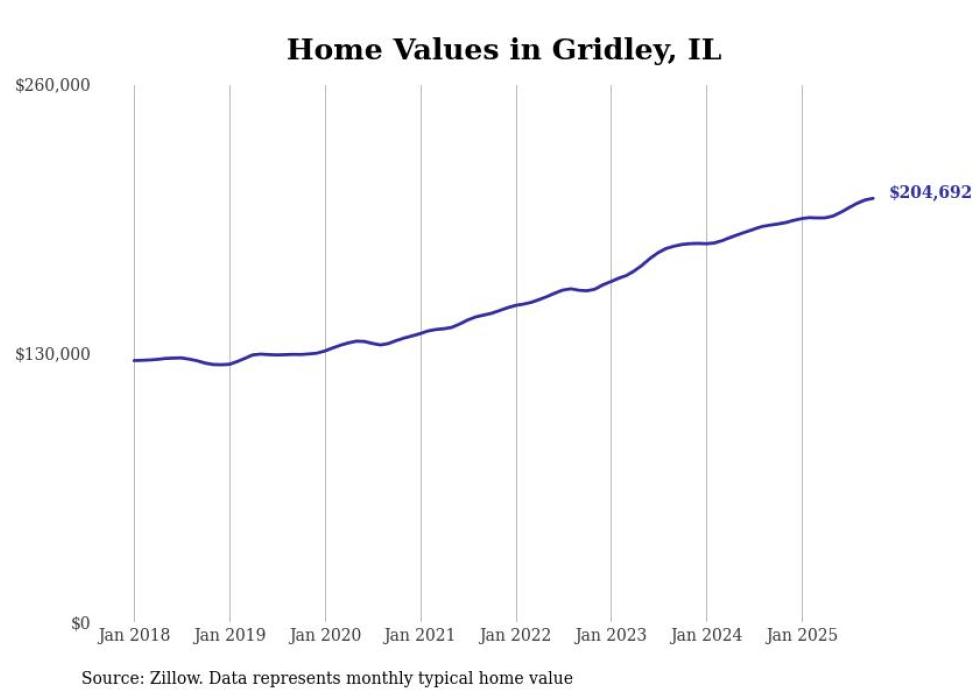
- Typical home value: $204,692
- 1-year price change: +6.4%
- 5-year price change: +50.5%
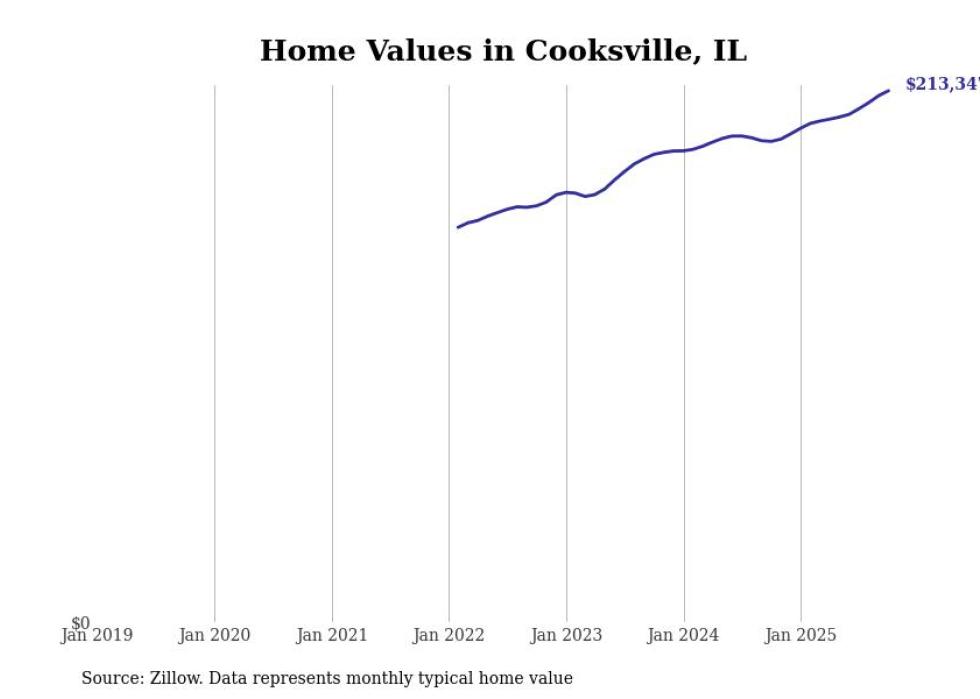
- Typical home value: $213,347
- 1-year price change: +10.5%
- 5-year price change: data not available
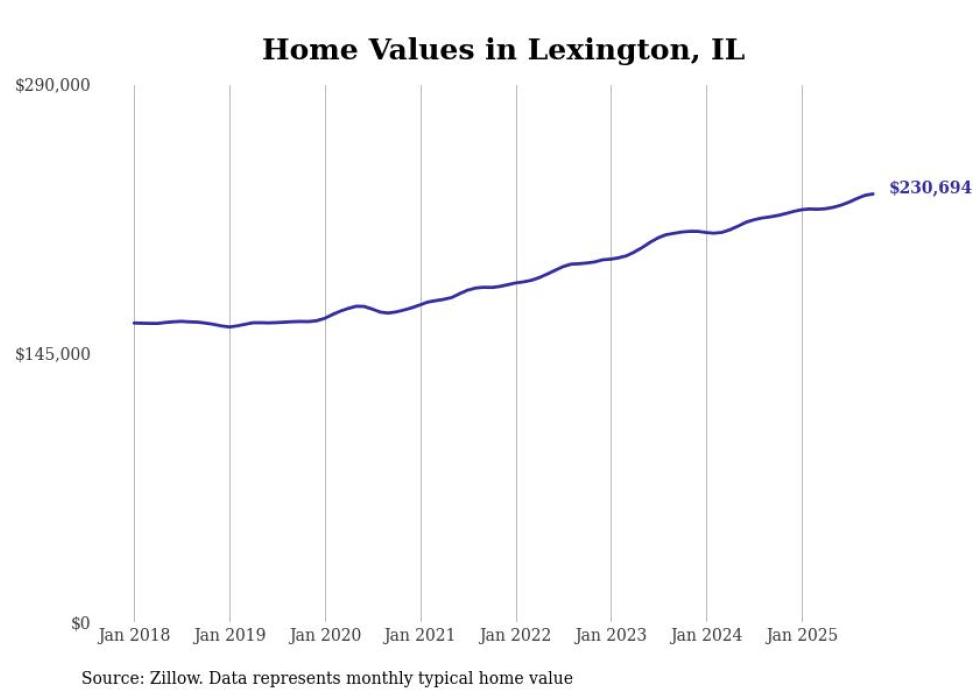
- Typical home value: $230,694
- 1-year price change: +5.3%
- 5-year price change: +38.0%
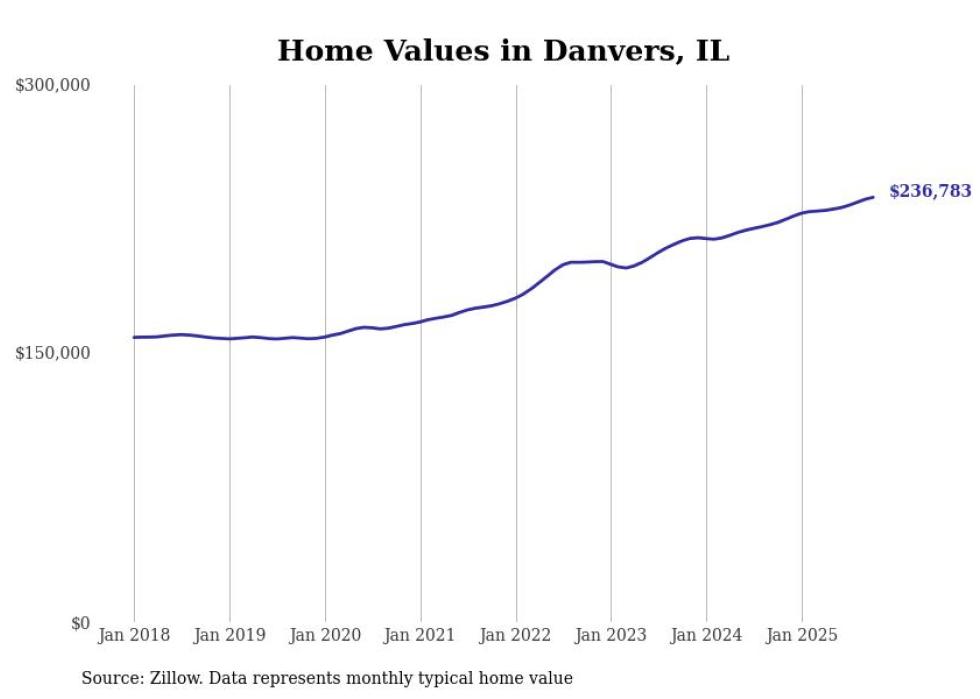
- Typical home value: $236,783
- 1-year price change: +6.3%
- 5-year price change: +43.7%
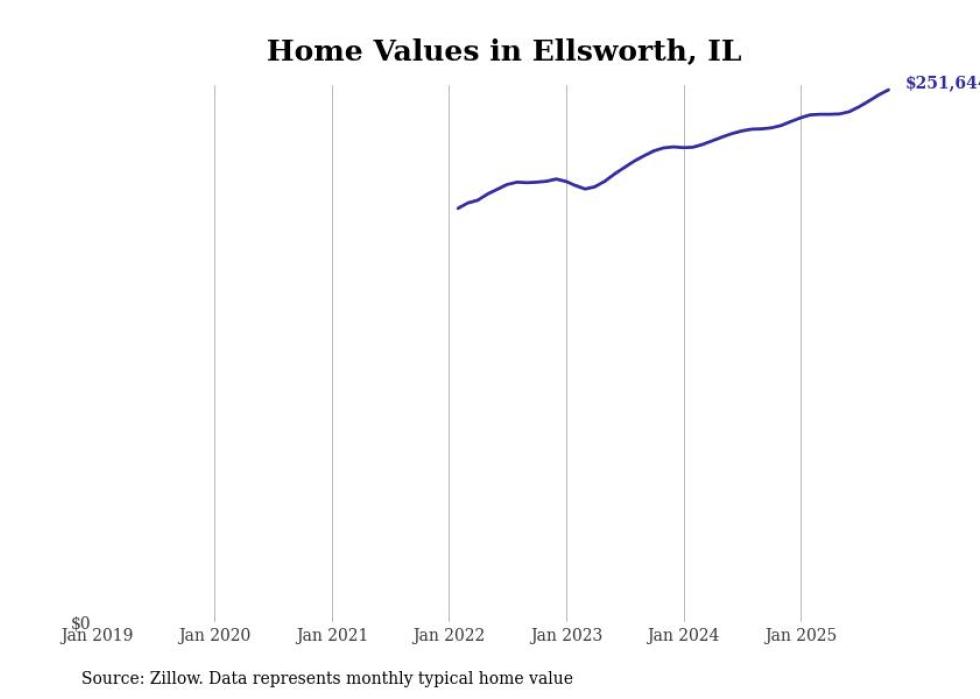
- Typical home value: $251,644
- 1-year price change: +7.7%
- 5-year price change: data not available
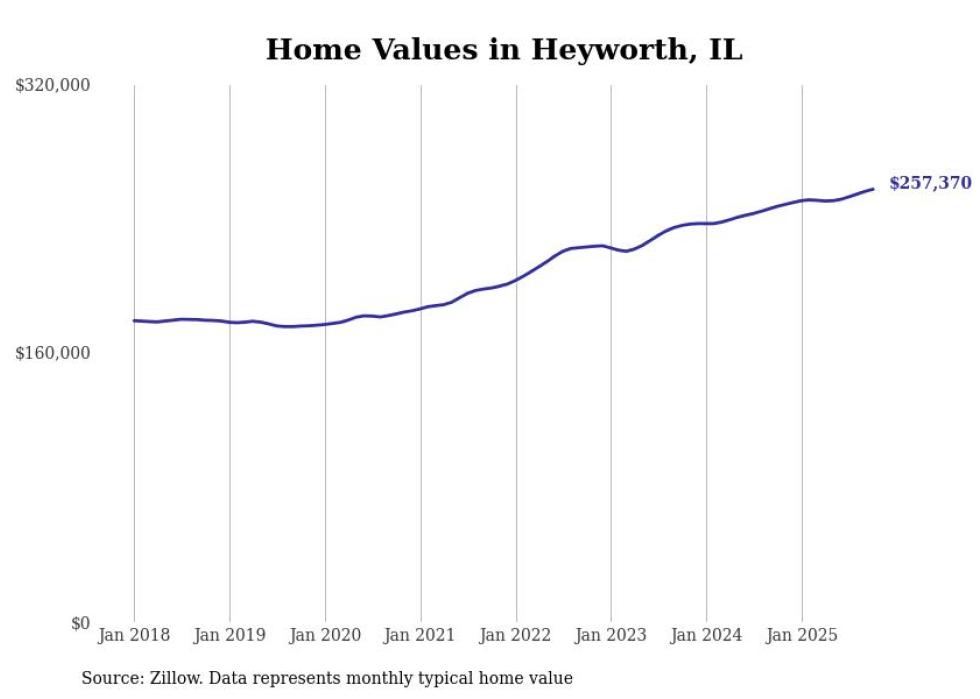
- Typical home value: $257,370
- 1-year price change: +4.1%
- 5-year price change: +40.5%
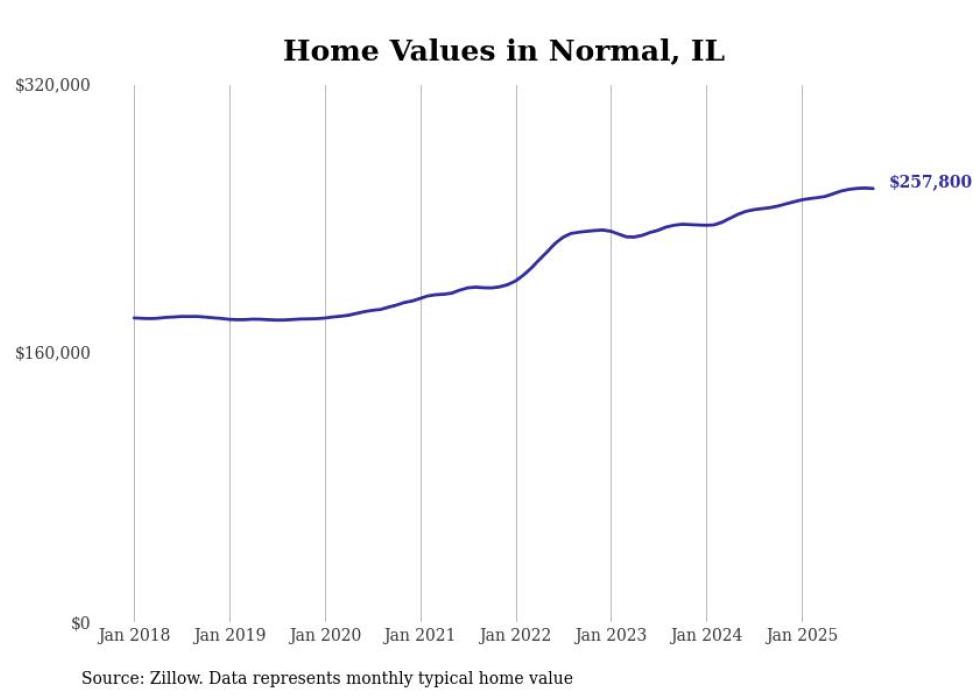
- Typical home value: $257,800
- 1-year price change: +4.2%
- 5-year price change: +36.8%
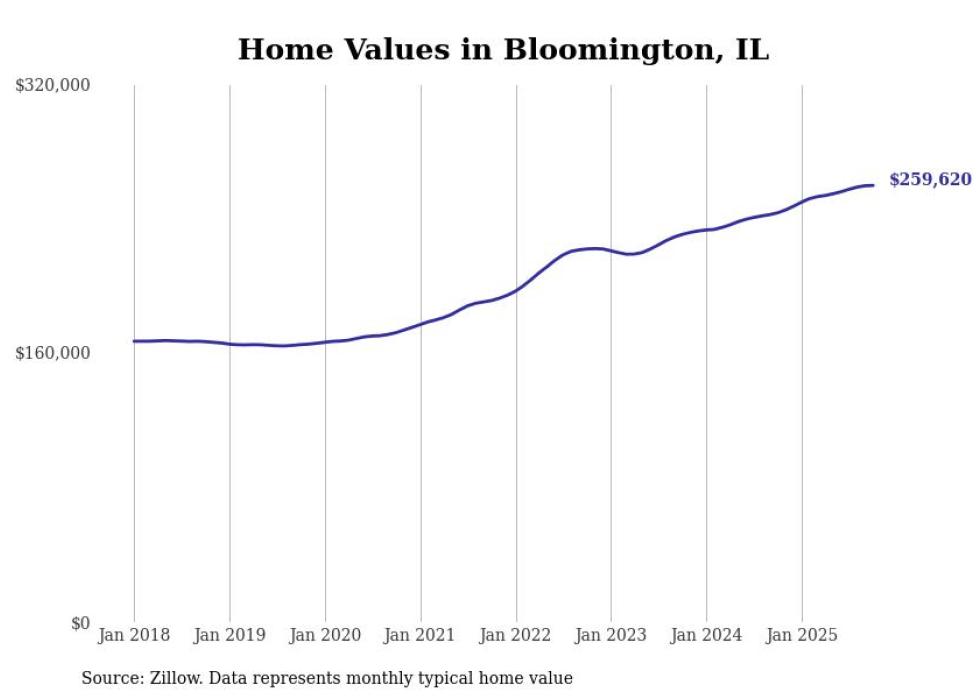
- Typical home value: $259,620
- 1-year price change: +6.7%
- 5-year price change: +50.8%
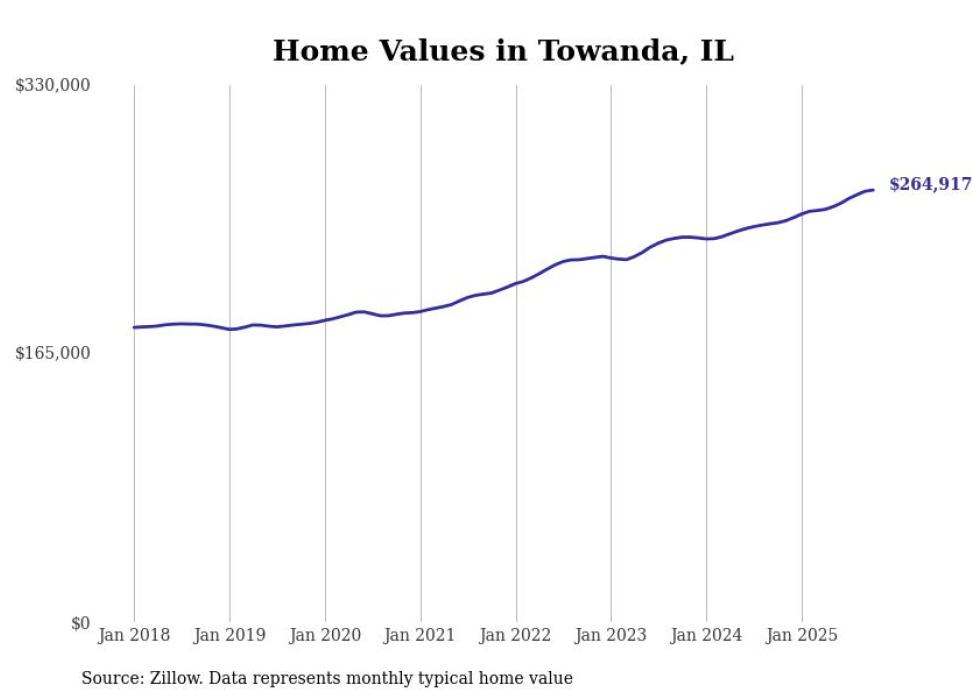
- Typical home value: $264,917
- 1-year price change: +8.2%
- 5-year price change: +40.4%
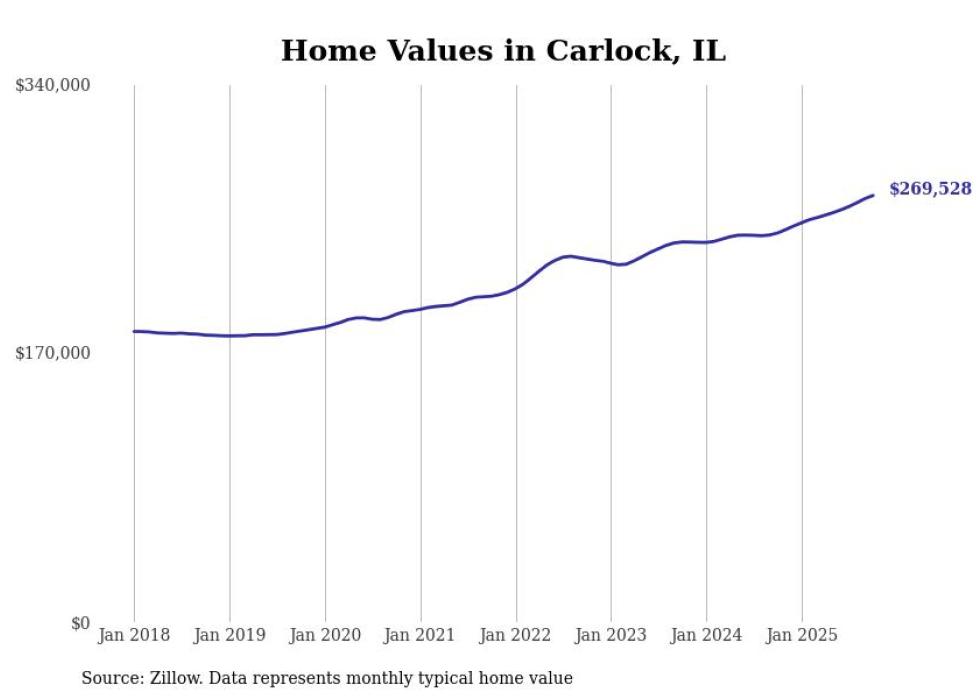
- Typical home value: $269,528
- 1-year price change: +9.6%
- 5-year price change: +38.6%
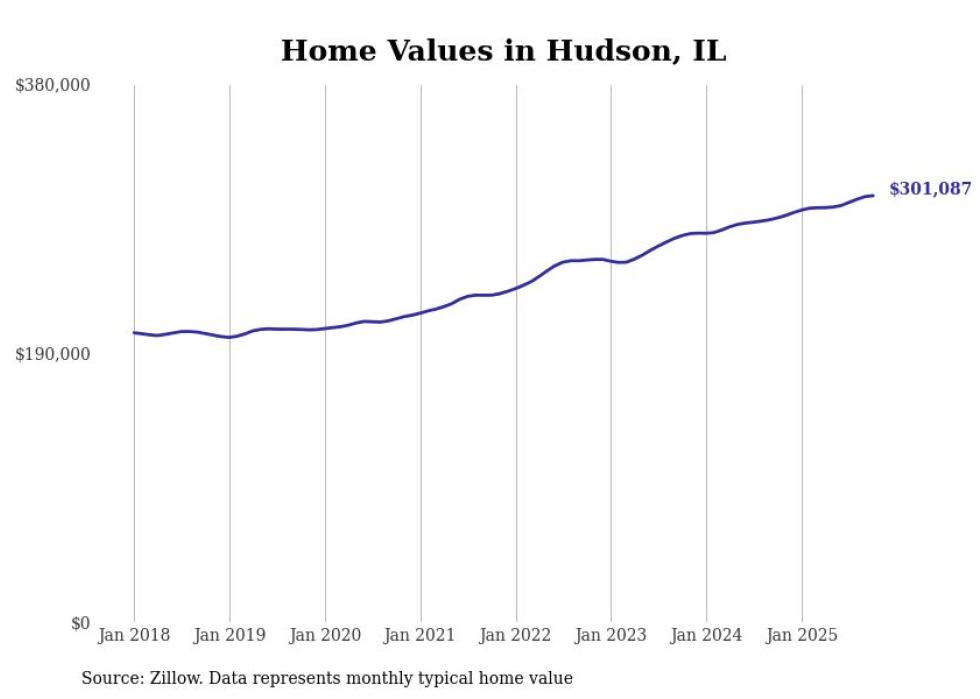
- Typical home value: $301,087
- 1-year price change: +5.5%
- 5-year price change: +40.6%
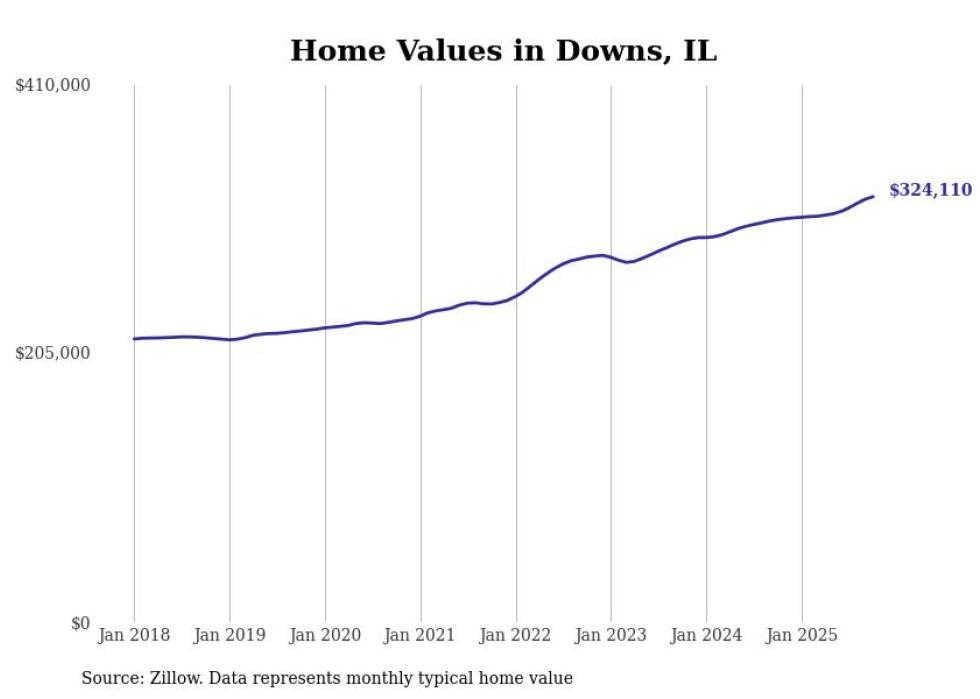
- Typical home value: $324,110
- 1-year price change: +5.7%
- 5-year price change: +41.3%