Counties with the most bridges in dire need of repair in Illinois
- Bridges in poor condition: 11.5% (13 of 113 bridges)
- Square meters of bridges in poor condition: 9.9% (2,957 of 29,771 square meters of bridges)

- Bridges in poor condition: 12.3% (32 of 261 bridges)
- Square meters of bridges in poor condition: 9.3% (5,794 of 62,364 square meters of bridges)

- Bridges in poor condition: 12.4% (24 of 194 bridges)
- Square meters of bridges in poor condition: 6.0% (3,764 of 63,059 square meters of bridges)
- Bridges in poor condition: 13.0% (48 of 370 bridges)
- Square meters of bridges in poor condition: 7.0% (6,883 of 98,457 square meters of bridges)

- Bridges in poor condition: 13.8% (237 of 1,715 bridges)
- Square meters of bridges in poor condition: 17.1% (548,031 of 3,204,178 square meters of bridges)

- Bridges in poor condition: 14.0% (7 of 50 bridges)
- Square meters of bridges in poor condition: 15.5% (1,451 of 9,383 square meters of bridges)
- Bridges in poor condition: 14.3% (10 of 70 bridges)
- Square meters of bridges in poor condition: 9.8% (1,557 of 15,819 square meters of bridges)

- Bridges in poor condition: 14.4% (82 of 569 bridges)
- Square meters of bridges in poor condition: 11.0% (16,246 of 147,752 square meters of bridges)

- Bridges in poor condition: 15.6% (54 of 347 bridges)
- Square meters of bridges in poor condition: 13.4% (21,260 of 158,692 square meters of bridges)

- Bridges in poor condition: 15.9% (57 of 358 bridges)
- Square meters of bridges in poor condition: 27.5% (85,442 of 310,432 square meters of bridges)

- Bridges in poor condition: 16.4% (30 of 183 bridges)
- Square meters of bridges in poor condition: 15.0% (11,416 of 75,874 square meters of bridges)
- Bridges in poor condition: 16.8% (63 of 374 bridges)
- Square meters of bridges in poor condition: 9.3% (15,366 of 165,709 square meters of bridges)
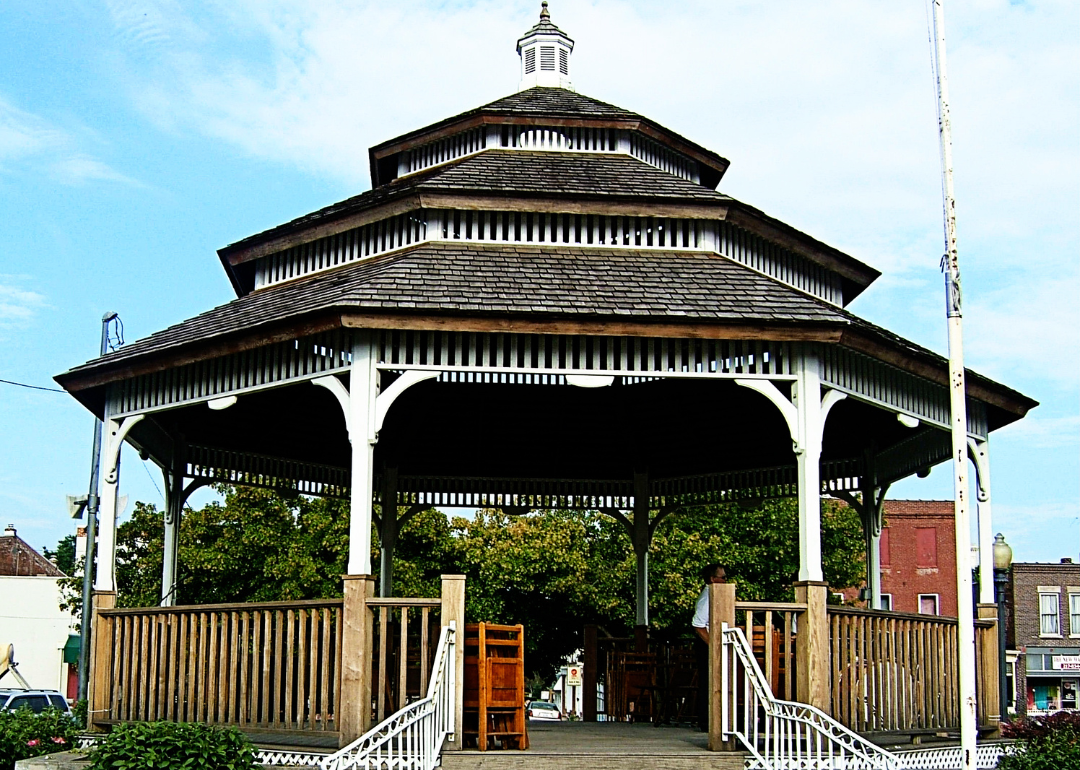
- Bridges in poor condition: 17.2% (42 of 244 bridges)
- Square meters of bridges in poor condition: 10.1% (6,849 of 67,692 square meters of bridges)

- Bridges in poor condition: 17.7% (57 of 322 bridges)
- Square meters of bridges in poor condition: 10.4% (7,808 of 75,149 square meters of bridges)

- Bridges in poor condition: 17.8% (40 of 225 bridges)
- Square meters of bridges in poor condition: 9.5% (8,322 of 87,384 square meters of bridges)
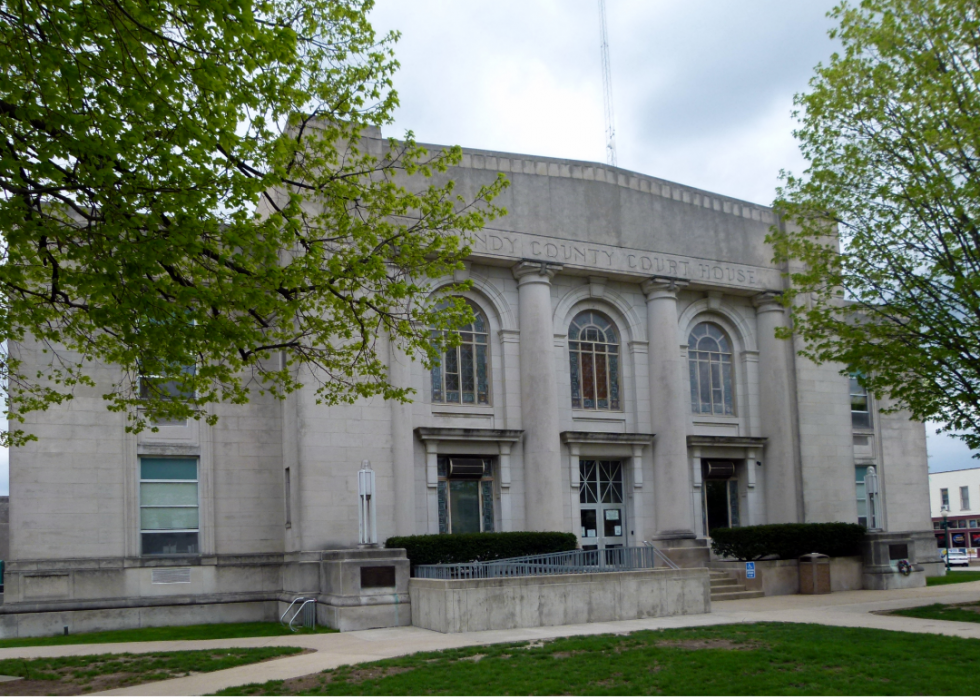
- Bridges in poor condition: 18.6% (50 of 269 bridges)
- Square meters of bridges in poor condition: 17.3% (18,122 of 104,767 square meters of bridges)

- Bridges in poor condition: 20.0% (42 of 210 bridges)
- Square meters of bridges in poor condition: 30.0% (20,506 of 68,307 square meters of bridges)

- Bridges in poor condition: 20.2% (60 of 297 bridges)
- Square meters of bridges in poor condition: 15.7% (15,111 of 96,513 square meters of bridges)
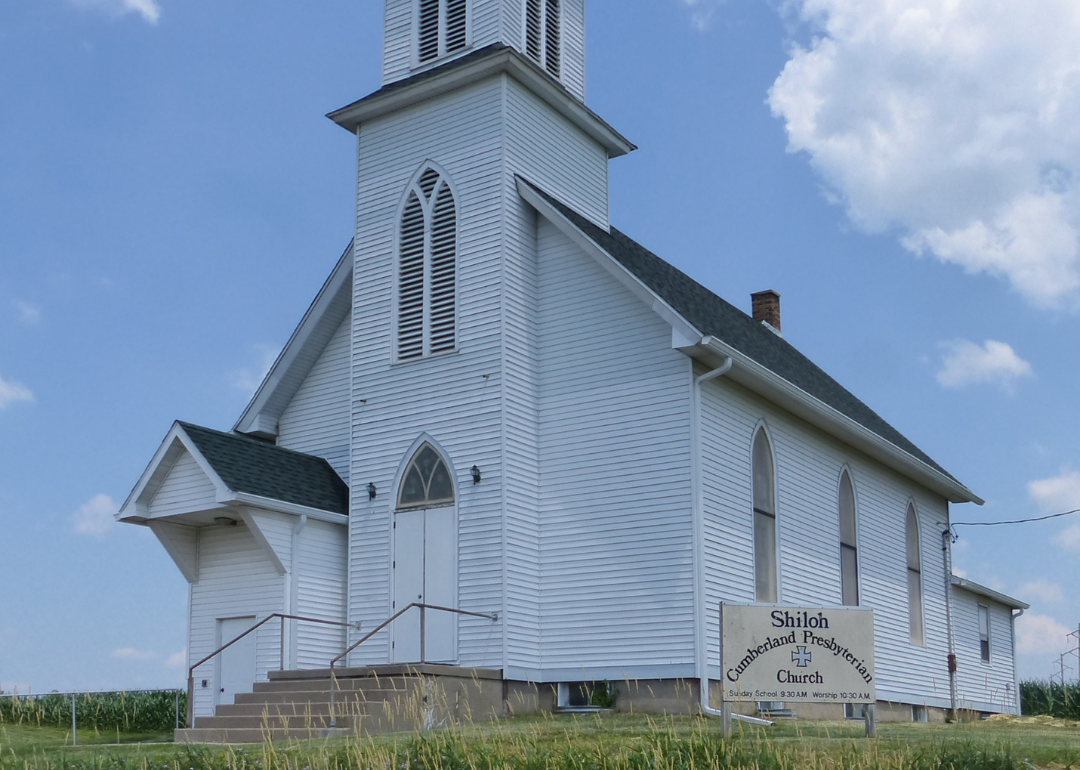
- Bridges in poor condition: 22.1% (17 of 77 bridges)
- Square meters of bridges in poor condition: 38.0% (13,168 of 34,651 square meters of bridges)

- Bridges in poor condition: 22.4% (79 of 353 bridges)
- Square meters of bridges in poor condition: 31.6% (60,810 of 192,476 square meters of bridges)
