Counties with the highest rates of strokes in Indiana

- Death rate for ischemic strokes, 2018-20: 21.1 per 100K people
- Death rate for hemorrhagic strokes, 2018-20: 10.0 per 100K people

- Death rate for ischemic strokes, 2018-20: 21.4 per 100K people
- Death rate for hemorrhagic strokes, 2018-20: 10.2 per 100K people
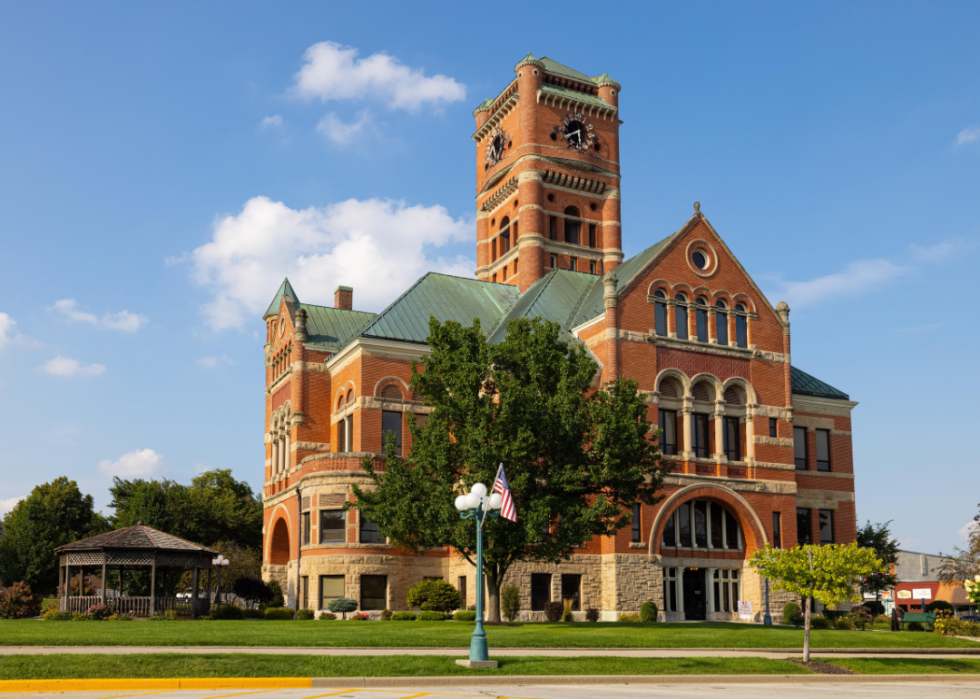
- Death rate for ischemic strokes, 2018-20: 22.0 per 100K people
- Death rate for hemorrhagic strokes, 2018-20: 9.8 per 100K people
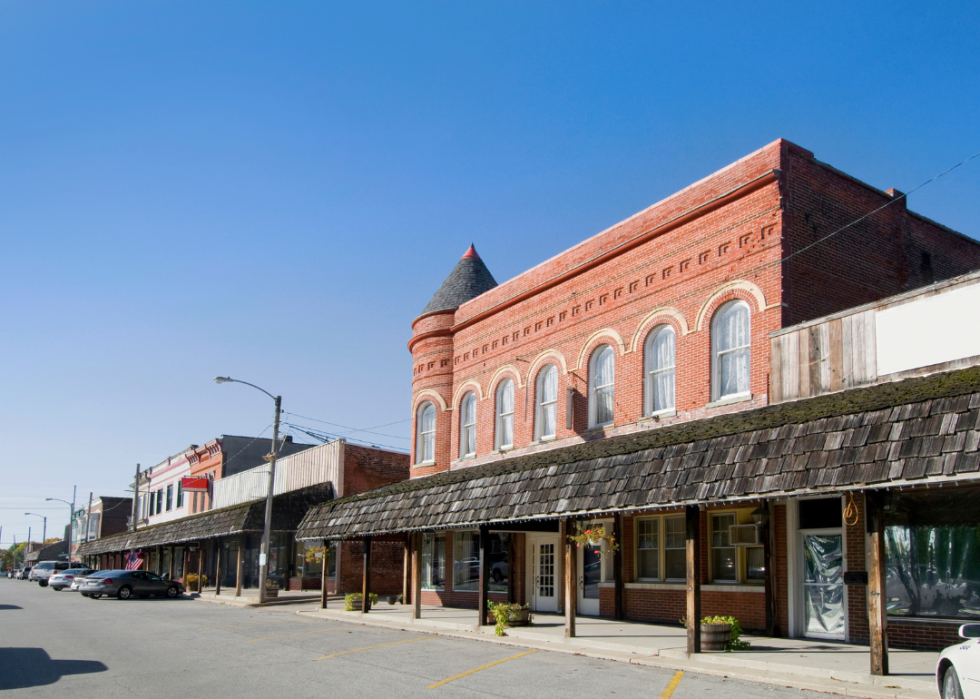
- Death rate for ischemic strokes, 2018-20: 22.4 per 100K people
- Death rate for hemorrhagic strokes, 2018-20: 10.3 per 100K people

- Death rate for ischemic strokes, 2018-20: 22.6 per 100K people
- Death rate for hemorrhagic strokes, 2018-20: 10.2 per 100K people
You may also like: Counties with the highest rate of food insecure children in Indiana
- Death rate for ischemic strokes, 2018-20: 24.4 per 100K people
- Death rate for hemorrhagic strokes, 2018-20: 12.3 per 100K people

- Death rate for ischemic strokes, 2018-20: 28.7 per 100K people
- Death rate for hemorrhagic strokes, 2018-20: 8.7 per 100K people

- Death rate for ischemic strokes, 2018-20: 15.9 per 100K people
- Death rate for hemorrhagic strokes, 2018-20: 9.5 per 100K people

- Death rate for ischemic strokes, 2018-20: 18.4 per 100K people
- Death rate for hemorrhagic strokes, 2018-20: 10.4 per 100K people
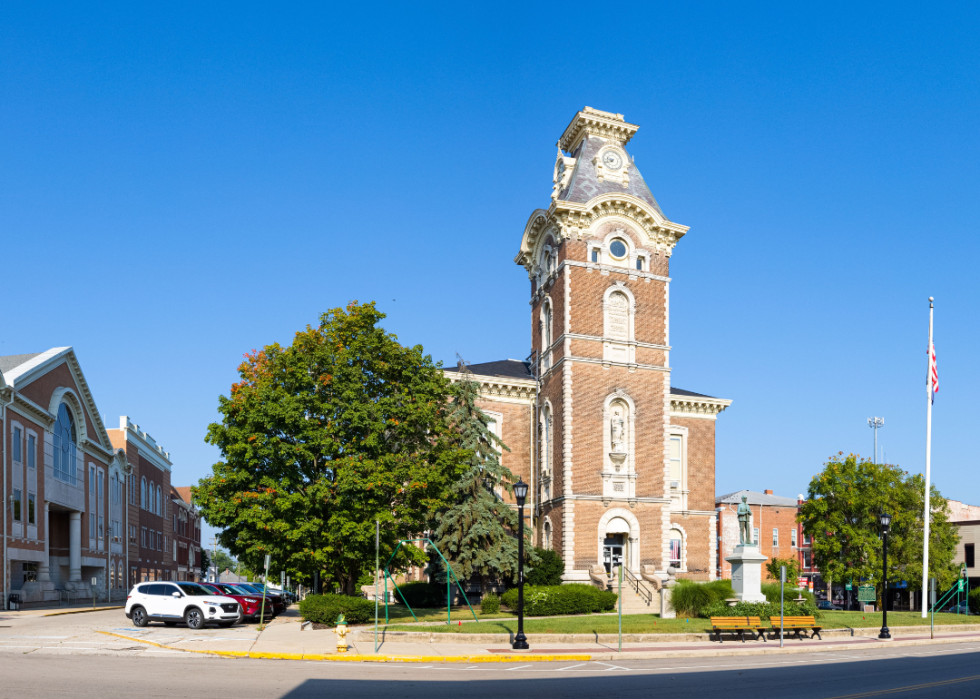
- Death rate for ischemic strokes, 2018-20: 20.6 per 100K people
- Death rate for hemorrhagic strokes, 2018-20: 10.8 per 100K people
You may also like: Counties with the lowest hospital bed capacity in Indiana
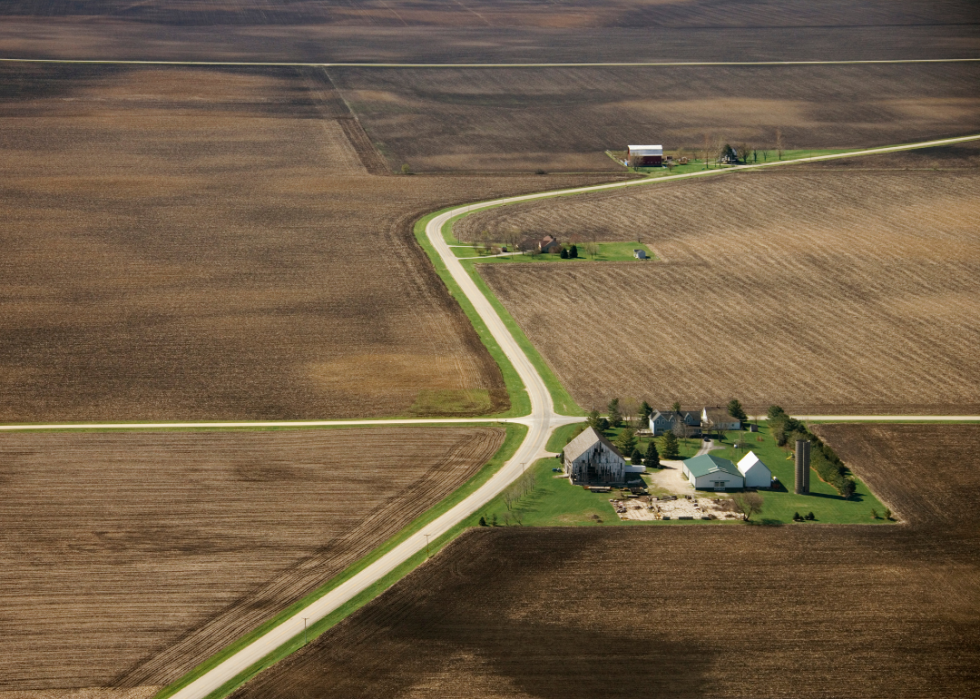
- Death rate for ischemic strokes, 2018-20: 21.3 per 100K people
- Death rate for hemorrhagic strokes, 2018-20: 10.1 per 100K people
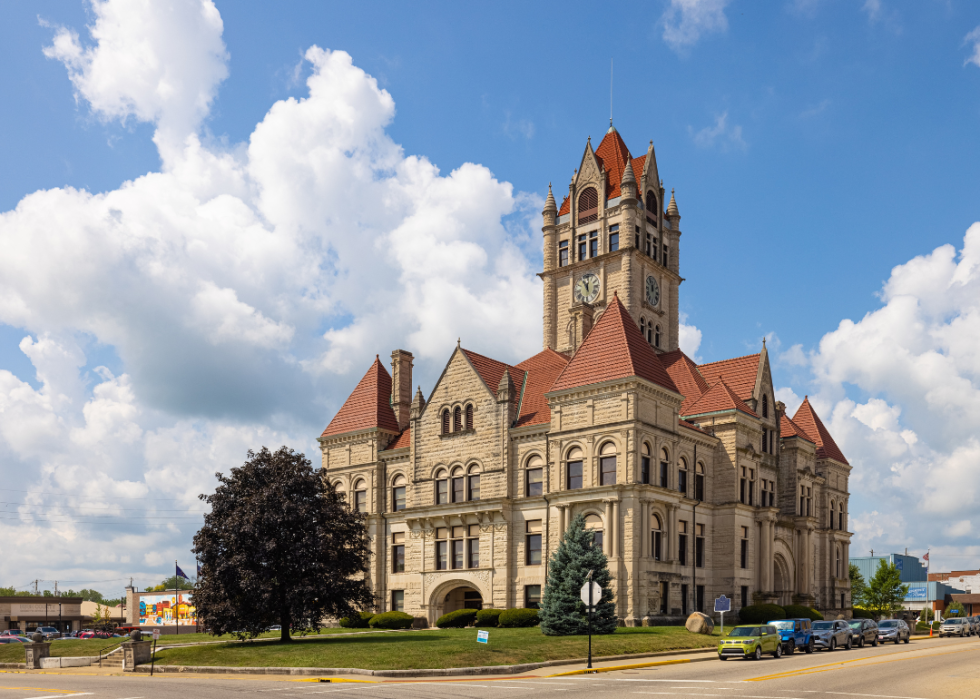
- Death rate for ischemic strokes, 2018-20: 21.8 per 100K people
- Death rate for hemorrhagic strokes, 2018-20: 10.5 per 100K people

- Death rate for ischemic strokes, 2018-20: 22.5 per 100K people
- Death rate for hemorrhagic strokes, 2018-20: 10.5 per 100K people

- Death rate for ischemic strokes, 2018-20: 22.7 per 100K people
- Death rate for hemorrhagic strokes, 2018-20: 9.4 per 100K people

- Death rate for ischemic strokes, 2018-20: 22.7 per 100K people
- Death rate for hemorrhagic strokes, 2018-20: 10.6 per 100K people
You may also like: Counties with the most veterans in Indiana

- Death rate for ischemic strokes, 2018-20: 23.0 per 100K people
- Death rate for hemorrhagic strokes, 2018-20: 9.4 per 100K people

- Death rate for ischemic strokes, 2018-20: 23.2 per 100K people
- Death rate for hemorrhagic strokes, 2018-20: 10.6 per 100K people

- Death rate for ischemic strokes, 2018-20: 23.7 per 100K people
- Death rate for hemorrhagic strokes, 2018-20: 9.0 per 100K people

- Death rate for ischemic strokes, 2018-20: 25.6 per 100K people
- Death rate for hemorrhagic strokes, 2018-20: 8.9 per 100K people

- Death rate for ischemic strokes, 2018-20: 26.3 per 100K people
- Death rate for hemorrhagic strokes, 2018-20: 12.0 per 100K people
You may also like: Indiana is the #5 state with the most people living near toxic release facilities

- Death rate for ischemic strokes, 2018-20: 27.2 per 100K people
- Death rate for hemorrhagic strokes, 2018-20: 10.1 per 100K people

- Death rate for ischemic strokes, 2018-20: 16.7 per 100K people
- Death rate for hemorrhagic strokes, 2018-20: 9.5 per 100K people

- Death rate for ischemic strokes, 2018-20: 18.8 per 100K people
- Death rate for hemorrhagic strokes, 2018-20: 9.9 per 100K people

- Death rate for ischemic strokes, 2018-20: 20.8 per 100K people
- Death rate for hemorrhagic strokes, 2018-20: 8.0 per 100K people

- Death rate for ischemic strokes, 2018-20: 22.3 per 100K people
- Death rate for hemorrhagic strokes, 2018-20: 9.9 per 100K people
You may also like: Most popular girl names in the 60s in Indiana

- Death rate for ischemic strokes, 2018-20: 23.6 per 100K people
- Death rate for hemorrhagic strokes, 2018-20: 11.8 per 100K people

- Death rate for ischemic strokes, 2018-20: 24.1 per 100K people
- Death rate for hemorrhagic strokes, 2018-20: 8.8 per 100K people

- Death rate for ischemic strokes, 2018-20: 24.2 per 100K people
- Death rate for hemorrhagic strokes, 2018-20: 8.6 per 100K people
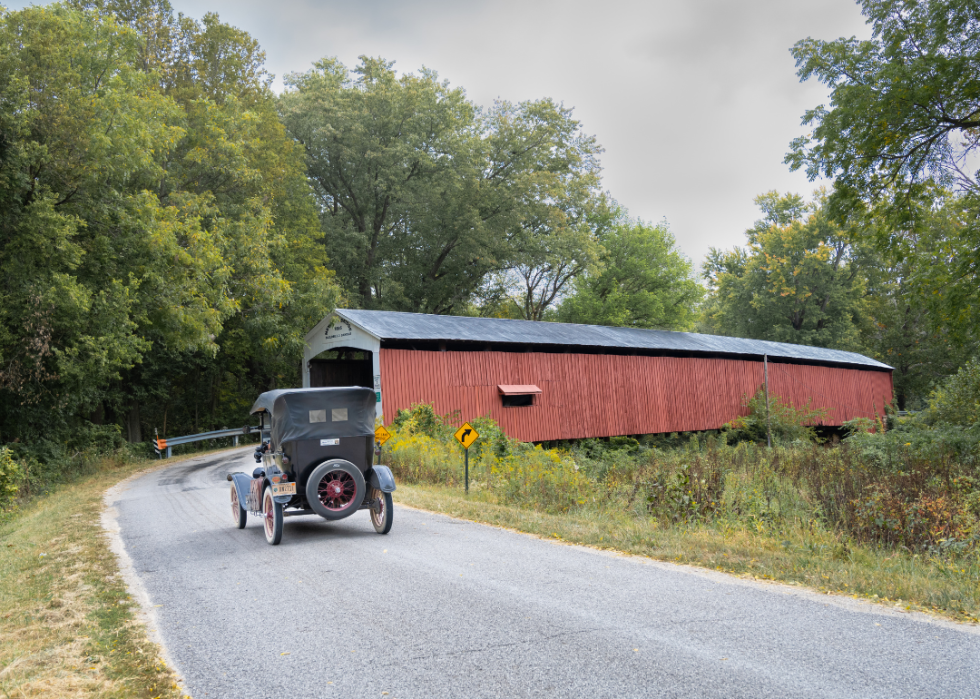
- Death rate for ischemic strokes, 2018-20: 43.8 per 100K people
- Death rate for hemorrhagic strokes, 2018-20: 10.5 per 100K people
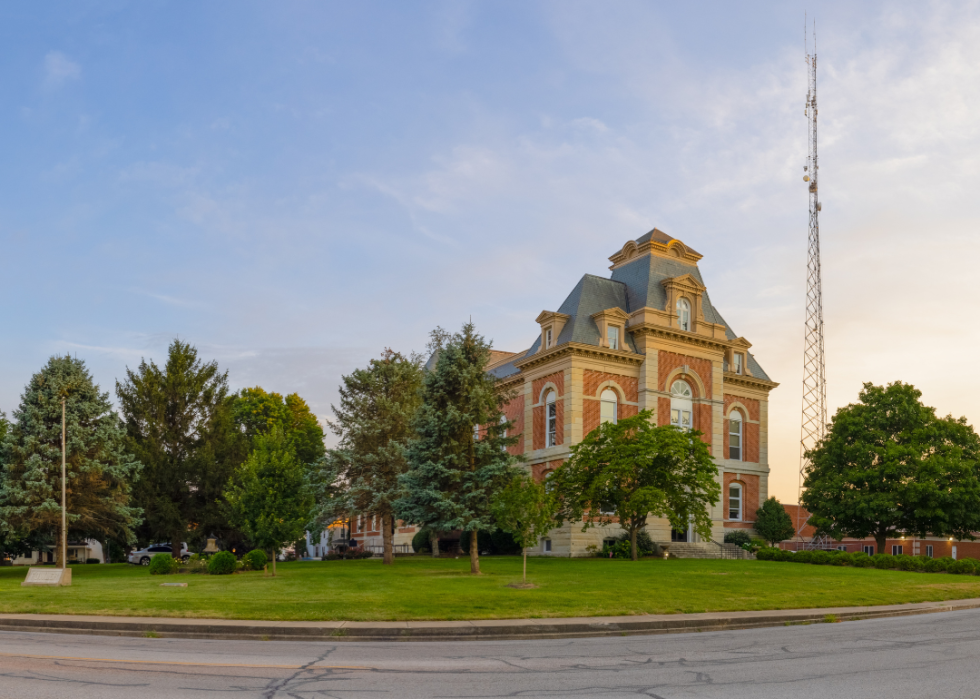
- Death rate for ischemic strokes, 2018-20: 15.4 per 100K people
- Death rate for hemorrhagic strokes, 2018-20: 9.5 per 100K people
You may also like: Zip codes with the most expensive homes in Indiana

- Death rate for ischemic strokes, 2018-20: 15.9 per 100K people
- Death rate for hemorrhagic strokes, 2018-20: 9.9 per 100K people

- Death rate for ischemic strokes, 2018-20: 18.7 per 100K people
- Death rate for hemorrhagic strokes, 2018-20: 9.8 per 100K people

- Death rate for ischemic strokes, 2018-20: 19.2 per 100K people
- Death rate for hemorrhagic strokes, 2018-20: 10.7 per 100K people

- Death rate for ischemic strokes, 2018-20: 20.1 per 100K people
- Death rate for hemorrhagic strokes, 2018-20: 9.8 per 100K people

- Death rate for ischemic strokes, 2018-20: 21.0 per 100K people
- Death rate for hemorrhagic strokes, 2018-20: 10.1 per 100K people
You may also like: Highest rated IPAs in Indiana

- Death rate for ischemic strokes, 2018-20: 21.1 per 100K people
- Death rate for hemorrhagic strokes, 2018-20: 10.5 per 100K people

- Death rate for ischemic strokes, 2018-20: 21.4 per 100K people
- Death rate for hemorrhagic strokes, 2018-20: 11.0 per 100K people

- Death rate for ischemic strokes, 2018-20: 24.7 per 100K people
- Death rate for hemorrhagic strokes, 2018-20: 9.8 per 100K people

- Death rate for ischemic strokes, 2018-20: 24.7 per 100K people
- Death rate for hemorrhagic strokes, 2018-20: 11.3 per 100K people

- Death rate for ischemic strokes, 2018-20: 25.4 per 100K people
- Death rate for hemorrhagic strokes, 2018-20: 8.2 per 100K people
You may also like: Highest NFL draft picks from Indiana

- Death rate for ischemic strokes, 2018-20: 28.1 per 100K people
- Death rate for hemorrhagic strokes, 2018-20: 9.5 per 100K people
- Death rate for ischemic strokes, 2018-20: 18.7 per 100K people
- Death rate for hemorrhagic strokes, 2018-20: 8.6 per 100K people

- Death rate for ischemic strokes, 2018-20: 18.8 per 100K people
- Death rate for hemorrhagic strokes, 2018-20: 9.7 per 100K people

- Death rate for ischemic strokes, 2018-20: 19.2 per 100K people
- Death rate for hemorrhagic strokes, 2018-20: 11.4 per 100K people
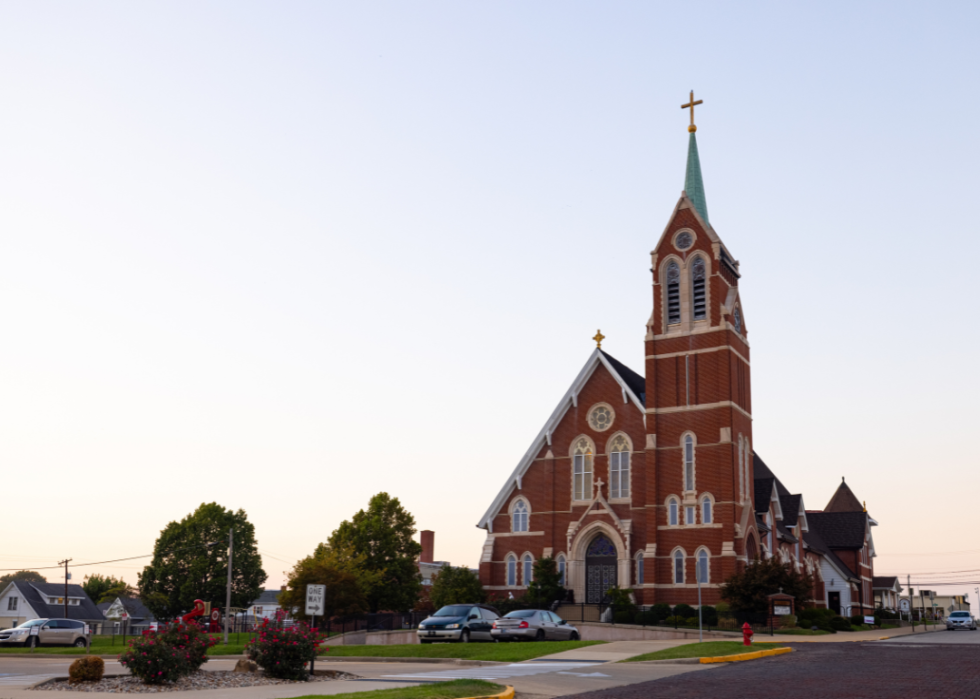
- Death rate for ischemic strokes, 2018-20: 21.8 per 100K people
- Death rate for hemorrhagic strokes, 2018-20: 11.0 per 100K people
You may also like: A state desegregates early: A major civil rights moment in Indiana
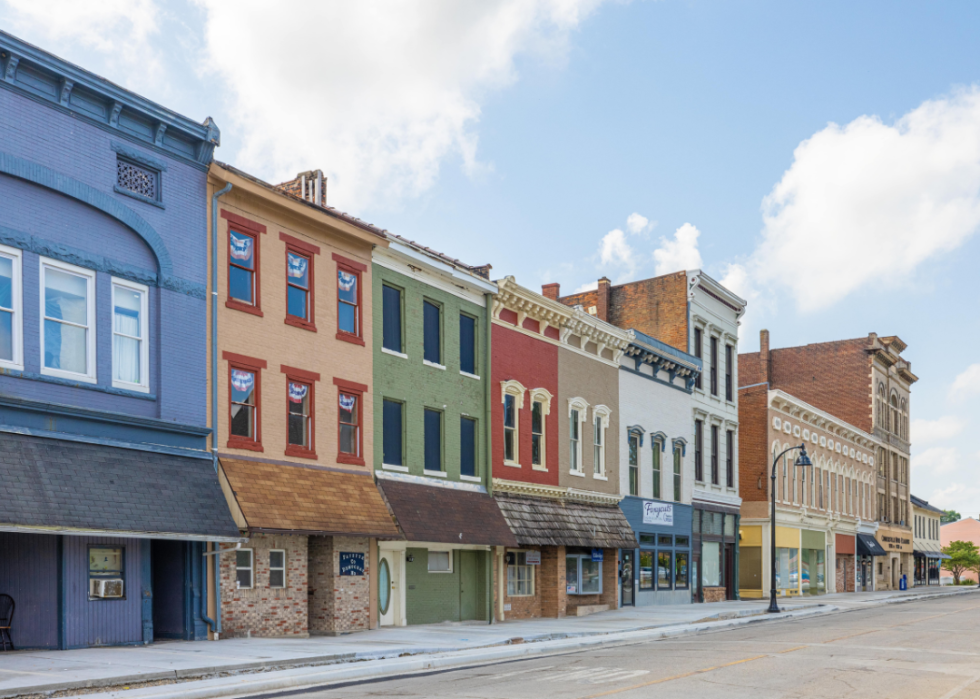
- Death rate for ischemic strokes, 2018-20: 22.7 per 100K people
- Death rate for hemorrhagic strokes, 2018-20: 9.5 per 100K people

- Death rate for ischemic strokes, 2018-20: 25.4 per 100K people
- Death rate for hemorrhagic strokes, 2018-20: 13.1 per 100K people
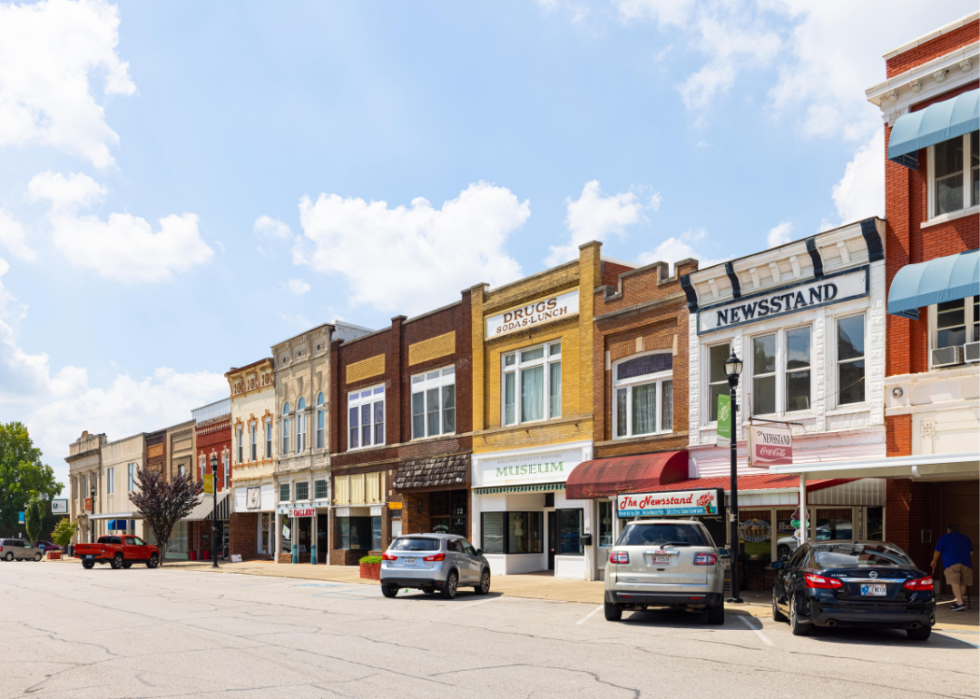
- Death rate for ischemic strokes, 2018-20: 27.8 per 100K people
- Death rate for hemorrhagic strokes, 2018-20: 9.8 per 100K people

- Death rate for ischemic strokes, 2018-20: 24.6 per 100K people
- Death rate for hemorrhagic strokes, 2018-20: 9.9 per 100K people

- Death rate for ischemic strokes, 2018-20: 25.9 per 100K people
- Death rate for hemorrhagic strokes, 2018-20: 11.3 per 100K people
You may also like: Highest-rated Class of 2022 football recruits from Indiana
This story features data reporting and writing by Emma Rubin and is part of a series utilizing data automation across 49 states.
