Counties with the highest rates of strokes in Iowa
Marsen // Shutterstock
- Age-adjusted rate of all strokes among adults, estimates for 2021: 2.7% (range between 2.3% and 3.0%)
- Death rate for ischemic strokes, 2018-20: 17.3 per 100K people
- Death rate for hemorrhagic strokes, 2018-20: 7.5 per 100K people
- Death rate for ischemic strokes, 2018-20: 17.3 per 100K people
- Death rate for hemorrhagic strokes, 2018-20: 7.5 per 100K people
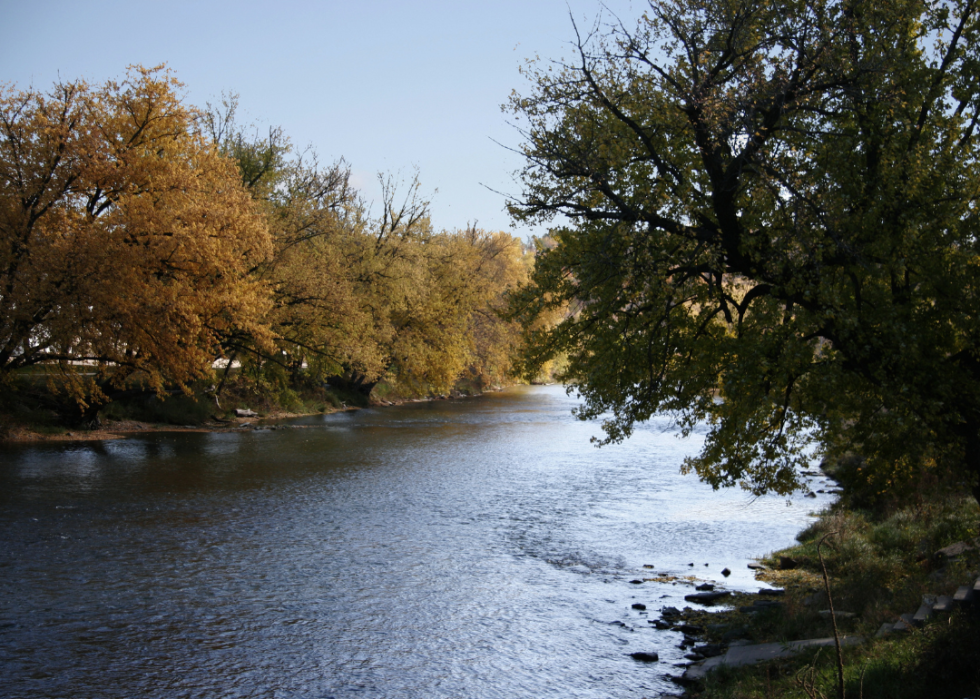
#50. Jones County

Kimberly's Impressions // Shutterstock
- Age-adjusted rate of all strokes among adults, estimates for 2021: 2.7% (range between 2.3% and 3.0%)
- Death rate for ischemic strokes, 2018-20: 17.3 per 100K people
- Death rate for hemorrhagic strokes, 2018-20: 11.3 per 100K people
- Death rate for ischemic strokes, 2018-20: 17.3 per 100K people
- Death rate for hemorrhagic strokes, 2018-20: 11.3 per 100K people
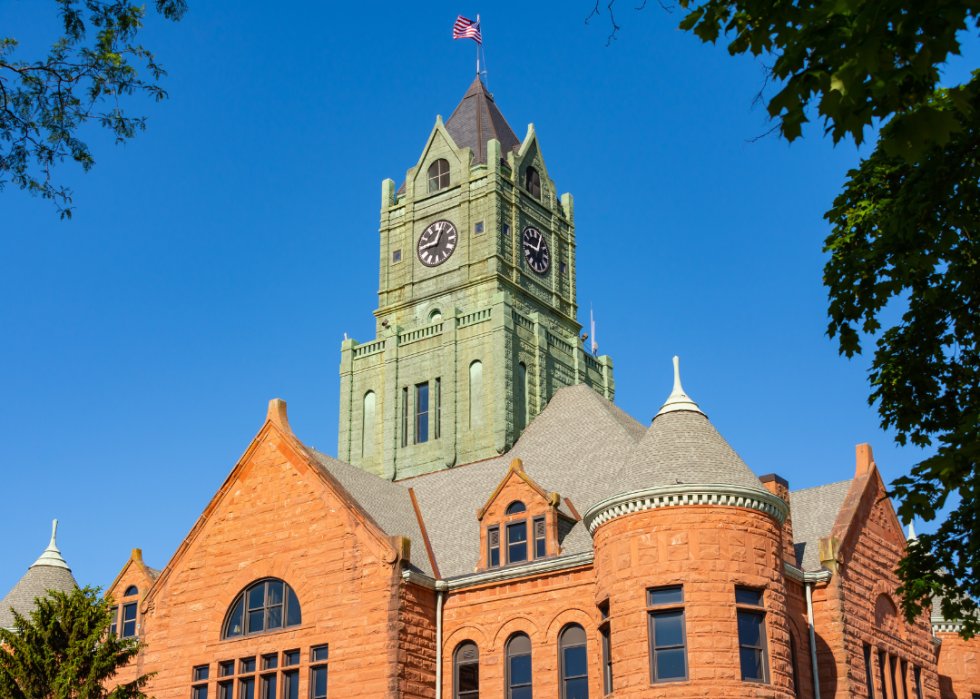
#49. Taylor County
Canva
- Age-adjusted rate of all strokes among adults, estimates for 2021: 2.7% (range between 2.4% and 3.1%)
- Death rate for ischemic strokes, 2018-20: 17.7 per 100K people
- Death rate for hemorrhagic strokes, 2018-20: 9.4 per 100K people
- Death rate for ischemic strokes, 2018-20: 17.7 per 100K people
- Death rate for hemorrhagic strokes, 2018-20: 9.4 per 100K people
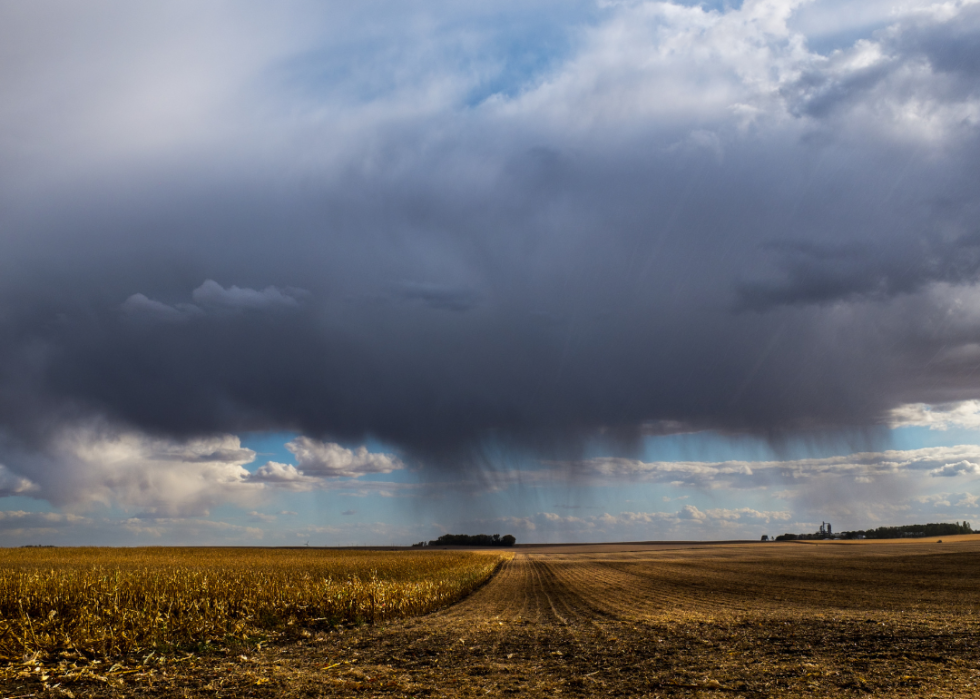
#48. Pottawattamie County

Canva
- Age-adjusted rate of all strokes among adults, estimates for 2021: 2.7% (range between 2.4% and 3.0%)
- Death rate for ischemic strokes, 2018-20: 17.9 per 100K people
- Death rate for hemorrhagic strokes, 2018-20: 8.0 per 100K people
- Death rate for ischemic strokes, 2018-20: 17.9 per 100K people
- Death rate for hemorrhagic strokes, 2018-20: 8.0 per 100K people
#47. Fremont County
Suzanne Tucker // Shutterstock
- Age-adjusted rate of all strokes among adults, estimates for 2021: 2.7% (range between 2.3% and 3.0%)
- Death rate for ischemic strokes, 2018-20: 18.1 per 100K people
- Death rate for hemorrhagic strokes, 2018-20: 8.7 per 100K people
- Death rate for ischemic strokes, 2018-20: 18.1 per 100K people
- Death rate for hemorrhagic strokes, 2018-20: 8.7 per 100K people
You may also like: Best colleges in Iowa
#46. Audubon County

farmer doug // Shutterstock
- Age-adjusted rate of all strokes among adults, estimates for 2021: 2.7% (range between 2.4% and 3.1%)
- Death rate for ischemic strokes, 2018-20: 18.1 per 100K people
- Death rate for hemorrhagic strokes, 2018-20: 10.5 per 100K people
- Death rate for ischemic strokes, 2018-20: 18.1 per 100K people
- Death rate for hemorrhagic strokes, 2018-20: 10.5 per 100K people
#45. Ida County
Gabe Shakour // Shutterstock
- Age-adjusted rate of all strokes among adults, estimates for 2021: 2.7% (range between 2.4% and 3.1%)
- Death rate for ischemic strokes, 2018-20: 18.6 per 100K people
- Death rate for hemorrhagic strokes, 2018-20: 9.4 per 100K people
- Death rate for ischemic strokes, 2018-20: 18.6 per 100K people
- Death rate for hemorrhagic strokes, 2018-20: 9.4 per 100K people
#44. Osceola County
SevenMaps // Shutterstock
- Age-adjusted rate of all strokes among adults, estimates for 2021: 2.7% (range between 2.3% and 3.1%)
- Death rate for ischemic strokes, 2018-20: 19.1 per 100K people
- Death rate for hemorrhagic strokes, 2018-20: 7.9 per 100K people
- Death rate for ischemic strokes, 2018-20: 19.1 per 100K people
- Death rate for hemorrhagic strokes, 2018-20: 7.9 per 100K people
#43. Howard County
dustin77a // Shutterstock
- Age-adjusted rate of all strokes among adults, estimates for 2021: 2.7% (range between 2.4% and 3.1%)
- Death rate for ischemic strokes, 2018-20: 19.4 per 100K people
- Death rate for hemorrhagic strokes, 2018-20: 8.8 per 100K people
- Death rate for ischemic strokes, 2018-20: 19.4 per 100K people
- Death rate for hemorrhagic strokes, 2018-20: 8.8 per 100K people
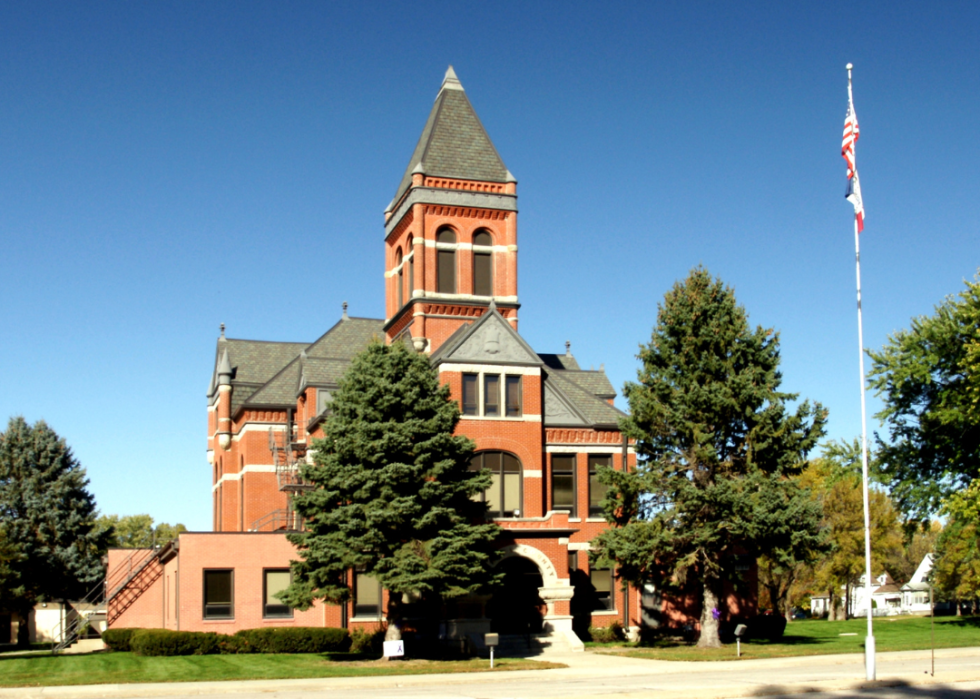
#42. Greene County

Canva
- Age-adjusted rate of all strokes among adults, estimates for 2021: 2.7% (range between 2.4% and 3.1%)
- Death rate for ischemic strokes, 2018-20: 20.1 per 100K people
- Death rate for hemorrhagic strokes, 2018-20: 7.7 per 100K people
- Death rate for ischemic strokes, 2018-20: 20.1 per 100K people
- Death rate for hemorrhagic strokes, 2018-20: 7.7 per 100K people
You may also like: Colleges with the best ROI in Iowa
#41. Jackson County
Kelsey Haugen // Shutterstock
- Age-adjusted rate of all strokes among adults, estimates for 2021: 2.7% (range between 2.4% and 3.1%)
- Death rate for ischemic strokes, 2018-20: 20.2 per 100K people
- Death rate for hemorrhagic strokes, 2018-20: 12.0 per 100K people
- Death rate for ischemic strokes, 2018-20: 20.2 per 100K people
- Death rate for hemorrhagic strokes, 2018-20: 12.0 per 100K people
#40. Union County

Robert O Hull // Shutterstock
- Age-adjusted rate of all strokes among adults, estimates for 2021: 2.7% (range between 2.4% and 3.1%)
- Death rate for ischemic strokes, 2018-20: 20.3 per 100K people
- Death rate for hemorrhagic strokes, 2018-20: 11.0 per 100K people
- Death rate for ischemic strokes, 2018-20: 20.3 per 100K people
- Death rate for hemorrhagic strokes, 2018-20: 11.0 per 100K people
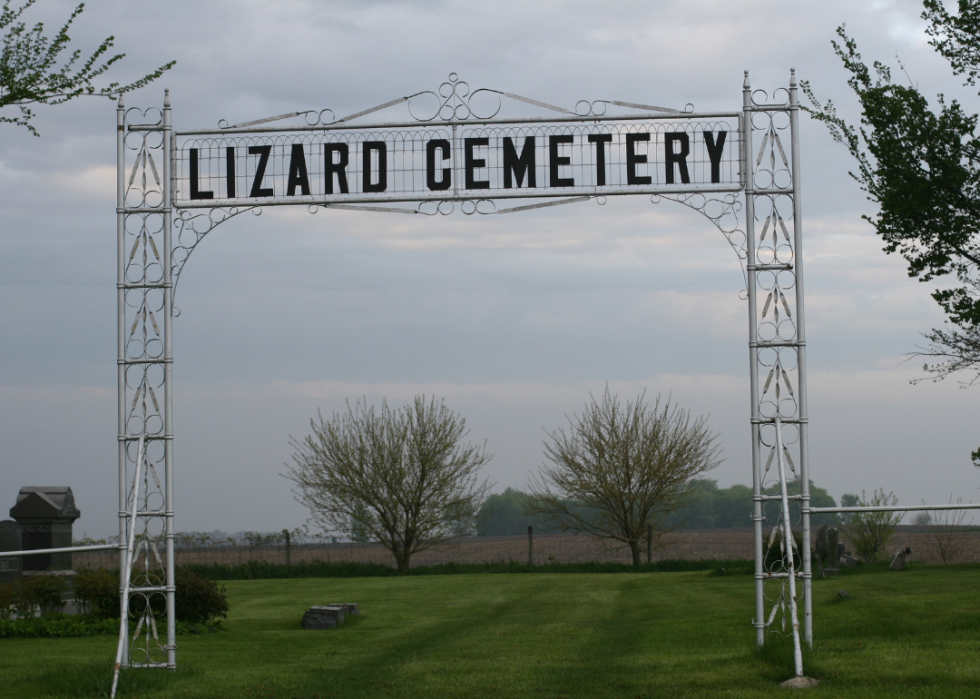
#39. Calhoun County

PICTOR PICTURES // Shutterstock
- Age-adjusted rate of all strokes among adults, estimates for 2021: 2.7% (range between 2.3% and 3.1%)
- Death rate for ischemic strokes, 2018-20: 23.2 per 100K people
- Death rate for hemorrhagic strokes, 2018-20: 8.3 per 100K people
- Death rate for ischemic strokes, 2018-20: 23.2 per 100K people
- Death rate for hemorrhagic strokes, 2018-20: 8.3 per 100K people
#38. Henry County

stivanderson // Shutterstock
- Age-adjusted rate of all strokes among adults, estimates for 2021: 2.7% (range between 2.3% and 3.1%)
- Death rate for ischemic strokes, 2018-20: 23.3 per 100K people
- Death rate for hemorrhagic strokes, 2018-20: 8.6 per 100K people
- Death rate for ischemic strokes, 2018-20: 23.3 per 100K people
- Death rate for hemorrhagic strokes, 2018-20: 8.6 per 100K people
#37. Jefferson County
SevenMaps // Shutterstock
- Age-adjusted rate of all strokes among adults, estimates for 2021: 2.8% (range between 2.5% and 3.2%)
- Death rate for ischemic strokes, 2018-20: 14.2 per 100K people
- Death rate for hemorrhagic strokes, 2018-20: 11.0 per 100K people
- Death rate for ischemic strokes, 2018-20: 14.2 per 100K people
- Death rate for hemorrhagic strokes, 2018-20: 11.0 per 100K people
You may also like: Counties most concerned about climate change in Iowa
#36. Franklin County
Joel McCartan // Shutterstock
- Age-adjusted rate of all strokes among adults, estimates for 2021: 2.8% (range between 2.4% and 3.2%)
- Death rate for ischemic strokes, 2018-20: 16.5 per 100K people
- Death rate for hemorrhagic strokes, 2018-20: 8.5 per 100K people
- Death rate for ischemic strokes, 2018-20: 16.5 per 100K people
- Death rate for hemorrhagic strokes, 2018-20: 8.5 per 100K people
#35. O'Brien County
Canva
- Age-adjusted rate of all strokes among adults, estimates for 2021: 2.8% (range between 2.5% and 3.1%)
- Death rate for ischemic strokes, 2018-20: 16.5 per 100K people
- Death rate for hemorrhagic strokes, 2018-20: 8.9 per 100K people
- Death rate for ischemic strokes, 2018-20: 16.5 per 100K people
- Death rate for hemorrhagic strokes, 2018-20: 8.9 per 100K people
#34. Black Hawk County
Canva
- Age-adjusted rate of all strokes among adults, estimates for 2021: 2.8% (range between 2.5% and 3.2%)
- Death rate for ischemic strokes, 2018-20: 16.9 per 100K people
- Death rate for hemorrhagic strokes, 2018-20: 11.5 per 100K people
- Death rate for ischemic strokes, 2018-20: 16.9 per 100K people
- Death rate for hemorrhagic strokes, 2018-20: 11.5 per 100K people
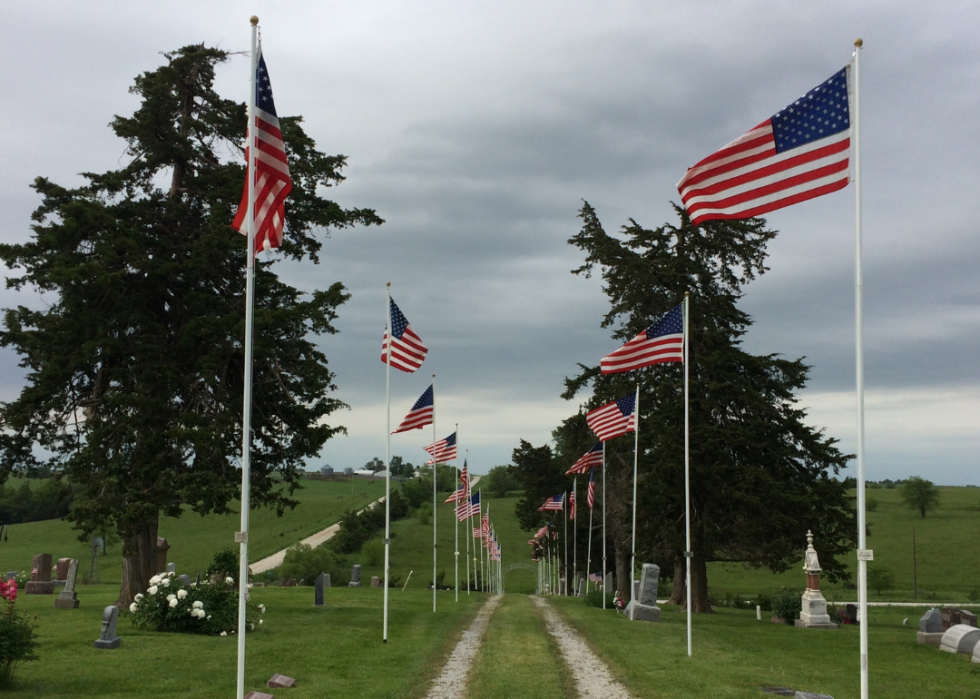
#33. Wright County
Jonathan Park // Shutterstock
- Age-adjusted rate of all strokes among adults, estimates for 2021: 2.8% (range between 2.4% and 3.2%)
- Death rate for ischemic strokes, 2018-20: 17.0 per 100K people
- Death rate for hemorrhagic strokes, 2018-20: 9.2 per 100K people
- Death rate for ischemic strokes, 2018-20: 17.0 per 100K people
- Death rate for hemorrhagic strokes, 2018-20: 9.2 per 100K people
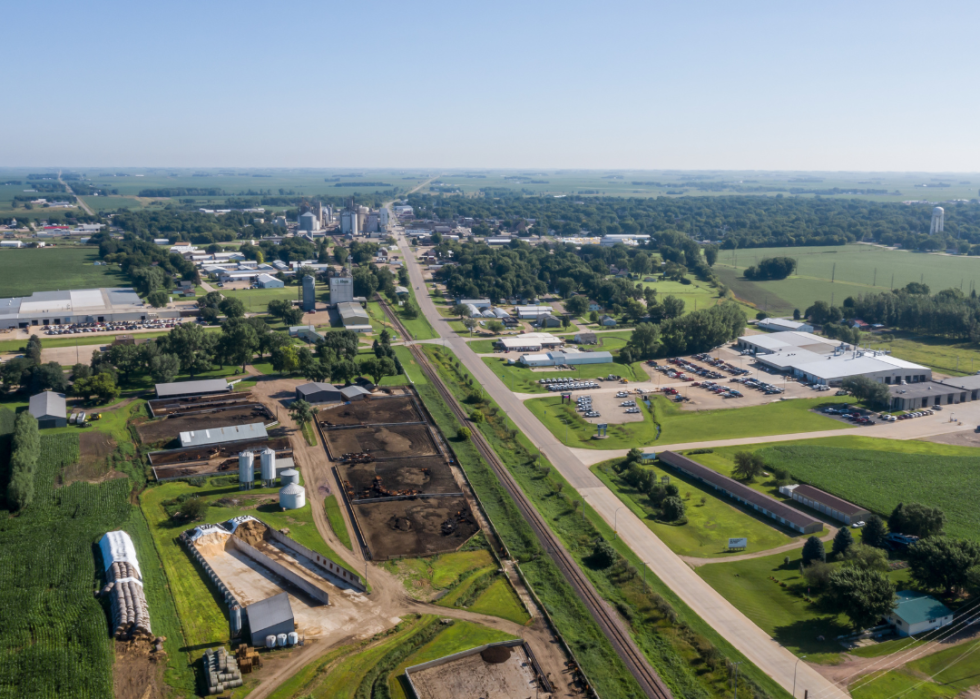
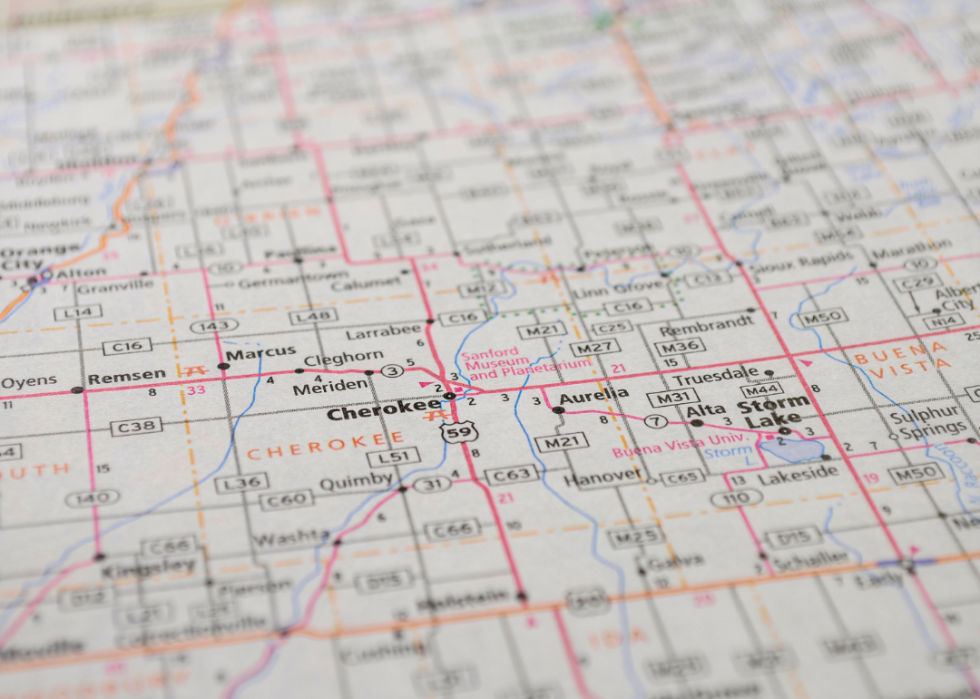
#32. Cherokee County
Eddie J. Rodriquez // Shutterstock
- Age-adjusted rate of all strokes among adults, estimates for 2021: 2.8% (range between 2.4% and 3.1%)
- Death rate for ischemic strokes, 2018-20: 17.3 per 100K people
- Death rate for hemorrhagic strokes, 2018-20: 8.3 per 100K people
- Death rate for ischemic strokes, 2018-20: 17.3 per 100K people
- Death rate for hemorrhagic strokes, 2018-20: 8.3 per 100K people
You may also like: Best school districts in Iowa
#31. Louisa County
dustin77a // Shutterstock
- Age-adjusted rate of all strokes among adults, estimates for 2021: 2.8% (range between 2.5% and 3.2%)
- Death rate for ischemic strokes, 2018-20: 17.9 per 100K people
- Death rate for hemorrhagic strokes, 2018-20: 9.3 per 100K people
- Death rate for ischemic strokes, 2018-20: 17.9 per 100K people
- Death rate for hemorrhagic strokes, 2018-20: 9.3 per 100K people
#30. Cass County
Canva
- Age-adjusted rate of all strokes among adults, estimates for 2021: 2.8% (range between 2.4% and 3.2%)
- Death rate for ischemic strokes, 2018-20: 18.0 per 100K people
- Death rate for hemorrhagic strokes, 2018-20: 7.6 per 100K people
- Death rate for ischemic strokes, 2018-20: 18.0 per 100K people
- Death rate for hemorrhagic strokes, 2018-20: 7.6 per 100K people
#29. Marshall County
Canva
- Age-adjusted rate of all strokes among adults, estimates for 2021: 2.8% (range between 2.4% and 3.1%)
- Death rate for ischemic strokes, 2018-20: 18.7 per 100K people
- Death rate for hemorrhagic strokes, 2018-20: 8.4 per 100K people
- Death rate for ischemic strokes, 2018-20: 18.7 per 100K people
- Death rate for hemorrhagic strokes, 2018-20: 8.4 per 100K people
#28. Allamakee County

Canva
- Age-adjusted rate of all strokes among adults, estimates for 2021: 2.8% (range between 2.5% and 3.2%)
- Death rate for ischemic strokes, 2018-20: 18.7 per 100K people
- Death rate for hemorrhagic strokes, 2018-20: 9.9 per 100K people
- Death rate for ischemic strokes, 2018-20: 18.7 per 100K people
- Death rate for hemorrhagic strokes, 2018-20: 9.9 per 100K people
#27. Woodbury County
Arlen E Breiholz // Shutterstock
- Age-adjusted rate of all strokes among adults, estimates for 2021: 2.8% (range between 2.5% and 3.2%)
- Death rate for ischemic strokes, 2018-20: 19.6 per 100K people
- Death rate for hemorrhagic strokes, 2018-20: 6.4 per 100K people
- Death rate for ischemic strokes, 2018-20: 19.6 per 100K people
- Death rate for hemorrhagic strokes, 2018-20: 6.4 per 100K people
You may also like: Best high schools in Iowa
#26. Clayton County
Eddie J. Rodriquez // Shutterstock
- Age-adjusted rate of all strokes among adults, estimates for 2021: 2.8% (range between 2.4% and 3.1%)
- Death rate for ischemic strokes, 2018-20: 19.8 per 100K people
- Death rate for hemorrhagic strokes, 2018-20: 8.0 per 100K people
- Death rate for ischemic strokes, 2018-20: 19.8 per 100K people
- Death rate for hemorrhagic strokes, 2018-20: 8.0 per 100K people
#25. Clinton County
Joseph Kreiss // Shutterstock
- Age-adjusted rate of all strokes among adults, estimates for 2021: 2.8% (range between 2.4% and 3.2%)
- Death rate for ischemic strokes, 2018-20: 19.8 per 100K people
- Death rate for hemorrhagic strokes, 2018-20: 9.1 per 100K people
- Death rate for ischemic strokes, 2018-20: 19.8 per 100K people
- Death rate for hemorrhagic strokes, 2018-20: 9.1 per 100K people
#24. Emmet County
Canva
- Age-adjusted rate of all strokes among adults, estimates for 2021: 2.8% (range between 2.5% and 3.1%)
- Death rate for ischemic strokes, 2018-20: 20.4 per 100K people
- Death rate for hemorrhagic strokes, 2018-20: 8.9 per 100K people
- Death rate for ischemic strokes, 2018-20: 20.4 per 100K people
- Death rate for hemorrhagic strokes, 2018-20: 8.9 per 100K people
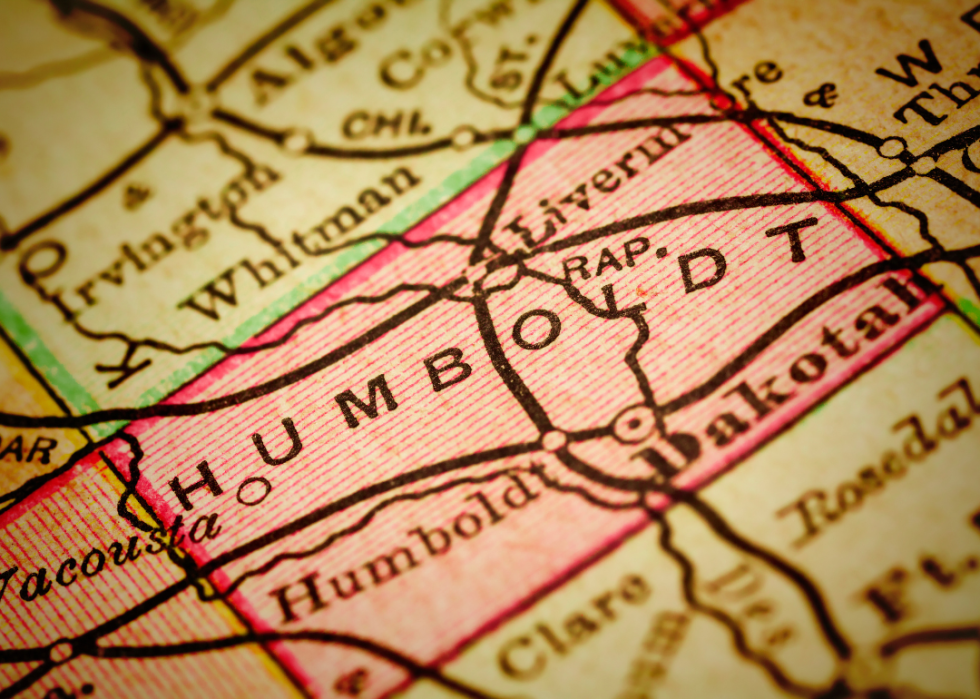
#23. Humboldt County
Canva
- Age-adjusted rate of all strokes among adults, estimates for 2021: 2.8% (range between 2.5% and 3.2%)
- Death rate for ischemic strokes, 2018-20: 20.4 per 100K people
- Death rate for hemorrhagic strokes, 2018-20: 10.6 per 100K people
- Death rate for ischemic strokes, 2018-20: 20.4 per 100K people
- Death rate for hemorrhagic strokes, 2018-20: 10.6 per 100K people
#22. Monona County
Canva
- Age-adjusted rate of all strokes among adults, estimates for 2021: 2.8% (range between 2.5% and 3.2%)
- Death rate for ischemic strokes, 2018-20: 20.5 per 100K people
- Death rate for hemorrhagic strokes, 2018-20: 10.0 per 100K people
- Death rate for ischemic strokes, 2018-20: 20.5 per 100K people
- Death rate for hemorrhagic strokes, 2018-20: 10.0 per 100K people
You may also like: Fastest-growing counties in Iowa
#21. Pocahontas County
Life Atlas Photography // Shutterstock
- Age-adjusted rate of all strokes among adults, estimates for 2021: 2.8% (range between 2.4% and 3.2%)
- Death rate for ischemic strokes, 2018-20: 20.8 per 100K people
- Death rate for hemorrhagic strokes, 2018-20: 13.7 per 100K people
- Death rate for ischemic strokes, 2018-20: 20.8 per 100K people
- Death rate for hemorrhagic strokes, 2018-20: 13.7 per 100K people
#20. Ringgold County
Eddie J. Rodriquez // Shutterstock
- Age-adjusted rate of all strokes among adults, estimates for 2021: 2.8% (range between 2.5% and 3.2%)
- Death rate for ischemic strokes, 2018-20: 22.7 per 100K people
- Death rate for hemorrhagic strokes, 2018-20: 9.3 per 100K people
- Death rate for ischemic strokes, 2018-20: 22.7 per 100K people
- Death rate for hemorrhagic strokes, 2018-20: 9.3 per 100K people
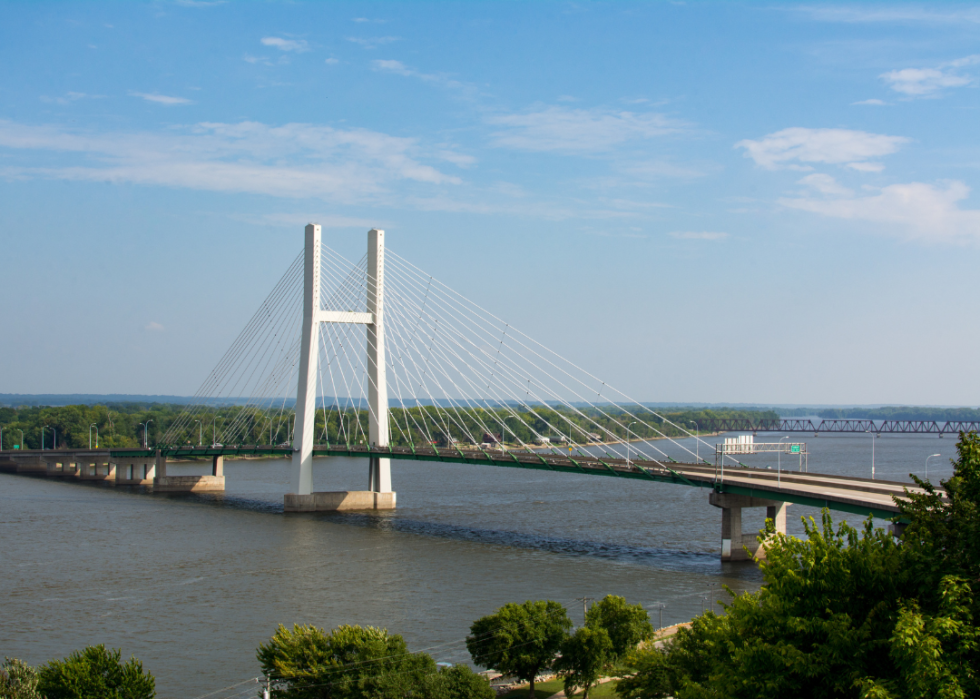
#19. Des Moines County
Canva
- Age-adjusted rate of all strokes among adults, estimates for 2021: 2.8% (range between 2.4% and 3.2%)
- Death rate for ischemic strokes, 2018-20: 23.4 per 100K people
- Death rate for hemorrhagic strokes, 2018-20: 9.3 per 100K people
- Death rate for ischemic strokes, 2018-20: 23.4 per 100K people
- Death rate for hemorrhagic strokes, 2018-20: 9.3 per 100K people
#18. Mahaska County

Canva
- Age-adjusted rate of all strokes among adults, estimates for 2021: 2.8% (range between 2.5% and 3.2%)
- Death rate for ischemic strokes, 2018-20: 24.2 per 100K people
- Death rate for hemorrhagic strokes, 2018-20: 7.8 per 100K people
- Death rate for ischemic strokes, 2018-20: 24.2 per 100K people
- Death rate for hemorrhagic strokes, 2018-20: 7.8 per 100K people
#17. Keokuk County
Canva
- Age-adjusted rate of all strokes among adults, estimates for 2021: 2.8% (range between 2.5% and 3.2%)
- Death rate for ischemic strokes, 2018-20: 24.8 per 100K people
- Death rate for hemorrhagic strokes, 2018-20: 8.9 per 100K people
- Death rate for ischemic strokes, 2018-20: 24.8 per 100K people
- Death rate for hemorrhagic strokes, 2018-20: 8.9 per 100K people
You may also like: Countries Iowa exports the most goods to
#16. Lee County
SevenMaps // Shutterstock
- Age-adjusted rate of all strokes among adults, estimates for 2021: 2.9% (range between 2.5% and 3.2%)
- Death rate for ischemic strokes, 2018-20: 17.1 per 100K people
- Death rate for hemorrhagic strokes, 2018-20: 7.9 per 100K people
- Death rate for ischemic strokes, 2018-20: 17.1 per 100K people
- Death rate for hemorrhagic strokes, 2018-20: 7.9 per 100K people
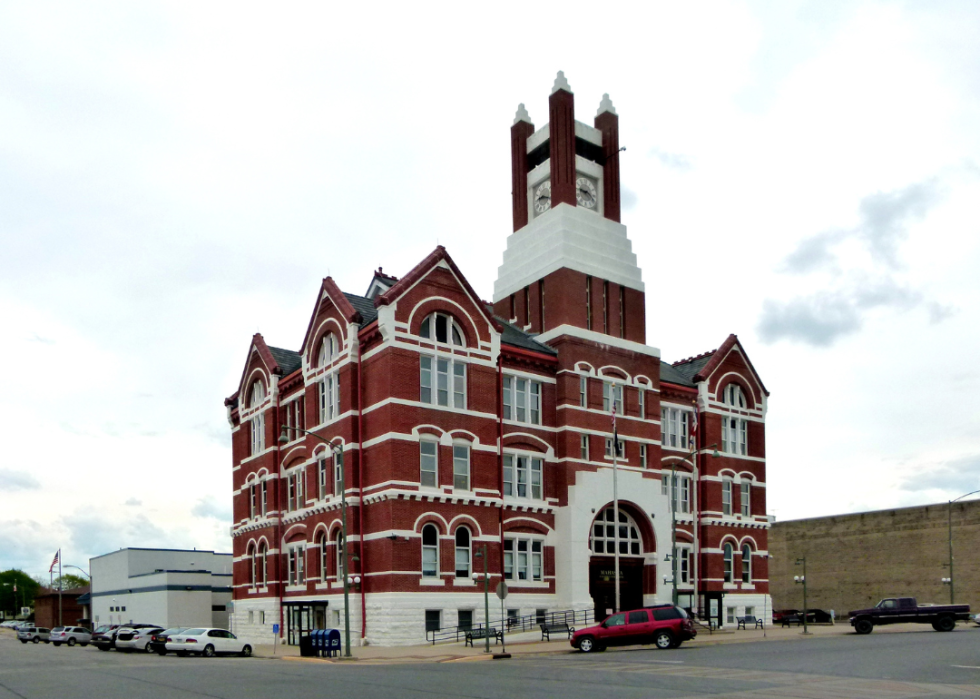
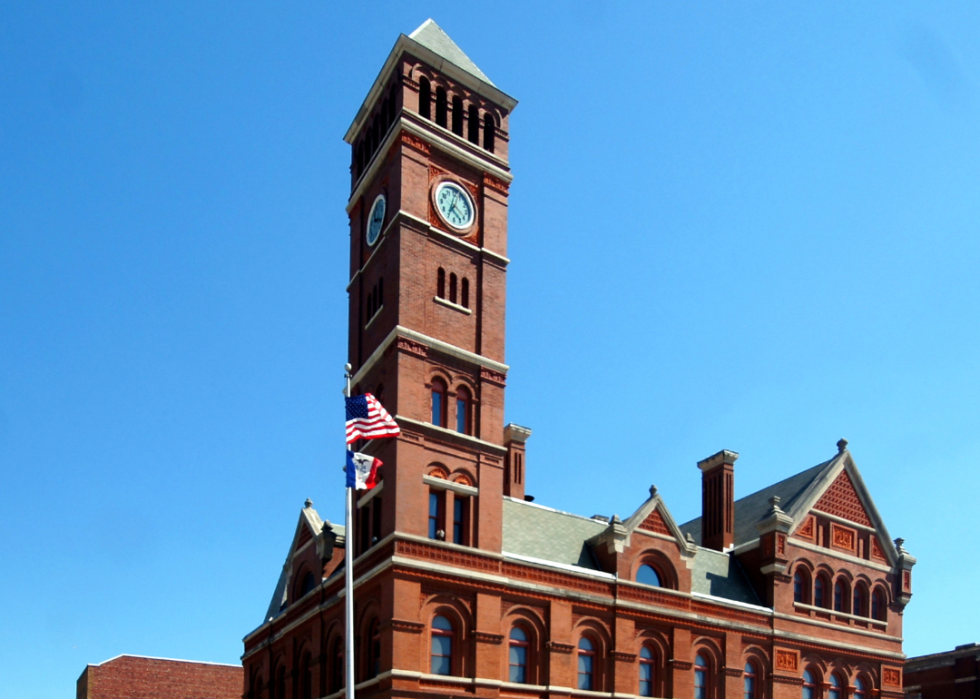
#15. Page County
Lucas Oglesbee // Shutterstock
- Age-adjusted rate of all strokes among adults, estimates for 2021: 2.9% (range between 2.6% and 3.3%)
- Death rate for ischemic strokes, 2018-20: 17.2 per 100K people
- Death rate for hemorrhagic strokes, 2018-20: 8.3 per 100K people
- Death rate for ischemic strokes, 2018-20: 17.2 per 100K people
- Death rate for hemorrhagic strokes, 2018-20: 8.3 per 100K people
#14. Tama County
Kuehner // Shutterstock
- Age-adjusted rate of all strokes among adults, estimates for 2021: 2.9% (range between 2.5% and 3.2%)
- Death rate for ischemic strokes, 2018-20: 18.2 per 100K people
- Death rate for hemorrhagic strokes, 2018-20: 8.3 per 100K people
- Death rate for ischemic strokes, 2018-20: 18.2 per 100K people
- Death rate for hemorrhagic strokes, 2018-20: 8.3 per 100K people
#13. Fayette County
Naw Eh Wah // Shutterstock
- Age-adjusted rate of all strokes among adults, estimates for 2021: 2.9% (range between 2.5% and 3.3%)
- Death rate for ischemic strokes, 2018-20: 18.3 per 100K people
- Death rate for hemorrhagic strokes, 2018-20: 8.8 per 100K people
- Death rate for ischemic strokes, 2018-20: 18.3 per 100K people
- Death rate for hemorrhagic strokes, 2018-20: 8.8 per 100K people
#12. Buena Vista County

SevenMaps // Shutterstock
- Age-adjusted rate of all strokes among adults, estimates for 2021: 2.9% (range between 2.5% and 3.3%)
- Death rate for ischemic strokes, 2018-20: 18.5 per 100K people
- Death rate for hemorrhagic strokes, 2018-20: 9.1 per 100K people
- Death rate for ischemic strokes, 2018-20: 18.5 per 100K people
- Death rate for hemorrhagic strokes, 2018-20: 9.1 per 100K people
You may also like: Counties with the lowest home prices in Iowa
#11. Montgomery County
Canva
- Age-adjusted rate of all strokes among adults, estimates for 2021: 2.9% (range between 2.5% and 3.3%)
- Death rate for ischemic strokes, 2018-20: 22.2 per 100K people
- Death rate for hemorrhagic strokes, 2018-20: 12.9 per 100K people
- Death rate for ischemic strokes, 2018-20: 22.2 per 100K people
- Death rate for hemorrhagic strokes, 2018-20: 12.9 per 100K people
#10. Webster County
J Sanderman // Shutterstock
- Age-adjusted rate of all strokes among adults, estimates for 2021: 2.9% (range between 2.5% and 3.3%)
- Death rate for ischemic strokes, 2018-20: 23.2 per 100K people
- Death rate for hemorrhagic strokes, 2018-20: 9.1 per 100K people
- Death rate for ischemic strokes, 2018-20: 23.2 per 100K people
- Death rate for hemorrhagic strokes, 2018-20: 9.1 per 100K people
#9. Davis County
Doug Lambert // Shutterstock
- Age-adjusted rate of all strokes among adults, estimates for 2021: 2.9% (range between 2.6% and 3.3%)
- Death rate for ischemic strokes, 2018-20: 23.3 per 100K people
- Death rate for hemorrhagic strokes, 2018-20: 10.1 per 100K people
- Death rate for ischemic strokes, 2018-20: 23.3 per 100K people
- Death rate for hemorrhagic strokes, 2018-20: 10.1 per 100K people
#8. Lucas County
Canva
- Age-adjusted rate of all strokes among adults, estimates for 2021: 2.9% (range between 2.5% and 3.3%)
- Death rate for ischemic strokes, 2018-20: 24.4 per 100K people
- Death rate for hemorrhagic strokes, 2018-20: 13.8 per 100K people
- Death rate for ischemic strokes, 2018-20: 24.4 per 100K people
- Death rate for hemorrhagic strokes, 2018-20: 13.8 per 100K people
#7. Decatur County
Brooke Van Zee // Shutterstock
- Age-adjusted rate of all strokes among adults, estimates for 2021: 2.9% (range between 2.5% and 3.3%)
- Death rate for ischemic strokes, 2018-20: 29.3 per 100K people
- Death rate for hemorrhagic strokes, 2018-20: 10.4 per 100K people
- Death rate for ischemic strokes, 2018-20: 29.3 per 100K people
- Death rate for hemorrhagic strokes, 2018-20: 10.4 per 100K people
You may also like: Counties with the highest rate of food insecurity in Iowa
#6. Wayne County
Rexjaymes // Shutterstock
- Age-adjusted rate of all strokes among adults, estimates for 2021: 3.0% (range between 2.7% and 3.5%)
- Death rate for ischemic strokes, 2018-20: 23.8 per 100K people
- Death rate for hemorrhagic strokes, 2018-20: 8.9 per 100K people
- Death rate for ischemic strokes, 2018-20: 23.8 per 100K people
- Death rate for hemorrhagic strokes, 2018-20: 8.9 per 100K people
#5. Van Buren County

Canva
- Age-adjusted rate of all strokes among adults, estimates for 2021: 3.0% (range between 2.6% and 3.5%)
- Death rate for ischemic strokes, 2018-20: 24.3 per 100K people
- Death rate for hemorrhagic strokes, 2018-20: 9.1 per 100K people
- Death rate for ischemic strokes, 2018-20: 24.3 per 100K people
- Death rate for hemorrhagic strokes, 2018-20: 9.1 per 100K people
#4. Wapello County
Canva
- Age-adjusted rate of all strokes among adults, estimates for 2021: 3.1% (range between 2.7% and 3.5%)
- Death rate for ischemic strokes, 2018-20: 18.7 per 100K people
- Death rate for hemorrhagic strokes, 2018-20: 10.5 per 100K people
- Death rate for ischemic strokes, 2018-20: 18.7 per 100K people
- Death rate for hemorrhagic strokes, 2018-20: 10.5 per 100K people
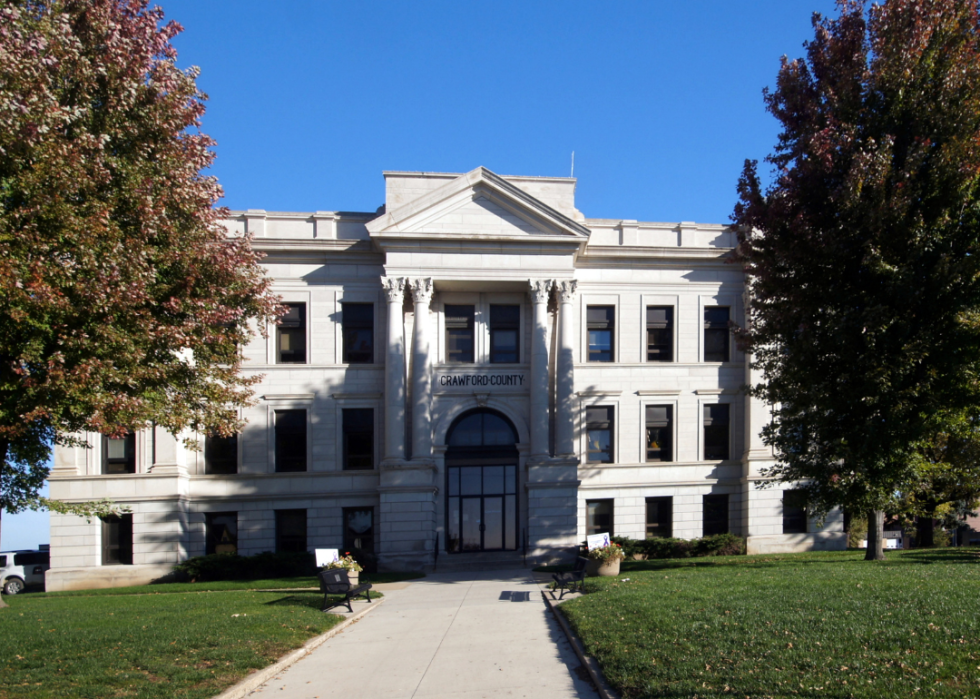
#3. Crawford County
Mary Key // Shutterstock
- Age-adjusted rate of all strokes among adults, estimates for 2021: 3.1% (range between 2.7% and 3.5%)
- Death rate for ischemic strokes, 2018-20: 21.4 per 100K people
- Death rate for hemorrhagic strokes, 2018-20: 12.1 per 100K people
- Death rate for ischemic strokes, 2018-20: 21.4 per 100K people
- Death rate for hemorrhagic strokes, 2018-20: 12.1 per 100K people
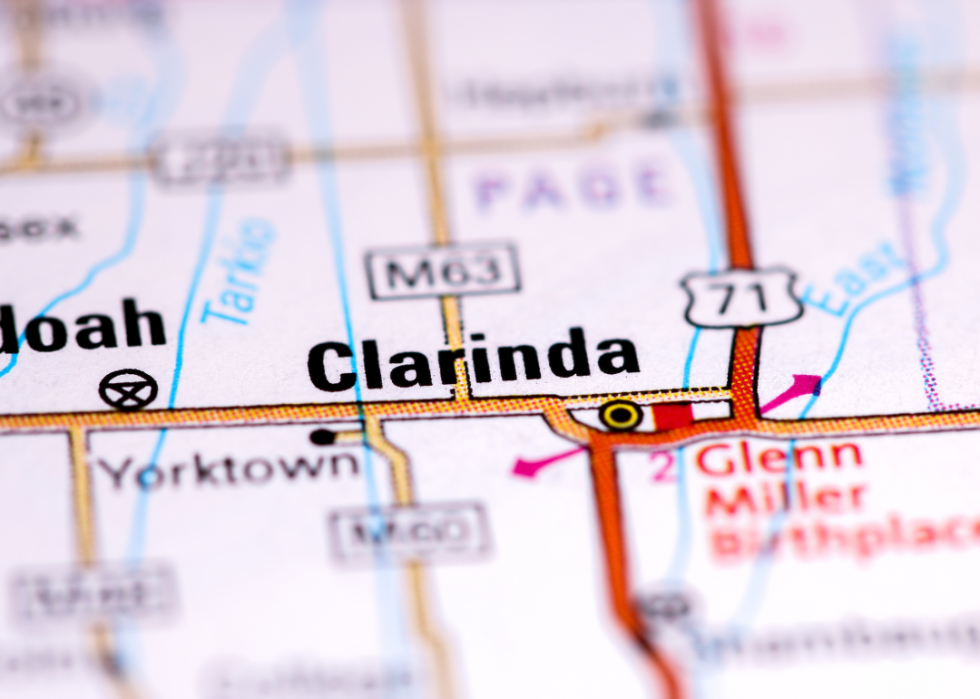
#2. Clarke County
Canva
- Age-adjusted rate of all strokes among adults, estimates for 2021: 3.1% (range between 2.7% and 3.5%)
- Death rate for ischemic strokes, 2018-20: 26.5 per 100K people
- Death rate for hemorrhagic strokes, 2018-20: 10.6 per 100K people
- Death rate for ischemic strokes, 2018-20: 26.5 per 100K people
- Death rate for hemorrhagic strokes, 2018-20: 10.6 per 100K people
You may also like: Best counties to retire to in Iowa
This story features data reporting and writing by Emma Rubin and is part of a series utilizing data automation across 49 states.
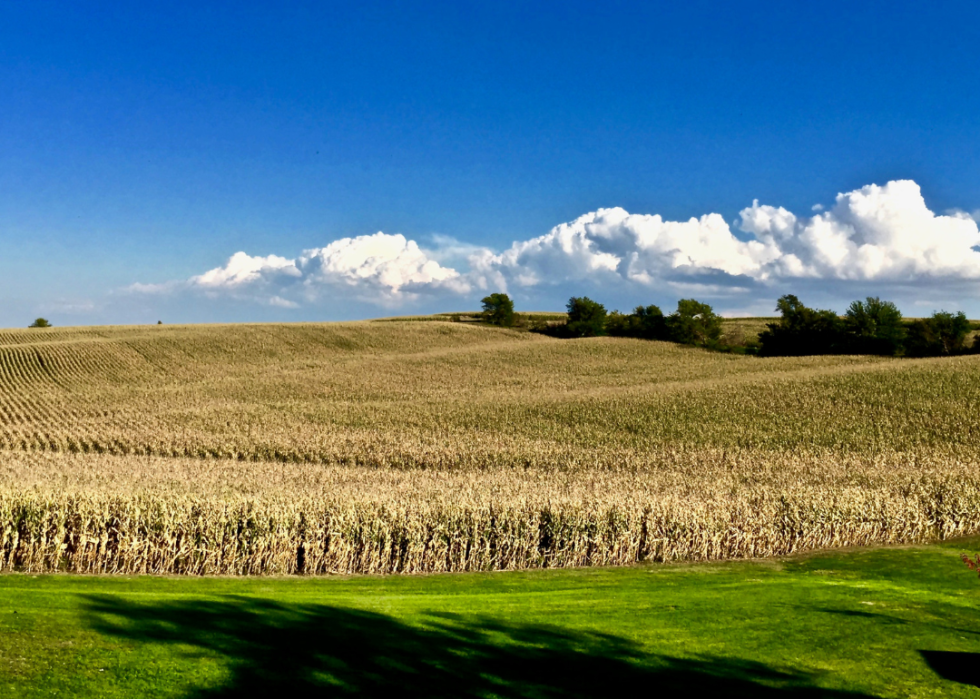
#1. Appanoose County

Canva