Counties with the most tornadoes in Iowa
Stacker

Canva
- Tornadoes since 2000: 15 (2.63 per 100 square miles)
- #663 nationally
- Tornadoes this year, as of May 31: 0
- #663 nationally
- Tornadoes this year, as of May 31: 0
#50. Mahaska County
Rexjaymes // Shutterstock
- Tornadoes since 2000: 13 (2.68 per 100 square miles)
- #639 nationally
- Tornadoes this year, as of May 31: 0
- #639 nationally
- Tornadoes this year, as of May 31: 0
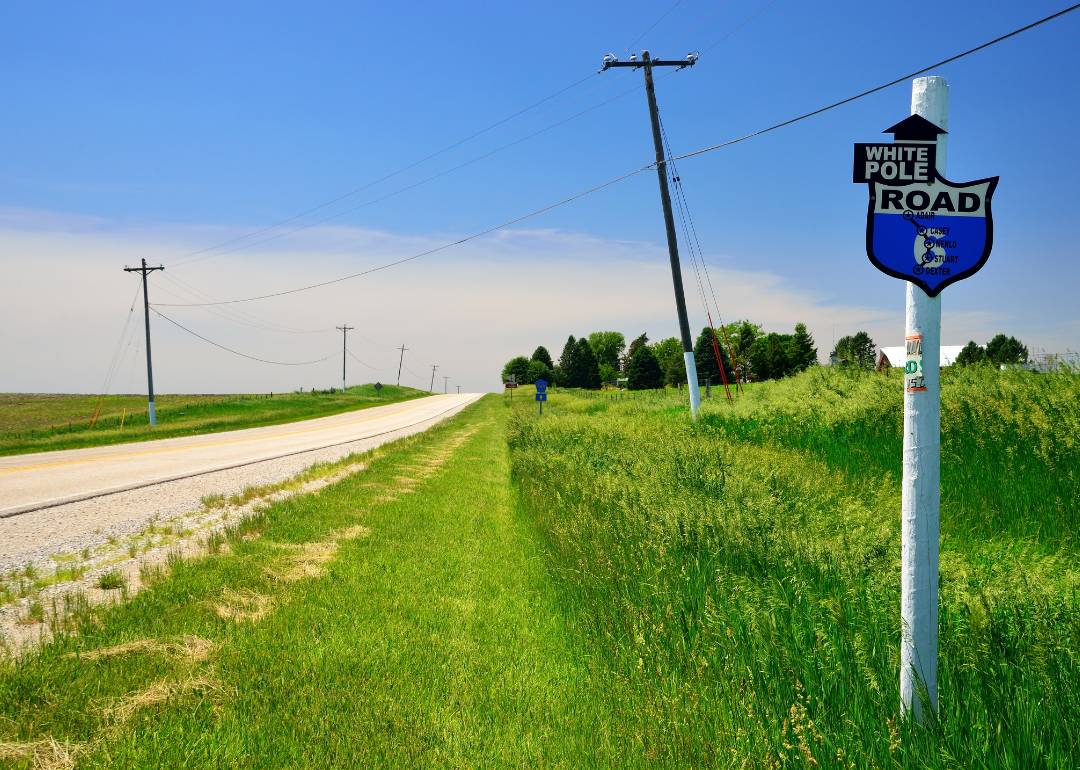
#49. Van Buren County

Canva
- Tornadoes since 2000: 14 (2.71 per 100 square miles)
- #631 nationally
- Tornadoes this year, as of May 31: 0
- #631 nationally
- Tornadoes this year, as of May 31: 0
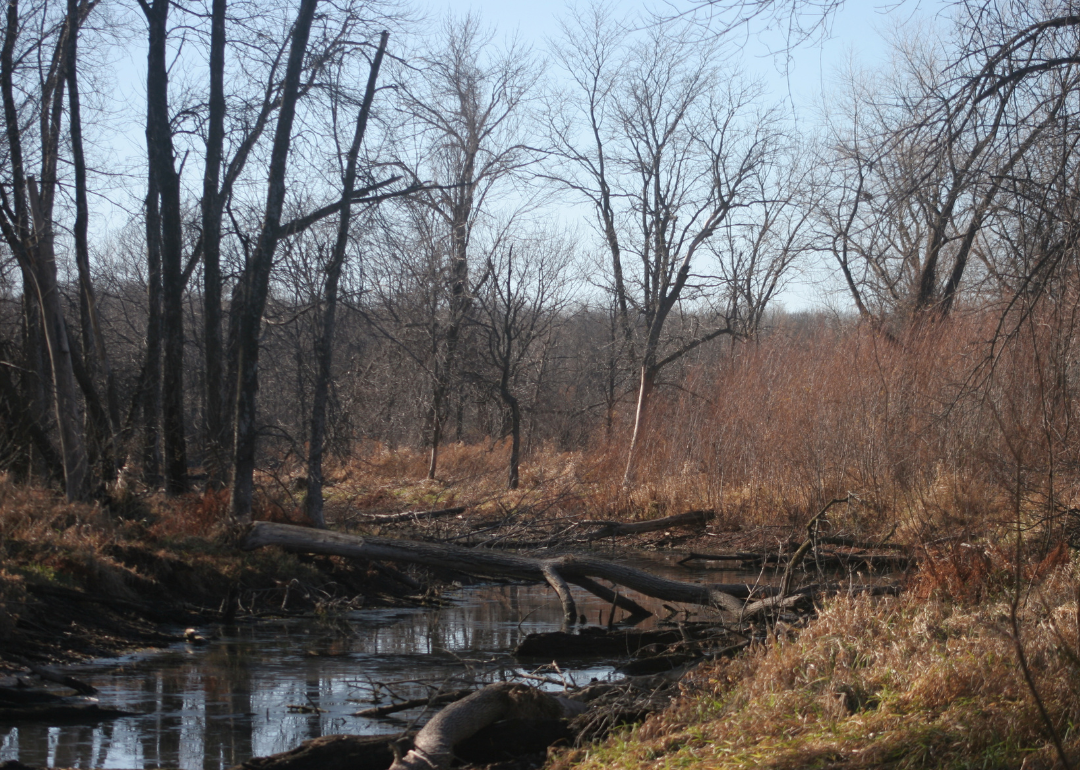
#48. Lee County

Canva
- Tornadoes since 2000: 16 (2.74 per 100 square miles)
- #620 nationally
- Tornadoes this year, as of May 31: 1
- #620 nationally
- Tornadoes this year, as of May 31: 1
#47. Poweshiek County

SevenMaps // Shutterstock
- Tornadoes since 2000: 16 (2.75 per 100 square miles)
- #612 nationally
- Tornadoes this year, as of May 31: 0
- #612 nationally
- Tornadoes this year, as of May 31: 0
#46. Franklin County

Canva
- Tornadoes since 2000: 24 (2.75 per 100 square miles)
- #611 nationally
- Tornadoes this year, as of May 31: 0
- #611 nationally
- Tornadoes this year, as of May 31: 0
#45. Woodbury County
Lucas Oglesbee // Shutterstock
- Tornadoes since 2000: 20 (2.77 per 100 square miles)
- #600 nationally
- Tornadoes this year, as of May 31: 0
- #600 nationally
- Tornadoes this year, as of May 31: 0
#44. Tama County

Naw Eh Wah // Shutterstock
- Tornadoes since 2000: 16 (2.78 per 100 square miles)
- #595 nationally
- Tornadoes this year, as of May 31: 3
- #595 nationally
- Tornadoes this year, as of May 31: 3
#43. Buena Vista County

Canva
- Tornadoes since 2000: 16 (2.81 per 100 square miles)
- #584 nationally
- Tornadoes this year, as of May 31: 0
- #584 nationally
- Tornadoes this year, as of May 31: 0
#42. Adair County

Canva
- Tornadoes since 2000: 17 (2.89 per 100 square miles)
- #549 nationally
- Tornadoes this year, as of May 31: 0
- #549 nationally
- Tornadoes this year, as of May 31: 0
#41. Lyon County

Canva
- Tornadoes since 2000: 17 (2.93 per 100 square miles)
- #536 nationally
- Tornadoes this year, as of May 31: 0
- #536 nationally
- Tornadoes this year, as of May 31: 0
#40. Wright County

Canva
- Tornadoes since 2000: 13 (2.97 per 100 square miles)
- #510 nationally
- Tornadoes this year, as of May 31: 1
- #510 nationally
- Tornadoes this year, as of May 31: 1
#39. Muscatine County
Canva
- Tornadoes since 2000: 13 (2.97 per 100 square miles)
- #509 nationally
- Tornadoes this year, as of May 31: 0
- #509 nationally
- Tornadoes this year, as of May 31: 0
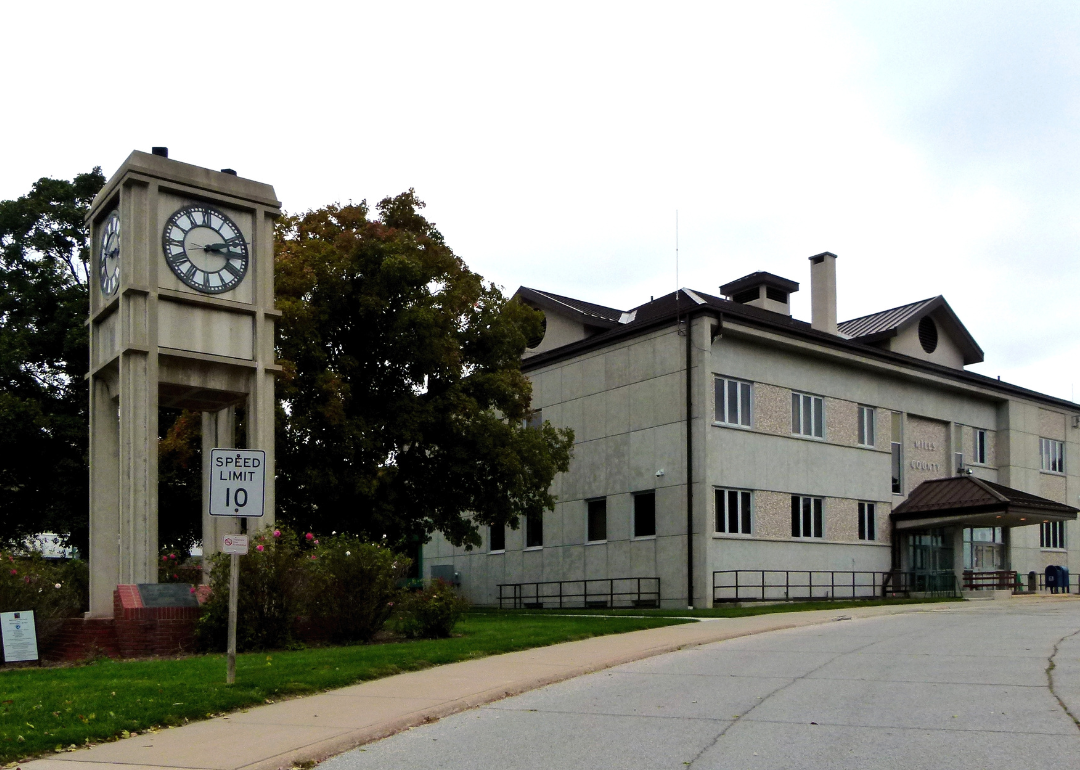
#38. Mills County

Robert O Hull // Shutterstock
- Tornadoes since 2000: 17 (2.98 per 100 square miles)
- #501 nationally
- Tornadoes this year, as of May 31: 2
- #501 nationally
- Tornadoes this year, as of May 31: 2
#37. Calhoun County

Jacob Boomsma // Shutterstock
- Tornadoes since 2000: 17 (2.99 per 100 square miles)
- #500 nationally
- Tornadoes this year, as of May 31: 0
- #500 nationally
- Tornadoes this year, as of May 31: 0
#36. Carroll County
Canva
- Tornadoes since 2000: 13 (2.99 per 100 square miles)
- #497 nationally
- Tornadoes this year, as of May 31: 0
- #497 nationally
- Tornadoes this year, as of May 31: 0
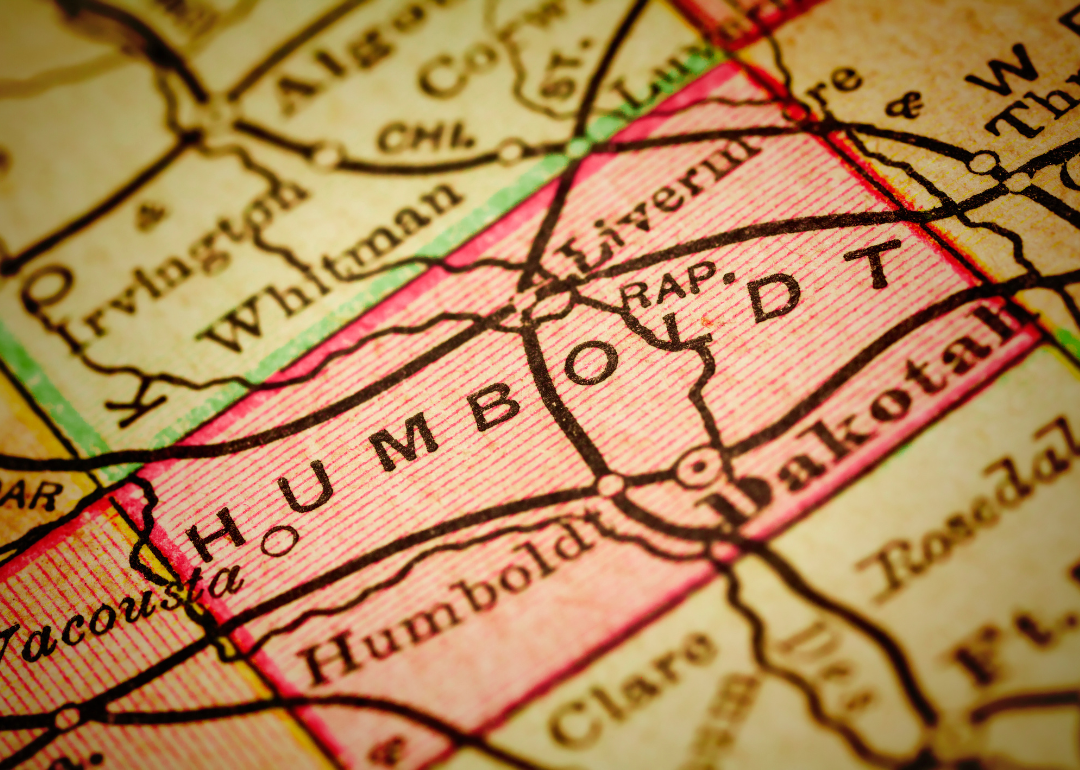
#35. Humboldt County

SevenMaps // Shutterstock
- Tornadoes since 2000: 13 (3.07 per 100 square miles)
- #473 nationally
- Tornadoes this year, as of May 31: 0
- #473 nationally
- Tornadoes this year, as of May 31: 0
#34. Adams County
Designs2Rise // Shutterstock
- Tornadoes since 2000: 18 (3.12 per 100 square miles)
- #458 nationally
- Tornadoes this year, as of May 31: 2
- #458 nationally
- Tornadoes this year, as of May 31: 2
#33. Delaware County

Canva
- Tornadoes since 2000: 24 (3.12 per 100 square miles)
- #452 nationally
- Tornadoes this year, as of May 31: 0
- #452 nationally
- Tornadoes this year, as of May 31: 0
#32. Sioux County
Canva
- Tornadoes since 2000: 23 (3.15 per 100 square miles)
- #441 nationally
- Tornadoes this year, as of May 31: 0
- #441 nationally
- Tornadoes this year, as of May 31: 0
#31. Jasper County

Canva
- Tornadoes since 2000: 18 (3.17 per 100 square miles)
- #433 nationally
- Tornadoes this year, as of May 31: 0
- #433 nationally
- Tornadoes this year, as of May 31: 0
#30. Cerro Gordo County
SevenMaps // Shutterstock
- Tornadoes since 2000: 19 (3.28 per 100 square miles)
- #390 nationally
- Tornadoes this year, as of May 31: 0
- #390 nationally
- Tornadoes this year, as of May 31: 0
#29. Butler County

Eddie J. Rodriquez // Shutterstock
- Tornadoes since 2000: 23 (3.31 per 100 square miles)
- #378 nationally
- Tornadoes this year, as of May 31: 2
- #378 nationally
- Tornadoes this year, as of May 31: 2
#28. Clinton County
Joel McCartan // Shutterstock
- Tornadoes since 2000: 19 (3.32 per 100 square miles)
- #375 nationally
- Tornadoes this year, as of May 31: 0
- #375 nationally
- Tornadoes this year, as of May 31: 0
#27. O'Brien County

Canva
- Tornadoes since 2000: 19 (3.32 per 100 square miles)
- #374 nationally
- Tornadoes this year, as of May 31: 0
- #374 nationally
- Tornadoes this year, as of May 31: 0
#26. Marshall County
Daniel Novak // Shutterstock
- Tornadoes since 2000: 20 (3.39 per 100 square miles)
- #353 nationally
- Tornadoes this year, as of May 31: 0
- #353 nationally
- Tornadoes this year, as of May 31: 0
#25. Guthrie County

Canva
- Tornadoes since 2000: 21 (3.42 per 100 square miles)
- #346 nationally
- Tornadoes this year, as of May 31: 5
- #346 nationally
- Tornadoes this year, as of May 31: 5
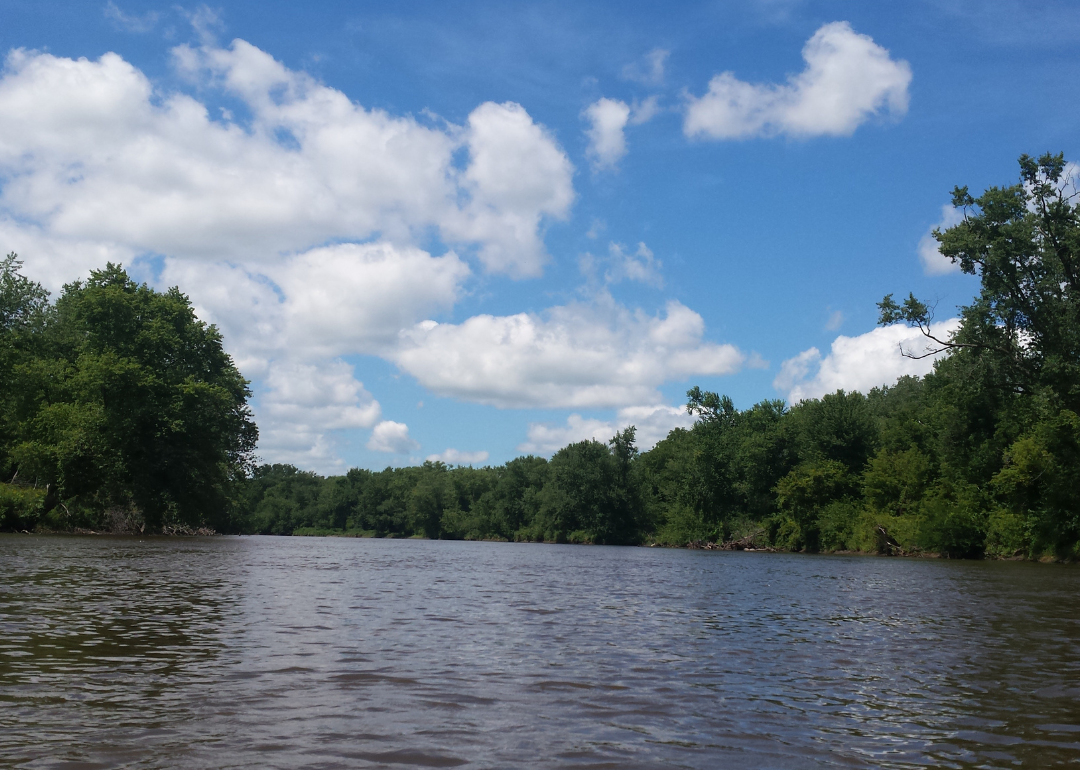
#24. Johnson County
Canva
- Tornadoes since 2000: 20 (3.54 per 100 square miles)
- #316 nationally
- Tornadoes this year, as of May 31: 0
- #316 nationally
- Tornadoes this year, as of May 31: 0
#23. Black Hawk County

Canva
- Tornadoes since 2000: 20 (3.56 per 100 square miles)
- #309 nationally
- Tornadoes this year, as of May 31: 0
- #309 nationally
- Tornadoes this year, as of May 31: 0
#22. Madison County

dustin77a // Shutterstock
- Tornadoes since 2000: 21 (3.69 per 100 square miles)
- #286 nationally
- Tornadoes this year, as of May 31: 1
- #286 nationally
- Tornadoes this year, as of May 31: 1
#21. Greene County

Gabe Shakour // Shutterstock
- Tornadoes since 2000: 15 (3.76 per 100 square miles)
- #273 nationally
- Tornadoes this year, as of May 31: 0
- #273 nationally
- Tornadoes this year, as of May 31: 0
#20. Osceola County

Kelsey Haugen // Shutterstock
- Tornadoes since 2000: 16 (3.78 per 100 square miles)
- #269 nationally
- Tornadoes this year, as of May 31: 0
- #269 nationally
- Tornadoes this year, as of May 31: 0
#19. Union County

Canva
- Tornadoes since 2000: 22 (3.81 per 100 square miles)
- #264 nationally
- Tornadoes this year, as of May 31: 5
- #264 nationally
- Tornadoes this year, as of May 31: 5
#18. Pocahontas County

Canva
- Tornadoes since 2000: 22 (3.86 per 100 square miles)
- #255 nationally
- Tornadoes this year, as of May 31: 2
- #255 nationally
- Tornadoes this year, as of May 31: 2
#17. Warren County
SevenMaps // Shutterstock
- Tornadoes since 2000: 22 (3.88 per 100 square miles)
- #253 nationally
- Tornadoes this year, as of May 31: 0
- #253 nationally
- Tornadoes this year, as of May 31: 0
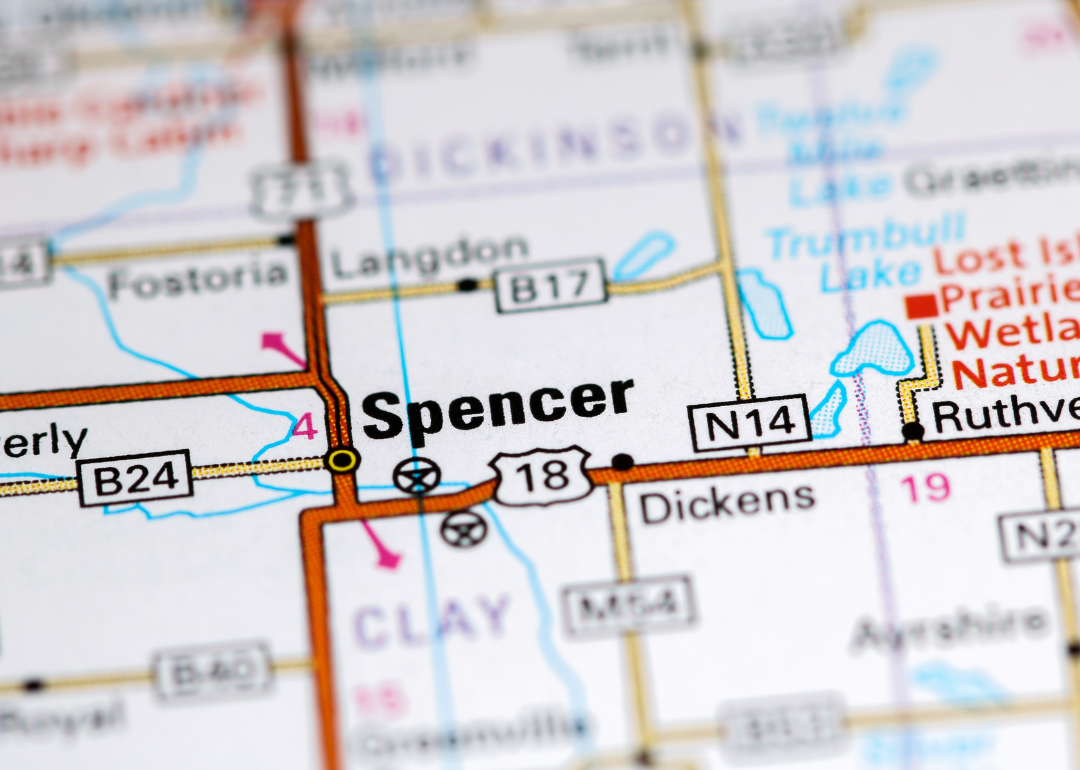
#16. Clay County

Canva
- Tornadoes since 2000: 28 (3.91 per 100 square miles)
- #246 nationally
- Tornadoes this year, as of May 31: 2
- #246 nationally
- Tornadoes this year, as of May 31: 2
#15. Linn County
Marsen // Shutterstock
- Tornadoes since 2000: 23 (4.00 per 100 square miles)
- #233 nationally
- Tornadoes this year, as of May 31: 1
- #233 nationally
- Tornadoes this year, as of May 31: 1
#14. Jones County

Canva
- Tornadoes since 2000: 24 (4.18 per 100 square miles)
- #202 nationally
- Tornadoes this year, as of May 31: 0
- #202 nationally
- Tornadoes this year, as of May 31: 0
#13. Polk County
SevenMaps // Shutterstock
- Tornadoes since 2000: 30 (4.19 per 100 square miles)
- #201 nationally
- Tornadoes this year, as of May 31: 3
- #201 nationally
- Tornadoes this year, as of May 31: 3
#12. Benton County

Canva
- Tornadoes since 2000: 25 (4.36 per 100 square miles)
- #175 nationally
- Tornadoes this year, as of May 31: 0
- #175 nationally
- Tornadoes this year, as of May 31: 0
#11. Story County
Jacob Boomsma // Shutterstock
- Tornadoes since 2000: 26 (4.42 per 100 square miles)
- #168 nationally
- Tornadoes this year, as of May 31: 0
- #168 nationally
- Tornadoes this year, as of May 31: 0
#10. Dallas County
SevenMaps // Shutterstock
- Tornadoes since 2000: 21 (4.44 per 100 square miles)
- #166 nationally
- Tornadoes this year, as of May 31: 0
- #166 nationally
- Tornadoes this year, as of May 31: 0
#9. Howard County

Canva
- Tornadoes since 2000: 26 (4.55 per 100 square miles)
- #150 nationally
- Tornadoes this year, as of May 31: 0
- #150 nationally
- Tornadoes this year, as of May 31: 0
#8. Boone County
Melissa L Oltman // Shutterstock
- Tornadoes since 2000: 23 (4.58 per 100 square miles)
- #142 nationally
- Tornadoes this year, as of May 31: 2
- #142 nationally
- Tornadoes this year, as of May 31: 2
#7. Grundy County

Canva
- Tornadoes since 2000: 21 (4.58 per 100 square miles)
- #140 nationally
- Tornadoes this year, as of May 31: 1
- #140 nationally
- Tornadoes this year, as of May 31: 1
#6. Scott County

SevenMaps // Shutterstock
- Tornadoes since 2000: 30 (5.27 per 100 square miles)
- #89 nationally
- Tornadoes this year, as of May 31: 0
- #89 nationally
- Tornadoes this year, as of May 31: 0
#5. Hardin County
Canva
- Tornadoes since 2000: 30 (5.41 per 100 square miles)
- #79 nationally
- Tornadoes this year, as of May 31: 7
- #79 nationally
- Tornadoes this year, as of May 31: 7
#4. Marion County

Canva
- Tornadoes since 2000: 32 (5.55 per 100 square miles)
- #77 nationally
- Tornadoes this year, as of May 31: 0
- #77 nationally
- Tornadoes this year, as of May 31: 0
#3. Hamilton County

Doug Lambert // Shutterstock
- Tornadoes since 2000: 32 (5.60 per 100 square miles)
- #70 nationally
- Tornadoes this year, as of May 31: 2
- #70 nationally
- Tornadoes this year, as of May 31: 2
#2. Buchanan County

Canva
- Tornadoes since 2000: 41 (5.73 per 100 square miles)
- #64 nationally
- Tornadoes this year, as of May 31: 0
- #64 nationally
- Tornadoes this year, as of May 31: 0
#1. Webster County
Canva