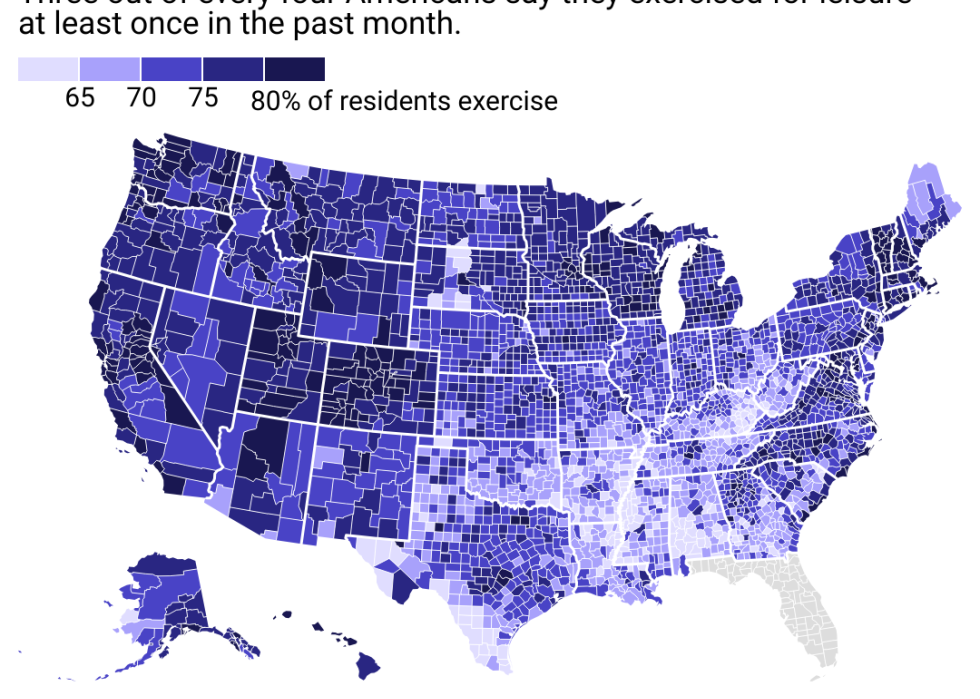
Healthy hotspots: The most physically active counties in Kansas
Income is a potent predictor of the time a person devotes to physical exercise. People with lower incomes can find it hard to exercise because safe public spaces may not be available, gym membership and workout equipment are expensive, and they may have less flexible work schedules.
A 2018 research paper found that among adolescents and young adults, people in families with higher incomes, as well as men and white people, were more likely than others to engage in physical activity.
The Peter G. Peterson Foundation reported that, in 2021, households in Northeastern and Western states earned, on average, $7,000 to $15,000 more a year than households in the Midwest and South, respectively. People who live in those regions are more likely to report higher rates of physical activity.
- Share of adults reporting any physical activity: 75.6%
- Share of adults reporting any physical activity: 75.8%
- Share of adults reporting any physical activity: 75.9%
- Share of adults reporting any physical activity: 76.0%
- Share of adults reporting any physical activity: 76.0%
- Share of adults reporting any physical activity: 76.1%
- Share of adults reporting any physical activity: 76.1%
- Share of adults reporting any physical activity: 76.2%
- Share of adults reporting any physical activity: 76.2%
- Share of adults reporting any physical activity: 76.3%
- Share of adults reporting any physical activity: 76.3%
- Share of adults reporting any physical activity: 76.3%
- Share of adults reporting any physical activity: 76.3%
- Share of adults reporting any physical activity: 76.4%
- Share of adults reporting any physical activity: 76.4%
- Share of adults reporting any physical activity: 76.8%
- Share of adults reporting any physical activity: 76.9%
- Share of adults reporting any physical activity: 77.0%
- Share of adults reporting any physical activity: 77.4%
- Share of adults reporting any physical activity: 77.5%
- Share of adults reporting any physical activity: 77.6%
- Share of adults reporting any physical activity: 77.9%
- Share of adults reporting any physical activity: 78.2%
- Share of adults reporting any physical activity: 80.9%
- Share of adults reporting any physical activity: 83.7%
This story features data reporting by Elena Cox, writing by Shakhzod Yuldoshboev, and is part of a series utilizing data automation across 49 states.