Counties with the highest rates of strokes in Kentucky

- Death rate for ischemic strokes, 2018-20: 25.2 per 100K people
- Death rate for hemorrhagic strokes, 2018-20: 12.1 per 100K people

- Death rate for ischemic strokes, 2018-20: 25.5 per 100K people
- Death rate for hemorrhagic strokes, 2018-20: 9.8 per 100K people

- Death rate for ischemic strokes, 2018-20: 27.4 per 100K people
- Death rate for hemorrhagic strokes, 2018-20: 9.5 per 100K people

- Death rate for ischemic strokes, 2018-20: 28.7 per 100K people
- Death rate for hemorrhagic strokes, 2018-20: 11.5 per 100K people

- Death rate for ischemic strokes, 2018-20: 29.5 per 100K people
- Death rate for hemorrhagic strokes, 2018-20: 9.3 per 100K people
You may also like: Highest-earning cities in Kentucky

- Death rate for ischemic strokes, 2018-20: 41.5 per 100K people
- Death rate for hemorrhagic strokes, 2018-20: 13.1 per 100K people

- Death rate for ischemic strokes, 2018-20: 17.3 per 100K people
- Death rate for hemorrhagic strokes, 2018-20: 10.2 per 100K people

- Death rate for ischemic strokes, 2018-20: 22.1 per 100K people
- Death rate for hemorrhagic strokes, 2018-20: 10.1 per 100K people

- Death rate for ischemic strokes, 2018-20: 22.2 per 100K people
- Death rate for hemorrhagic strokes, 2018-20: 12.1 per 100K people

- Death rate for ischemic strokes, 2018-20: 24.7 per 100K people
- Death rate for hemorrhagic strokes, 2018-20: 13.5 per 100K people
You may also like: Counties with the highest COVID-19 vaccination rate in Kentucky

- Death rate for ischemic strokes, 2018-20: 27.0 per 100K people
- Death rate for hemorrhagic strokes, 2018-20: 10.8 per 100K people

- Death rate for ischemic strokes, 2018-20: 27.8 per 100K people
- Death rate for hemorrhagic strokes, 2018-20: 11.2 per 100K people

- Death rate for ischemic strokes, 2018-20: 29.1 per 100K people
- Death rate for hemorrhagic strokes, 2018-20: 16.9 per 100K people

- Death rate for ischemic strokes, 2018-20: 29.2 per 100K people
- Death rate for hemorrhagic strokes, 2018-20: 9.9 per 100K people

- Death rate for ischemic strokes, 2018-20: 30.6 per 100K people
- Death rate for hemorrhagic strokes, 2018-20: 10.2 per 100K people
You may also like: Best places to retire in Kentucky

- Death rate for ischemic strokes, 2018-20: 34.6 per 100K people
- Death rate for hemorrhagic strokes, 2018-20: 13.6 per 100K people

- Death rate for ischemic strokes, 2018-20: 22.6 per 100K people
- Death rate for hemorrhagic strokes, 2018-20: 9.9 per 100K people

- Death rate for ischemic strokes, 2018-20: 23.4 per 100K people
- Death rate for hemorrhagic strokes, 2018-20: 8.6 per 100K people

- Death rate for ischemic strokes, 2018-20: 26.6 per 100K people
- Death rate for hemorrhagic strokes, 2018-20: 11.9 per 100K people

- Death rate for ischemic strokes, 2018-20: 28.2 per 100K people
- Death rate for hemorrhagic strokes, 2018-20: 10.0 per 100K people
You may also like: Counties with the worst commutes in Kentucky

- Death rate for ischemic strokes, 2018-20: 30.7 per 100K people
- Death rate for hemorrhagic strokes, 2018-20: 11.9 per 100K people

- Death rate for ischemic strokes, 2018-20: 16.5 per 100K people
- Death rate for hemorrhagic strokes, 2018-20: 11.6 per 100K people

- Death rate for ischemic strokes, 2018-20: 23.8 per 100K people
- Death rate for hemorrhagic strokes, 2018-20: 12.0 per 100K people

- Death rate for ischemic strokes, 2018-20: 24.6 per 100K people
- Death rate for hemorrhagic strokes, 2018-20: 11.6 per 100K people

- Death rate for ischemic strokes, 2018-20: 25.4 per 100K people
- Death rate for hemorrhagic strokes, 2018-20: 12.7 per 100K people
You may also like: Biggest sources of immigrants to Kentucky

- Death rate for ischemic strokes, 2018-20: 26.5 per 100K people
- Death rate for hemorrhagic strokes, 2018-20: 12.9 per 100K people

- Death rate for ischemic strokes, 2018-20: 27.8 per 100K people
- Death rate for hemorrhagic strokes, 2018-20: 11.2 per 100K people

- Death rate for ischemic strokes, 2018-20: 28.6 per 100K people
- Death rate for hemorrhagic strokes, 2018-20: 11.0 per 100K people

- Death rate for ischemic strokes, 2018-20: 29.2 per 100K people
- Death rate for hemorrhagic strokes, 2018-20: 12.3 per 100K people

- Death rate for ischemic strokes, 2018-20: 30.1 per 100K people
- Death rate for hemorrhagic strokes, 2018-20: 14.2 per 100K people
You may also like: Lowest-earning counties in Kentucky

- Death rate for ischemic strokes, 2018-20: 15.9 per 100K people
- Death rate for hemorrhagic strokes, 2018-20: 11.2 per 100K people

- Death rate for ischemic strokes, 2018-20: 24.3 per 100K people
- Death rate for hemorrhagic strokes, 2018-20: 12.4 per 100K people

- Death rate for ischemic strokes, 2018-20: 26.1 per 100K people
- Death rate for hemorrhagic strokes, 2018-20: 11.2 per 100K people

- Death rate for ischemic strokes, 2018-20: 27.0 per 100K people
- Death rate for hemorrhagic strokes, 2018-20: 15.1 per 100K people

- Death rate for ischemic strokes, 2018-20: 25.0 per 100K people
- Death rate for hemorrhagic strokes, 2018-20: 10.1 per 100K people
You may also like: States sending the most people to Kentucky

- Death rate for ischemic strokes, 2018-20: 27.8 per 100K people
- Death rate for hemorrhagic strokes, 2018-20: 11.1 per 100K people

- Death rate for ischemic strokes, 2018-20: 30.8 per 100K people
- Death rate for hemorrhagic strokes, 2018-20: 6.8 per 100K people

- Death rate for ischemic strokes, 2018-20: 32.6 per 100K people
- Death rate for hemorrhagic strokes, 2018-20: 14.9 per 100K people

- Death rate for ischemic strokes, 2018-20: 27.2 per 100K people
- Death rate for hemorrhagic strokes, 2018-20: 15.6 per 100K people

- Death rate for ischemic strokes, 2018-20: 27.5 per 100K people
- Death rate for hemorrhagic strokes, 2018-20: 9.8 per 100K people
You may also like: Breonna Taylor becomes a martyr for the movement: A major civil rights moment in Kentucky

- Death rate for ischemic strokes, 2018-20: 29.7 per 100K people
- Death rate for hemorrhagic strokes, 2018-20: 13.9 per 100K people

- Death rate for ischemic strokes, 2018-20: 22.6 per 100K people
- Death rate for hemorrhagic strokes, 2018-20: 11.3 per 100K people

- Death rate for ischemic strokes, 2018-20: 23.1 per 100K people
- Death rate for hemorrhagic strokes, 2018-20: 9.8 per 100K people

- Death rate for ischemic strokes, 2018-20: 23.3 per 100K people
- Death rate for hemorrhagic strokes, 2018-20: 12.7 per 100K people

- Death rate for ischemic strokes, 2018-20: 24.9 per 100K people
- Death rate for hemorrhagic strokes, 2018-20: 9.7 per 100K people
You may also like: See how much delivery drivers in Kentucky make

- Death rate for ischemic strokes, 2018-20: 25.3 per 100K people
- Death rate for hemorrhagic strokes, 2018-20: 9.3 per 100K people

- Death rate for ischemic strokes, 2018-20: 30.3 per 100K people
- Death rate for hemorrhagic strokes, 2018-20: 13.8 per 100K people

- Death rate for ischemic strokes, 2018-20: 24.0 per 100K people
- Death rate for hemorrhagic strokes, 2018-20: 9.1 per 100K people
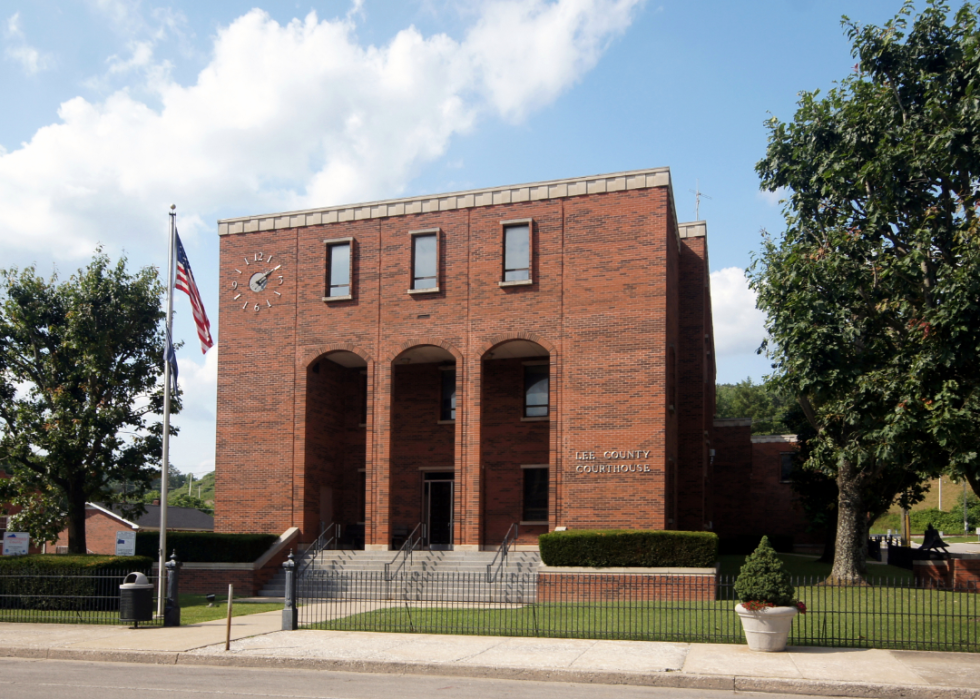
- Death rate for ischemic strokes, 2018-20: 25.6 per 100K people
- Death rate for hemorrhagic strokes, 2018-20: 12.4 per 100K people

- Death rate for ischemic strokes, 2018-20: 26.2 per 100K people
- Death rate for hemorrhagic strokes, 2018-20: 10.9 per 100K people
You may also like: See how much of its wind energy potential Kentucky uses
This story features data reporting and writing by Emma Rubin and is part of a series utilizing data automation across 49 states.
