From bar to barre: Where we're going this Dry January
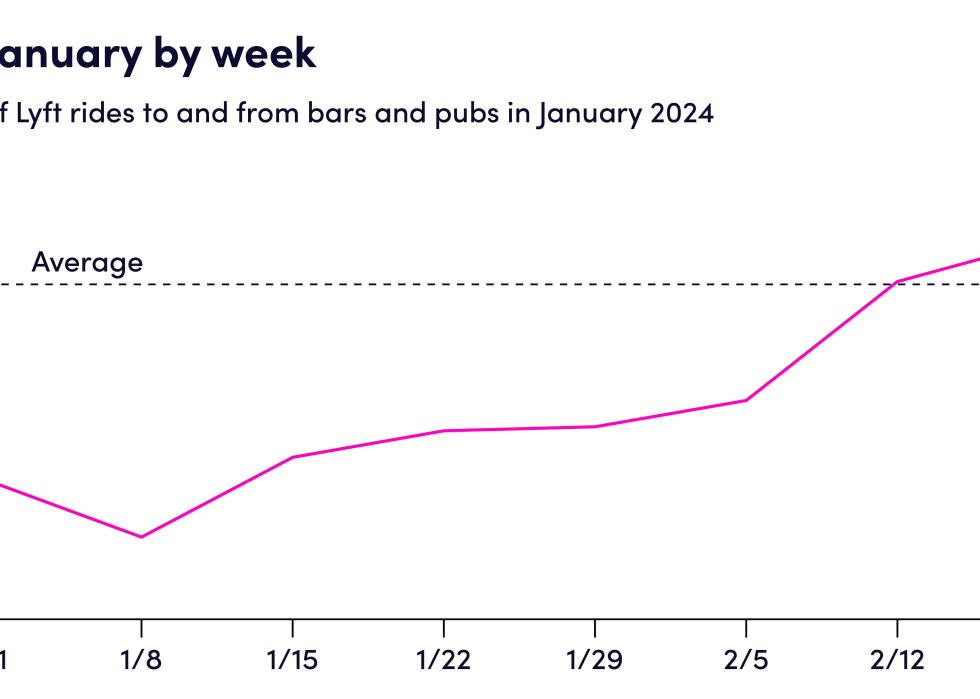
In general, the second week of January is the driest. By the third week, however, bar drop-offs and pickups increase by about 5%. And by February, bar ridership is about back to normal levels.
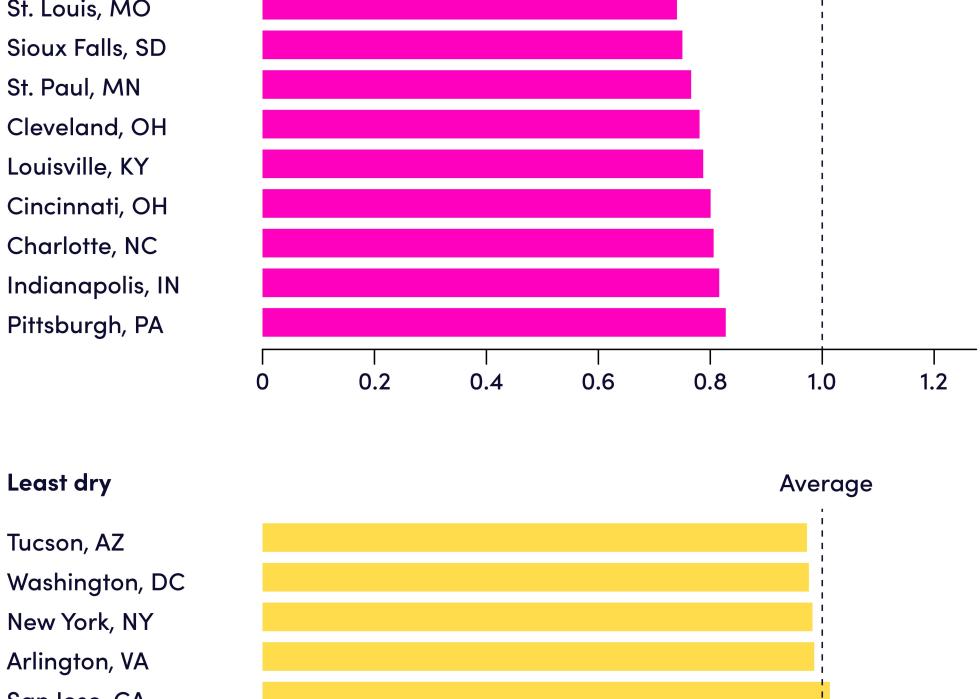
Of course, not all places refrain equally. The Midwest (most notably, Kansas City, Missouri; St. Louis, Missouri; and Sioux Falls, South Dakota) experiences a 25% decline in bar activity. On the other hand, Las Vegas and college towns like Gainesville, Florida, and Tempe, Arizona, actually experience a slight increase in the New Year.
But Dry January is not just about sacrifice. It's also about making room for other, healthier activities.
It turns out, people get up earlier in January. Lyft customers are 4% more likely to take a Lyft ride between 6 a.m. and 9 a.m. in January than usual. And some of these early risers are fulfilling the classic New Year's resolution of going to the gym. Indeed, rides to the gym shoot up 20% in January—and stay elevated through March.
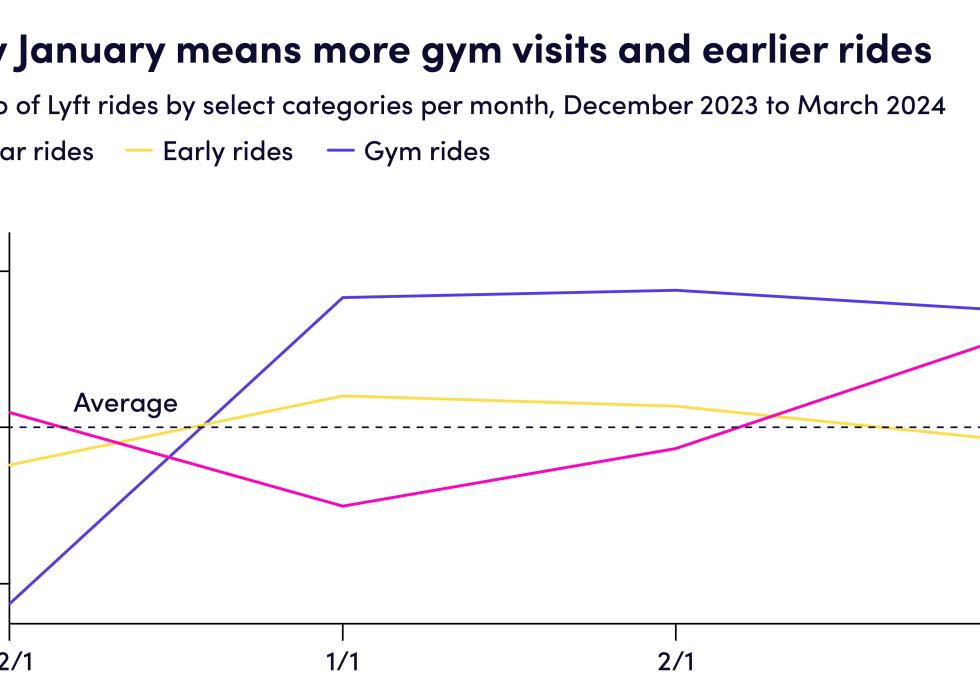
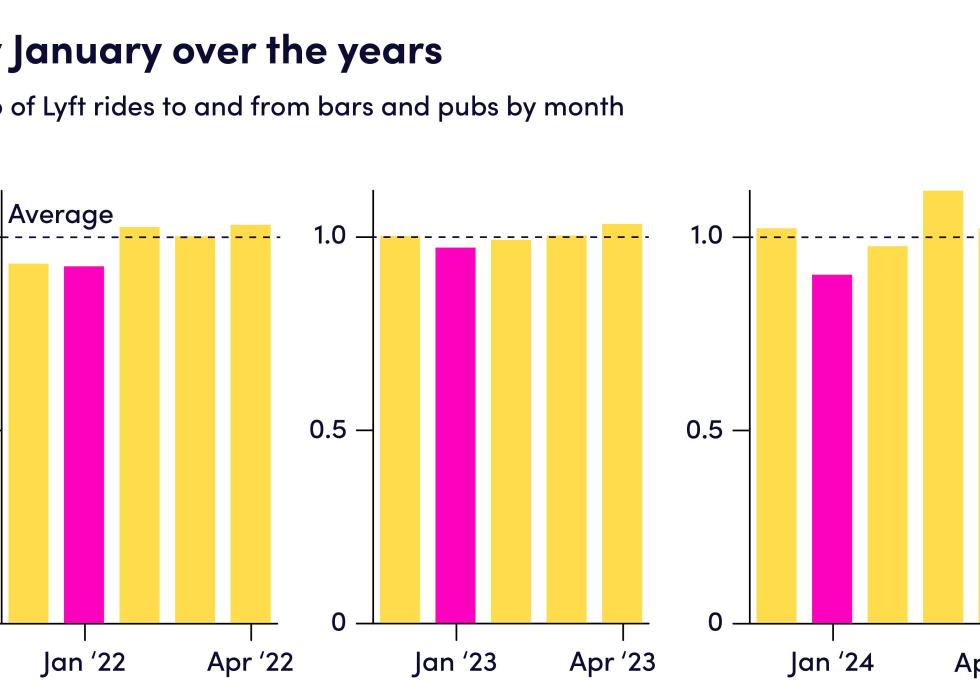
Rev analyzed aggregate ride data in all regions in the U.S. from December 2021 through December 2024. The core statistic was the share of all rides that were to/from bars or pubs in January, relative to the average share between the three months before and three months after January. This statistic is shown weekly (chart 2) and by region (chart 3). Additionally, Lyft compared it with the share of rides to gyms and the share of rides that occur between 6 a.m. and 9 a.m.