Cities with the most expensive homes in the Barnstable Town metro area
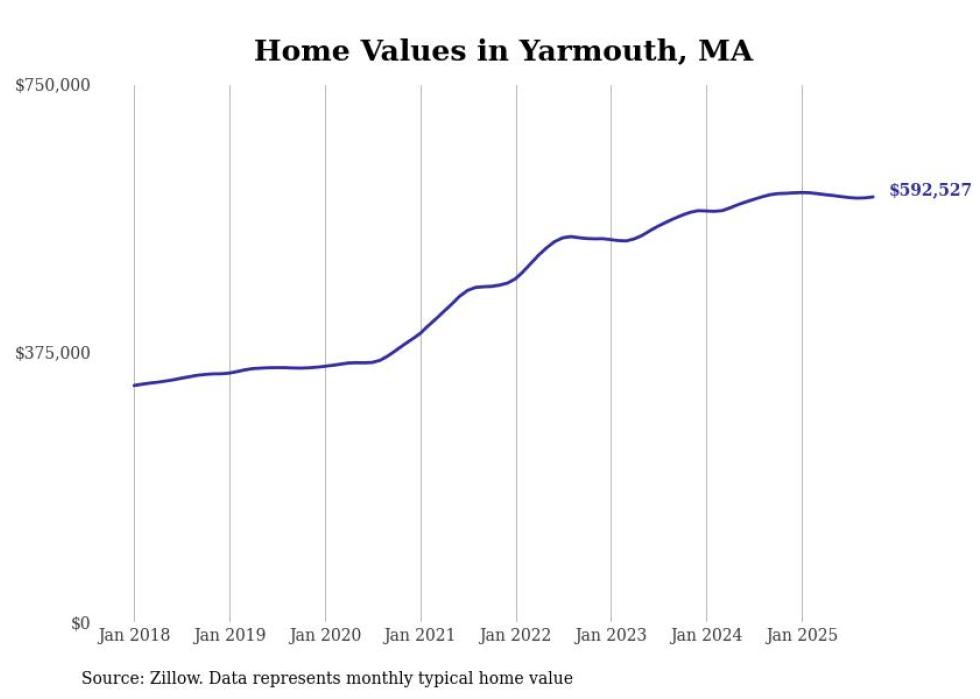
- Typical home value: $592,527
- 1-year price change: -0.8%
- 5-year price change: +56.4%
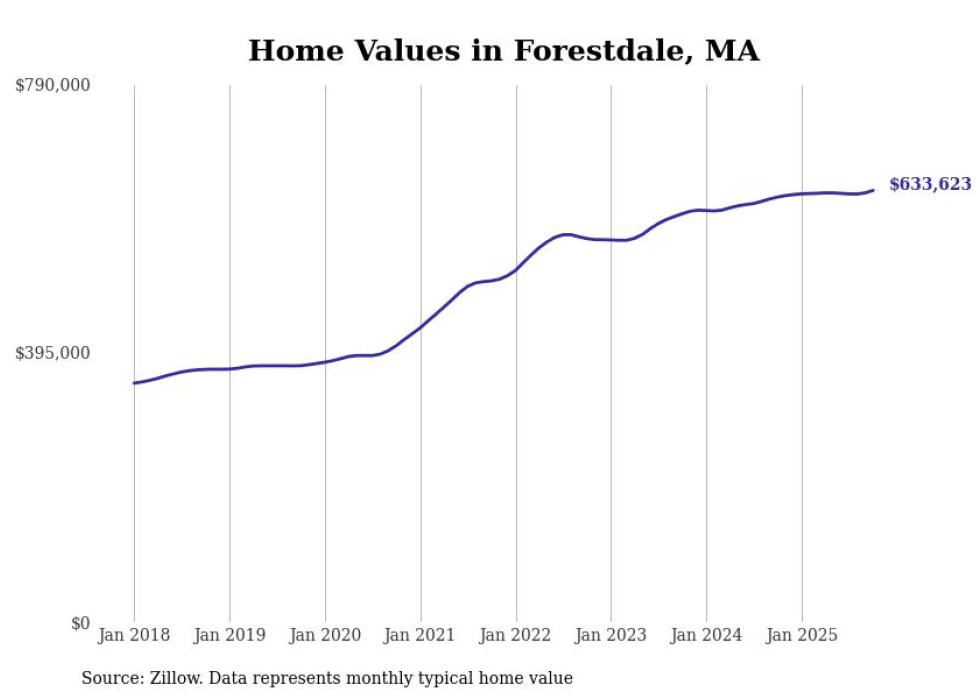
- Typical home value: $633,623
- 1-year price change: +1.6%
- 5-year price change: +56.2%
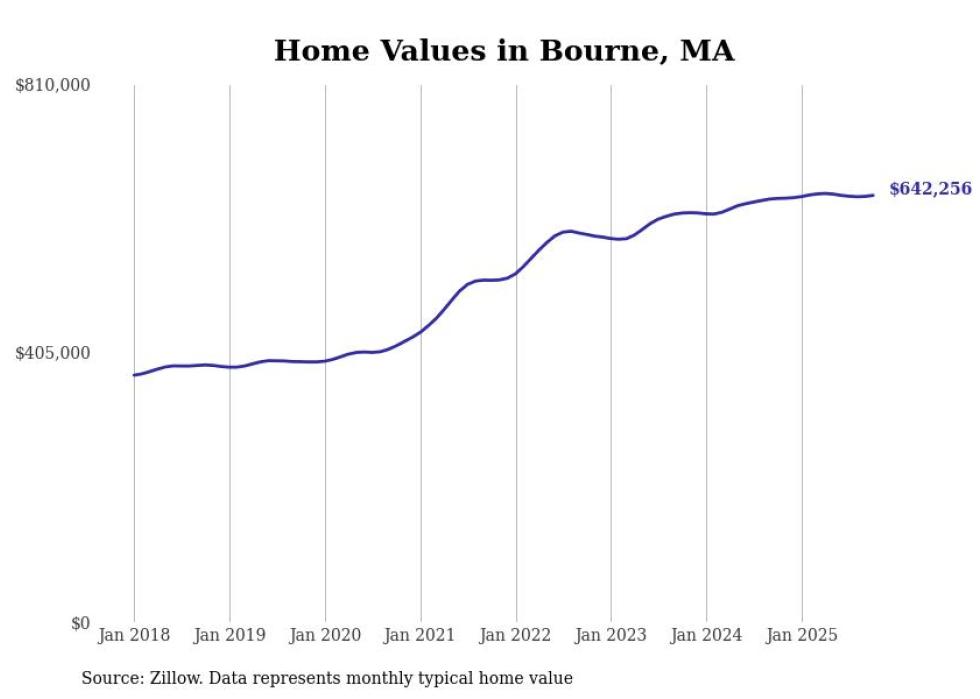
- Typical home value: $642,256
- 1-year price change: +0.7%
- 5-year price change: +54.4%
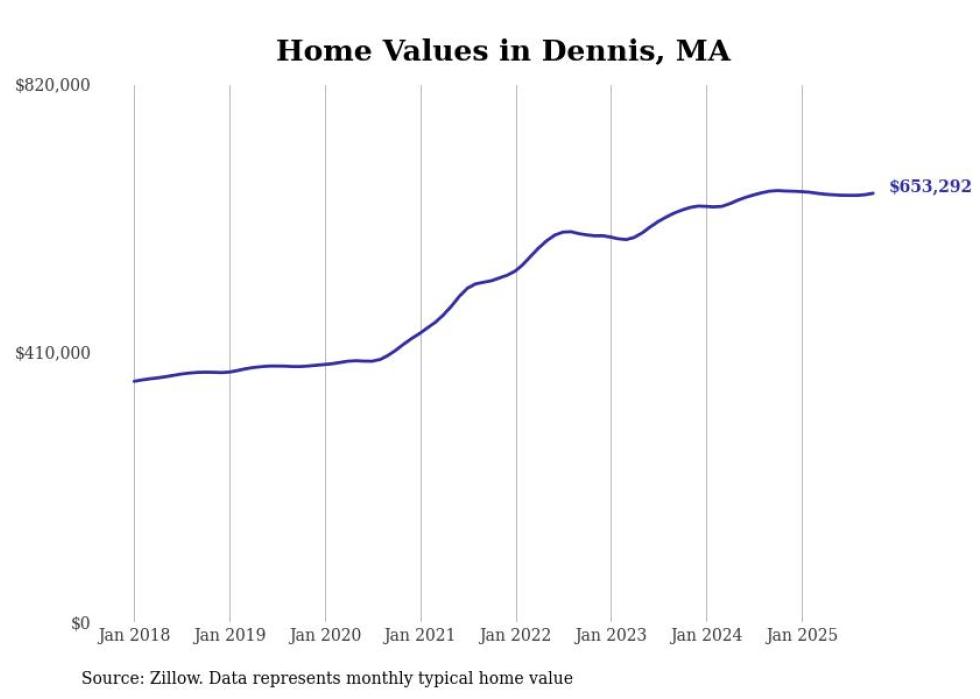
- Typical home value: $653,292
- 1-year price change: -0.6%
- 5-year price change: +57.5%
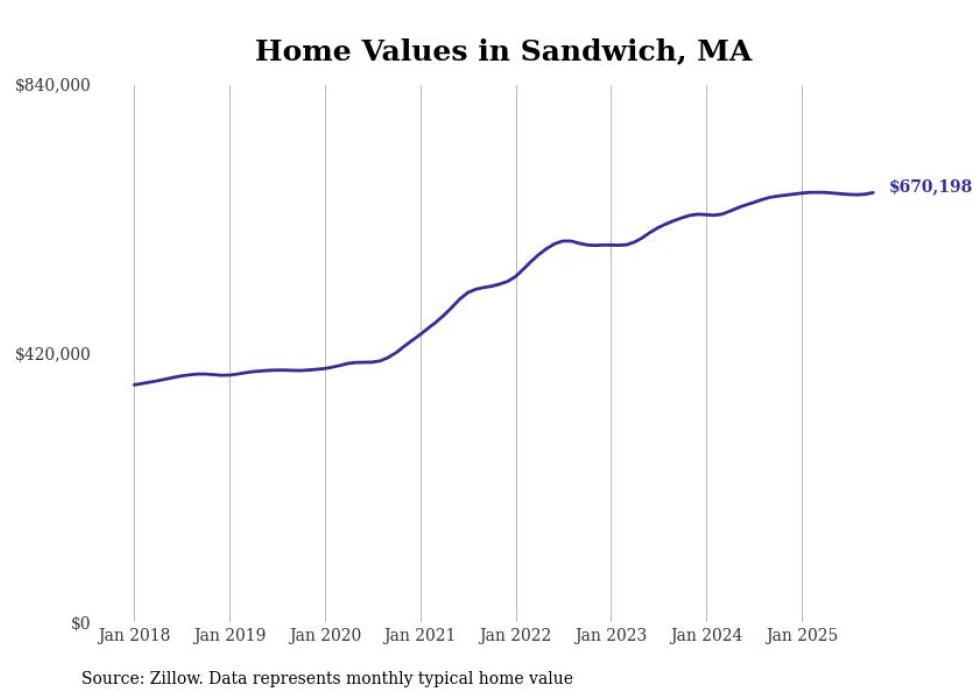
- Typical home value: $670,198
- 1-year price change: +0.8%
- 5-year price change: +59.3%
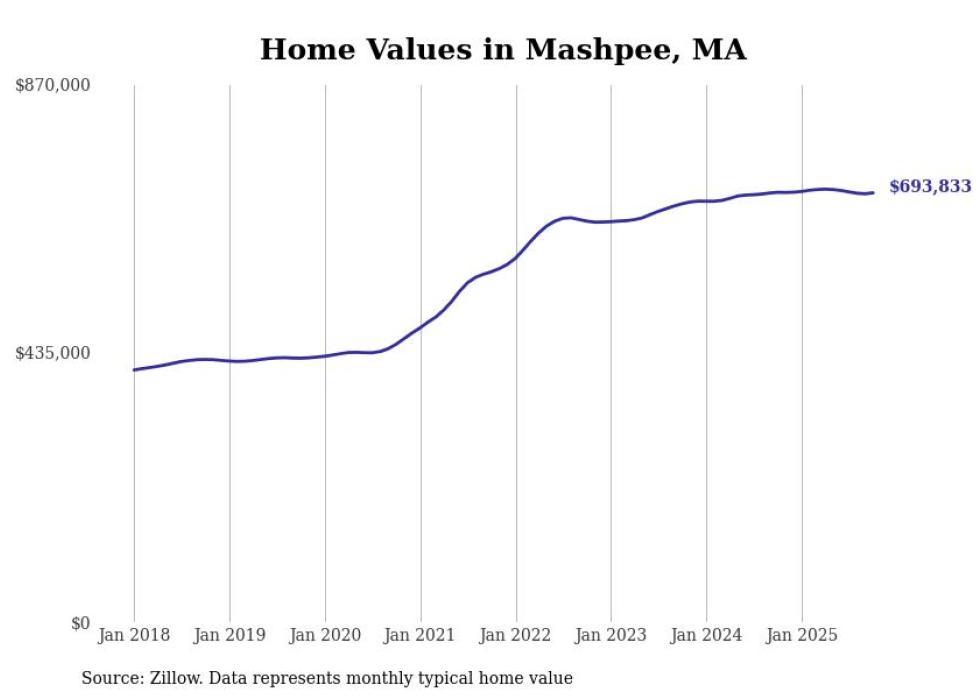
- Typical home value: $693,833
- 1-year price change: -0.1%
- 5-year price change: +54.4%
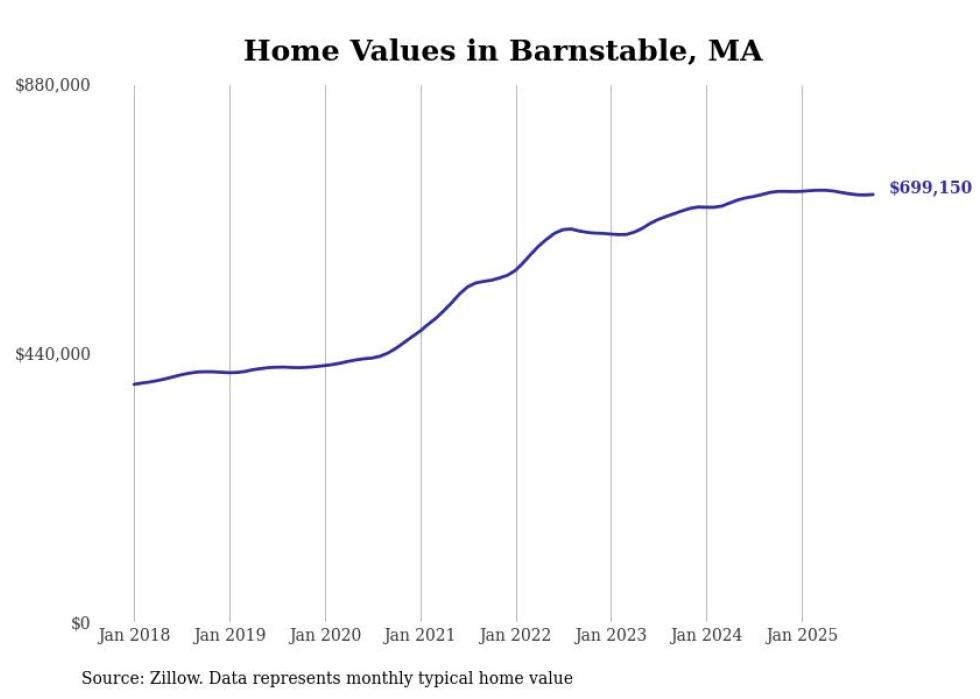
- Typical home value: $699,150
- 1-year price change: -0.7%
- 5-year price change: +56.1%
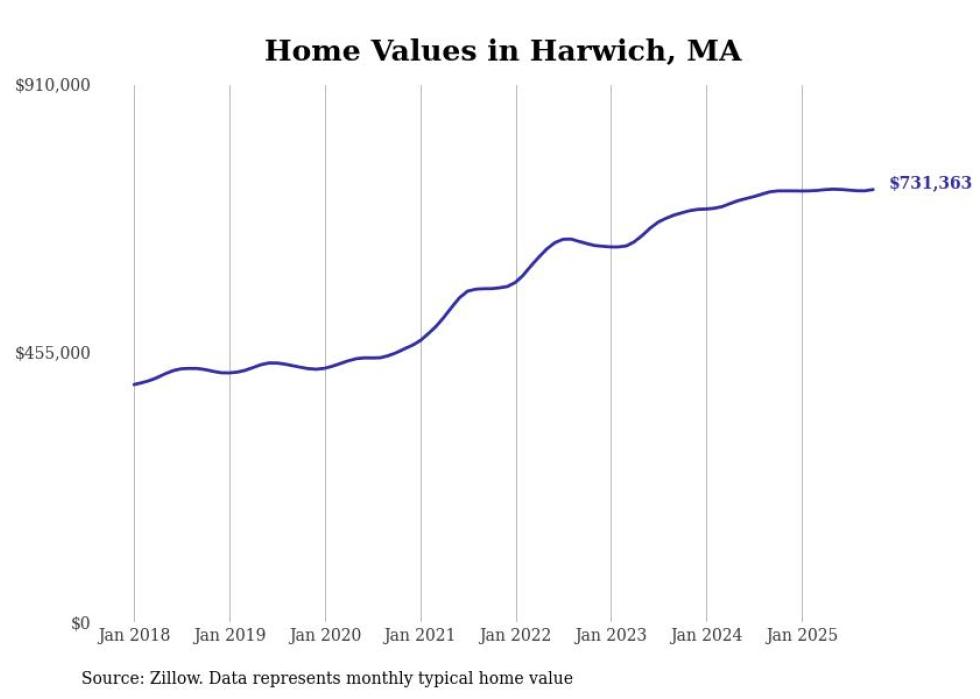
- Typical home value: $731,363
- 1-year price change: +0.3%
- 5-year price change: +60.6%
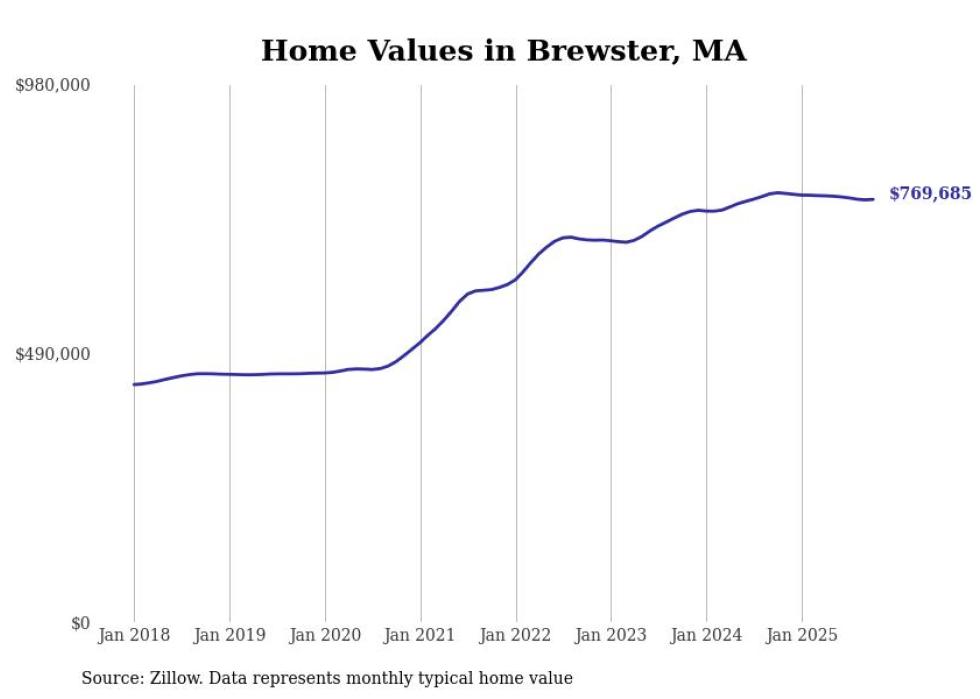
- Typical home value: $769,685
- 1-year price change: -1.5%
- 5-year price change: +62.2%
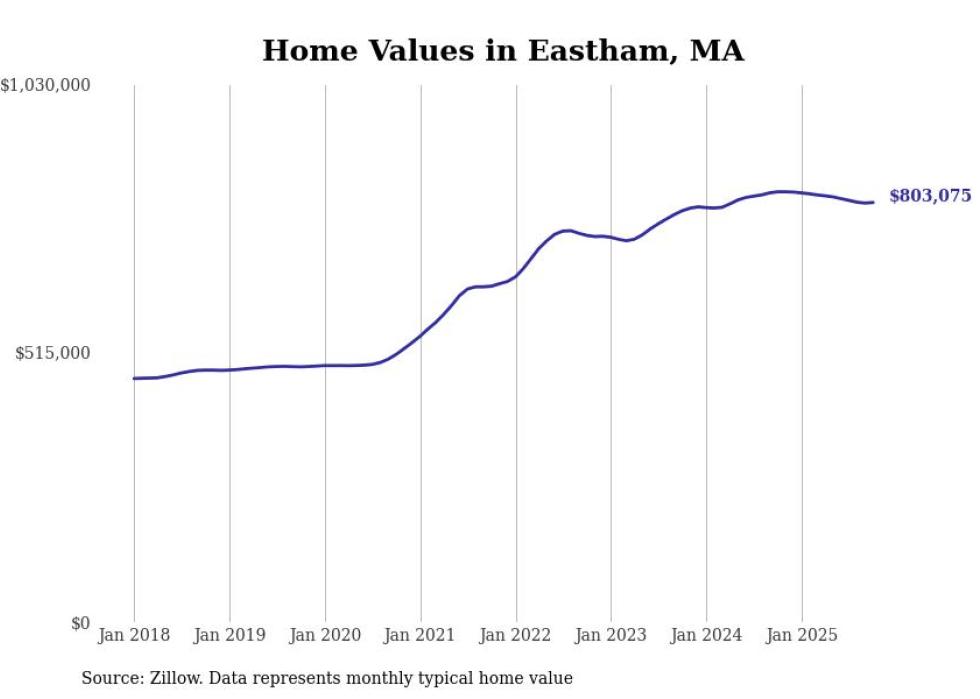
- Typical home value: $803,075
- 1-year price change: -2.5%
- 5-year price change: +56.7%
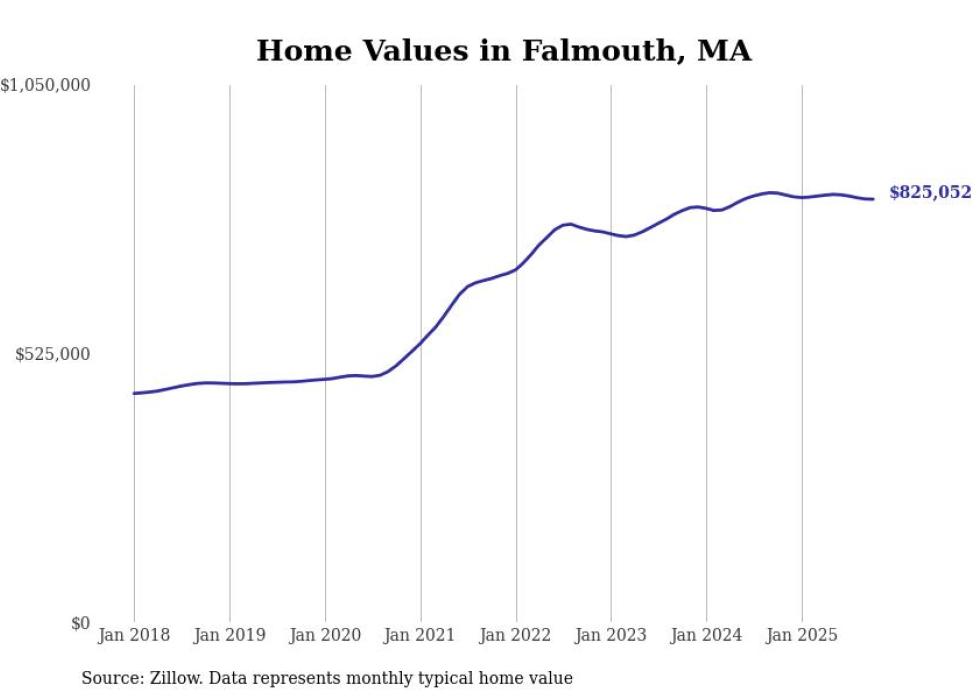
- Typical home value: $825,052
- 1-year price change: -1.4%
- 5-year price change: +64.9%
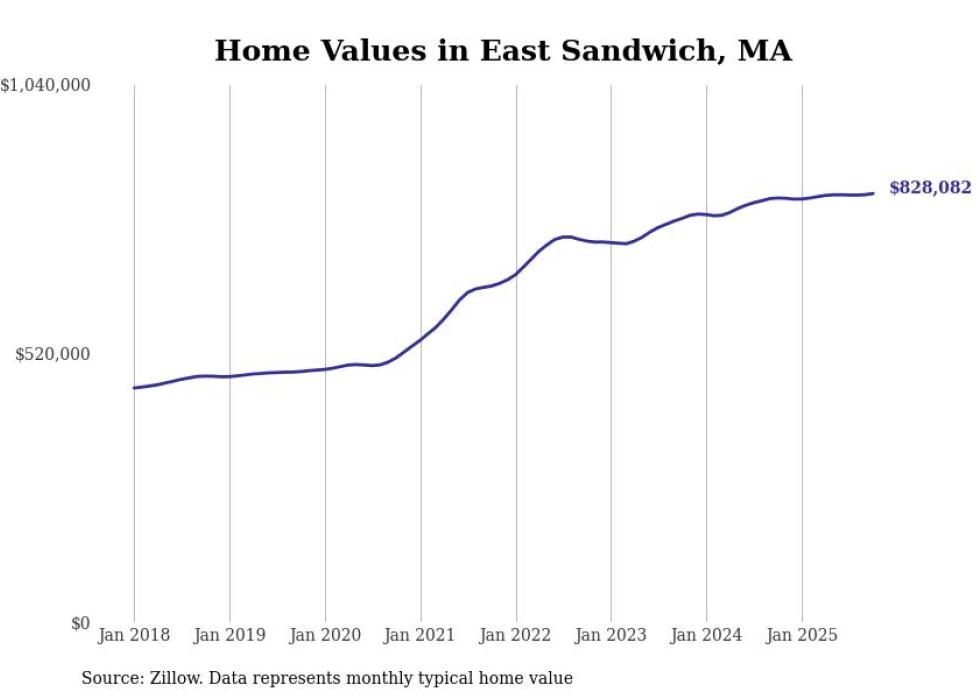
- Typical home value: $828,082
- 1-year price change: +1.0%
- 5-year price change: +62.1%
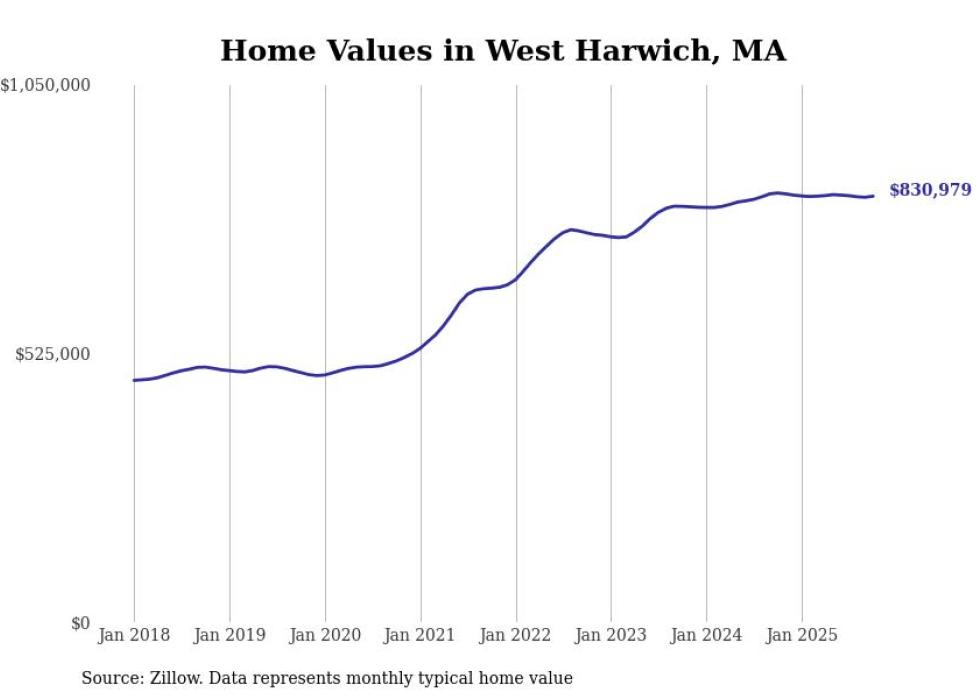
- Typical home value: $830,979
- 1-year price change: -0.7%
- 5-year price change: +63.1%
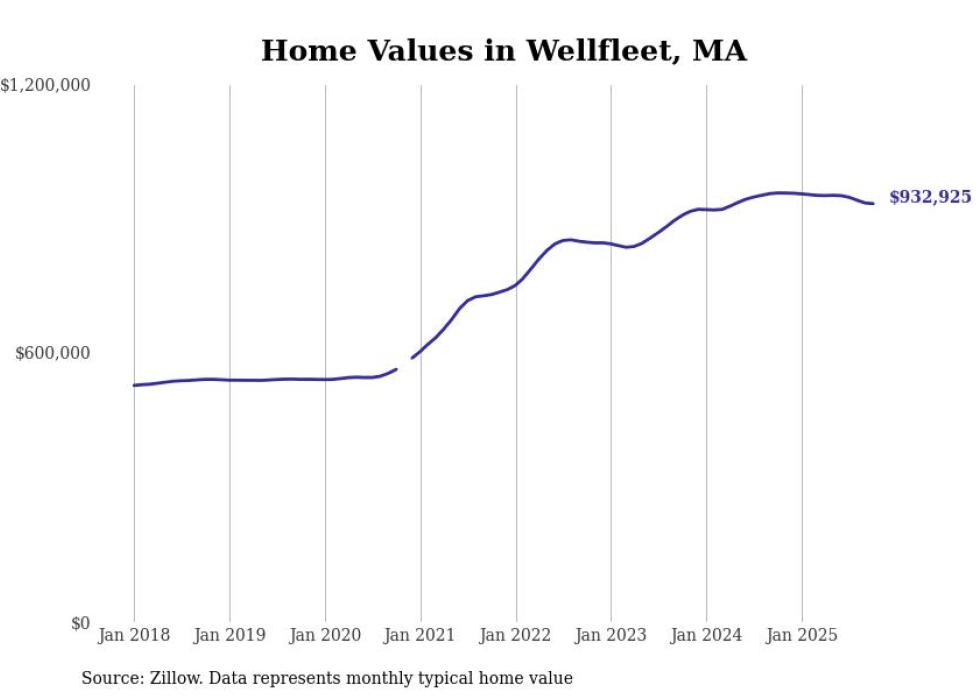
- Typical home value: $932,925
- 1-year price change: -2.5%
- 5-year price change: +65.6%
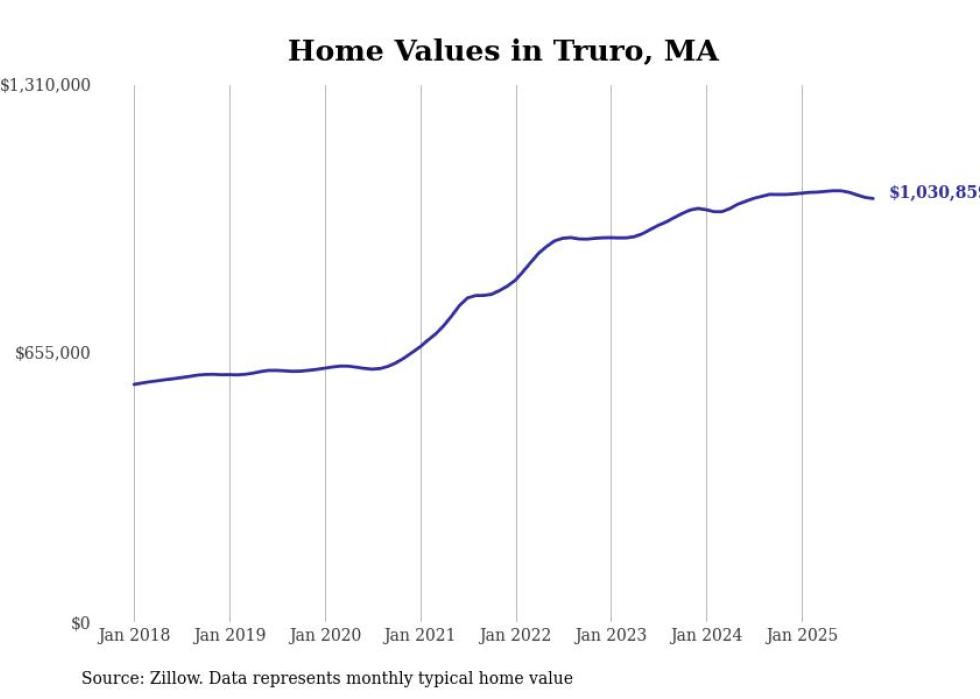
- Typical home value: $1,030,859
- 1-year price change: -0.9%
- 5-year price change: +63.3%
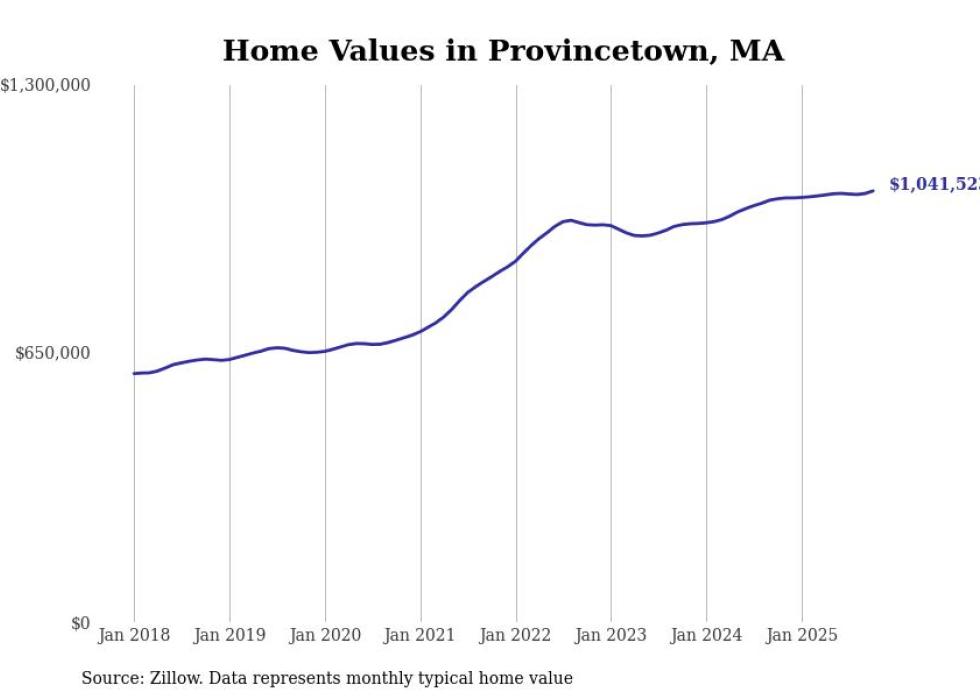
- Typical home value: $1,041,523
- 1-year price change: +1.9%
- 5-year price change: +52.9%
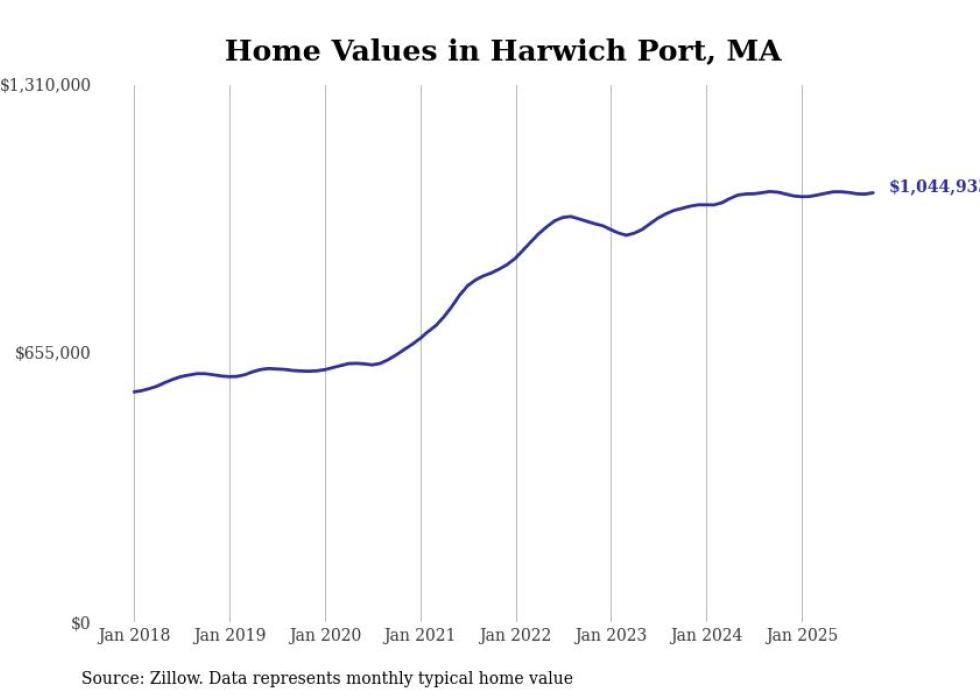
- Typical home value: $1,044,933
- 1-year price change: -0.1%
- 5-year price change: +60.6%
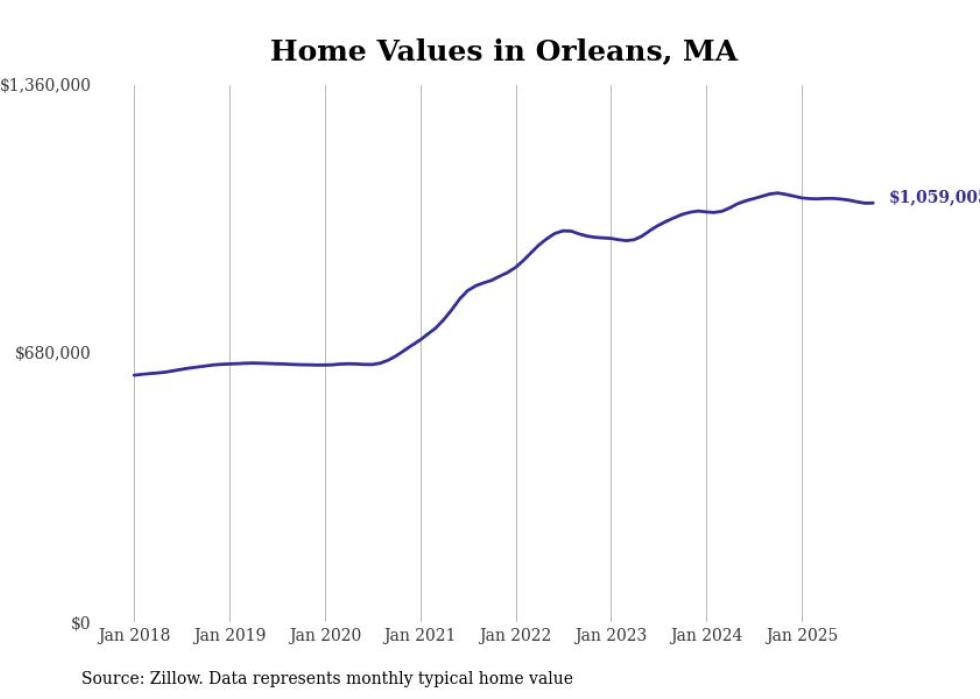
- Typical home value: $1,059,005
- 1-year price change: -2.3%
- 5-year price change: +57.4%
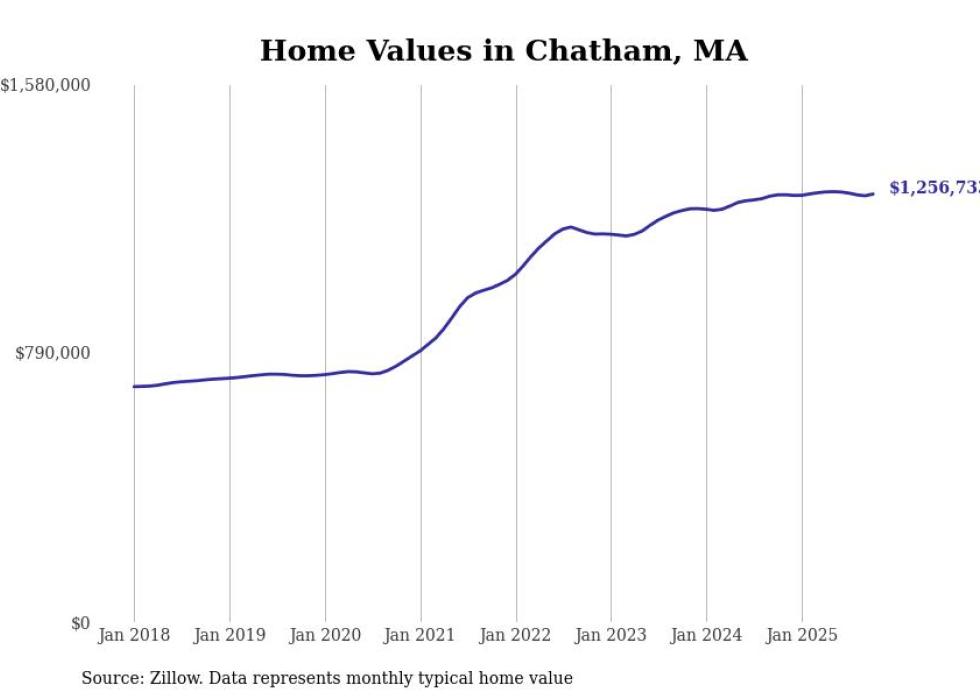
- Typical home value: $1,256,733
- 1-year price change: +0.2%
- 5-year price change: +67.2%