Counties with the most bridges in dire need of repair in Massachusetts
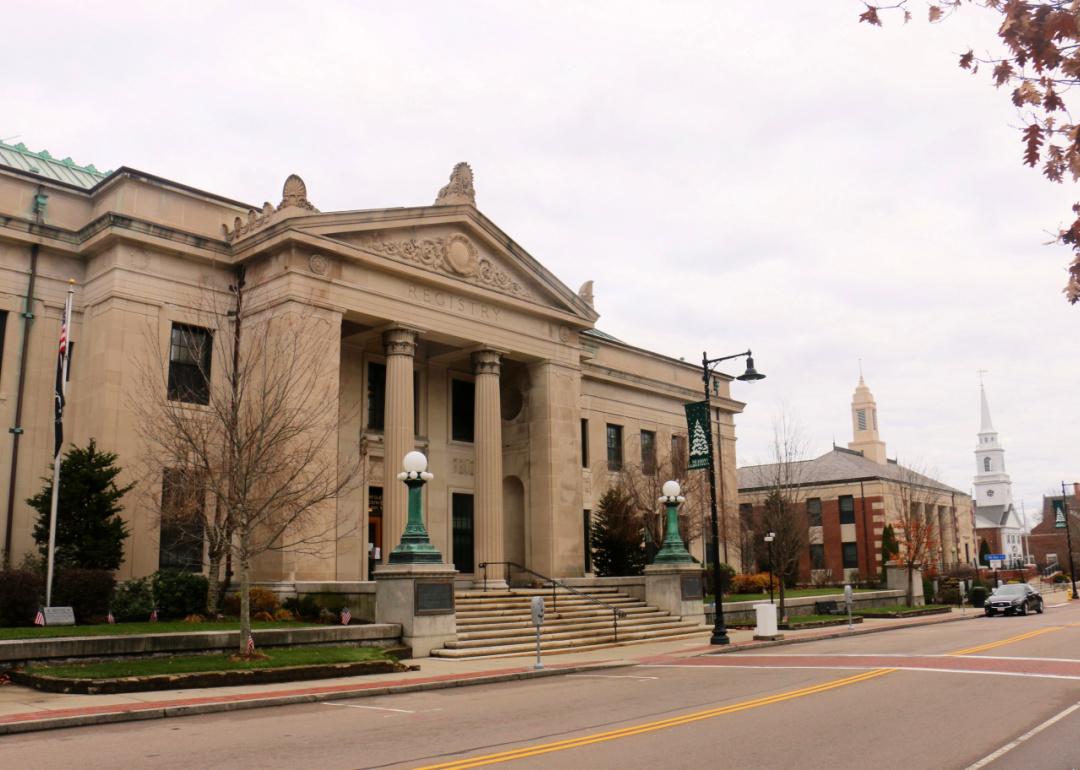
- Bridges in poor condition: 3.5% (12 of 342 bridges)
- Square meters of bridges in poor condition: 3.0% (6,738 of 226,701 square meters of bridges)
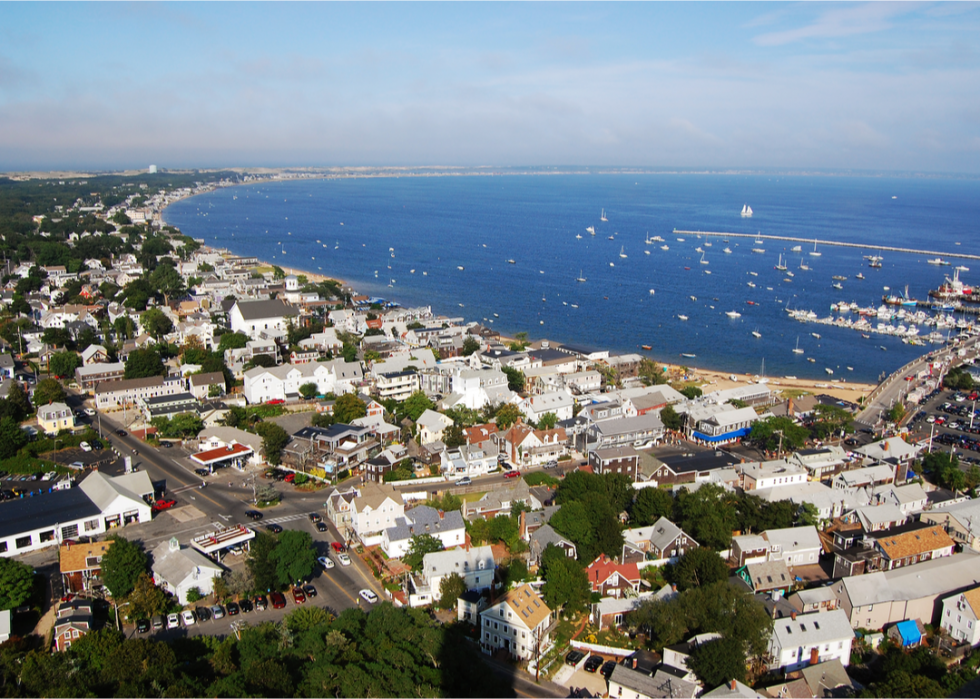
- Bridges in poor condition: 3.7% (4 of 107 bridges)
- Square meters of bridges in poor condition: 21.7% (14,315 of 66,024 square meters of bridges)
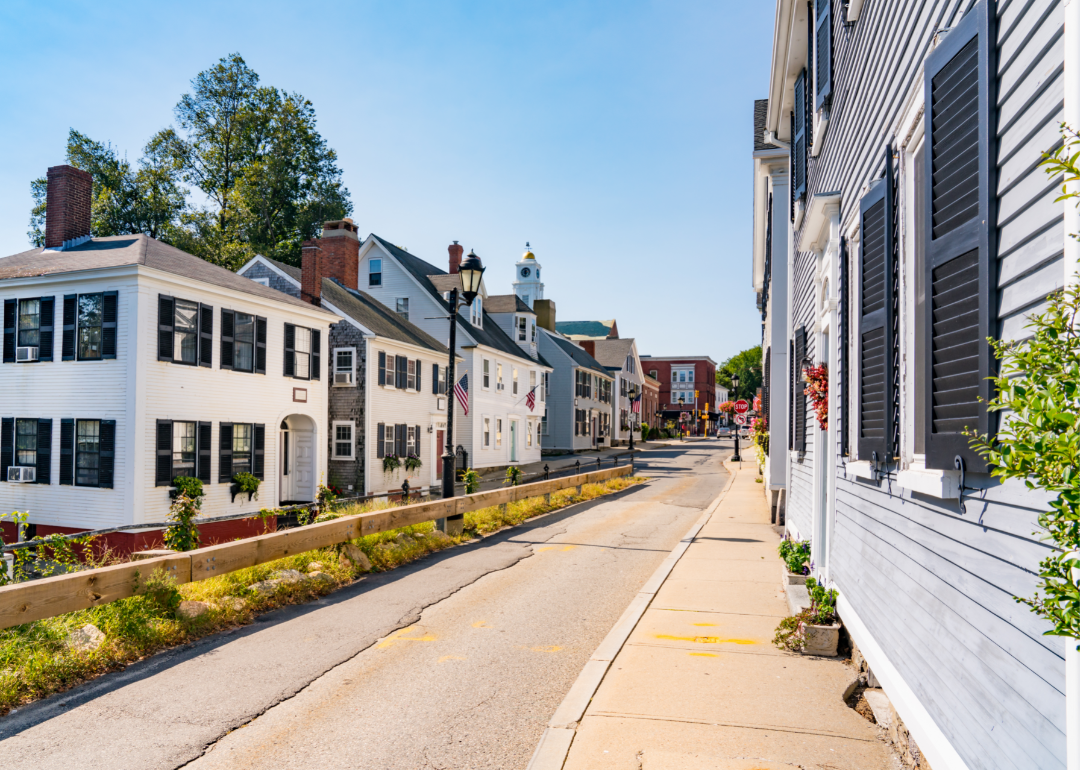
- Bridges in poor condition: 4.2% (12 of 287 bridges)
- Square meters of bridges in poor condition: 7.6% (11,029 of 145,941 square meters of bridges)

- Bridges in poor condition: 6.5% (65 of 996 bridges)
- Square meters of bridges in poor condition: 5.4% (27,633 of 514,726 square meters of bridges)

- Bridges in poor condition: 7.2% (28 of 389 bridges)
- Square meters of bridges in poor condition: 8.0% (27,774 of 348,811 square meters of bridges)

- Bridges in poor condition: 7.6% (34 of 447 bridges)
- Square meters of bridges in poor condition: 5.2% (6,488 of 125,669 square meters of bridges)

- Bridges in poor condition: 8.4% (36 of 430 bridges)
- Square meters of bridges in poor condition: 7.4% (34,756 of 469,888 square meters of bridges)

- Bridges in poor condition: 10.1% (50 of 493 bridges)
- Square meters of bridges in poor condition: 11.6% (124,395 of 1,076,279 square meters of bridges)

- Bridges in poor condition: 10.4% (27 of 259 bridges)
- Square meters of bridges in poor condition: 13.2% (11,201 of 84,721 square meters of bridges)

- Bridges in poor condition: 10.5% (83 of 793 bridges)
- Square meters of bridges in poor condition: 12.9% (76,399 of 591,724 square meters of bridges)
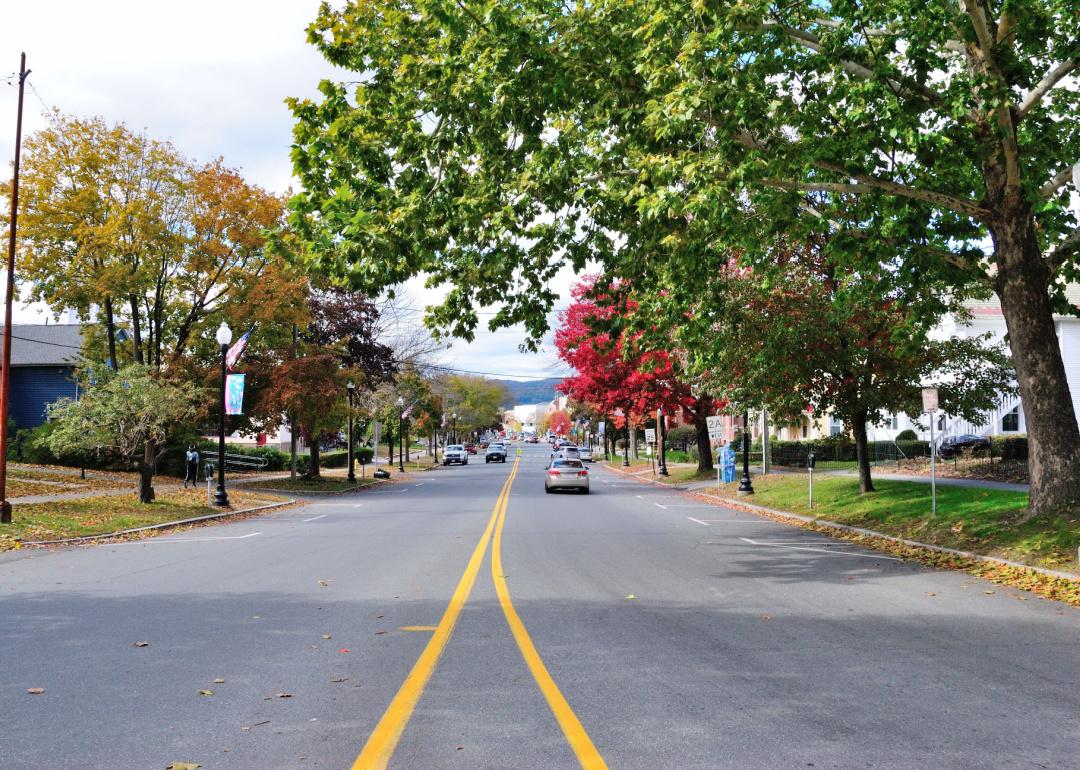
- Bridges in poor condition: 10.7% (33 of 308 bridges)
- Square meters of bridges in poor condition: 13.1% (16,724 of 127,679 square meters of bridges)

- Bridges in poor condition: 15.3% (60 of 392 bridges)
- Square meters of bridges in poor condition: 23.8% (91,405 of 383,561 square meters of bridges)
