Counties with the most bridges in Massachusetts
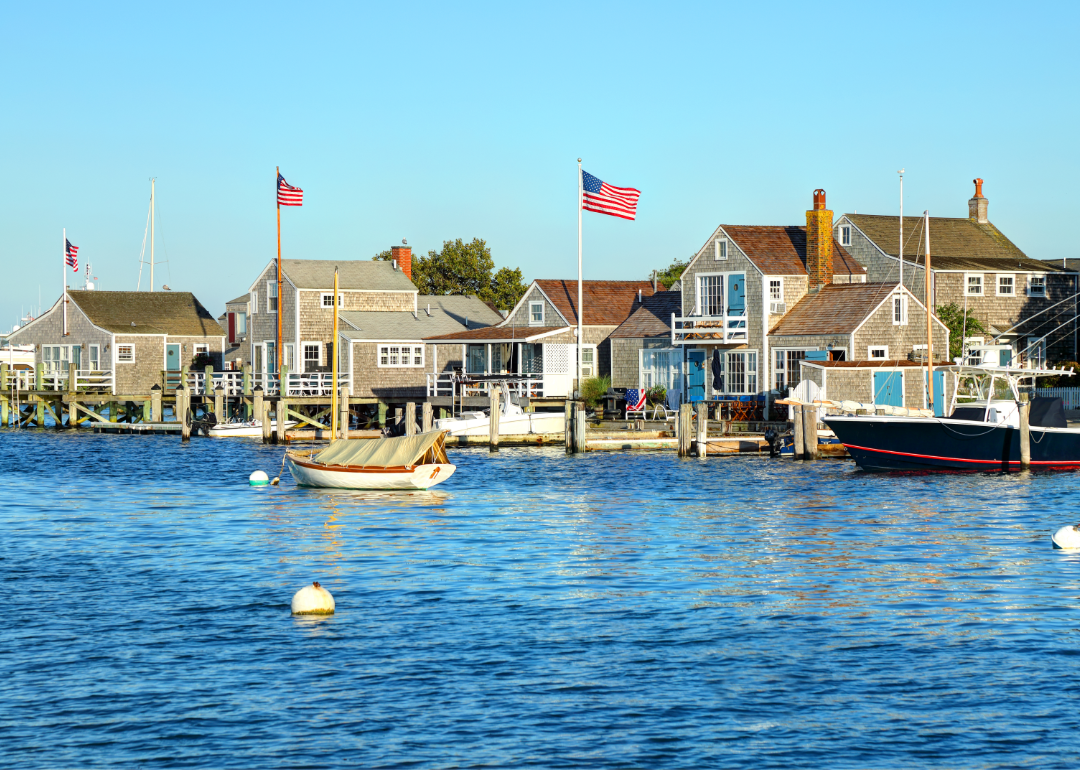
- Total bridges: 2 (0.0% of bridges in the state)
- Share of bridges in poor condition: 0.0%
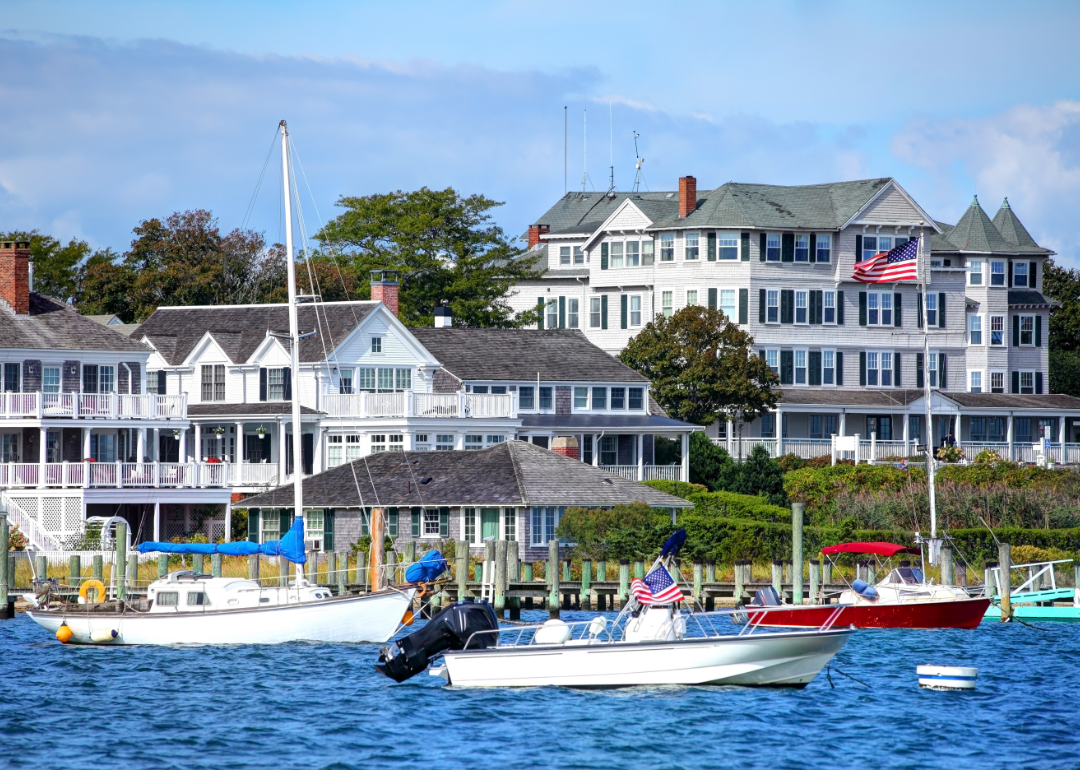
- Total bridges: 5 (0.1% of bridges in the state)
- Share of bridges in poor condition: 0.0%
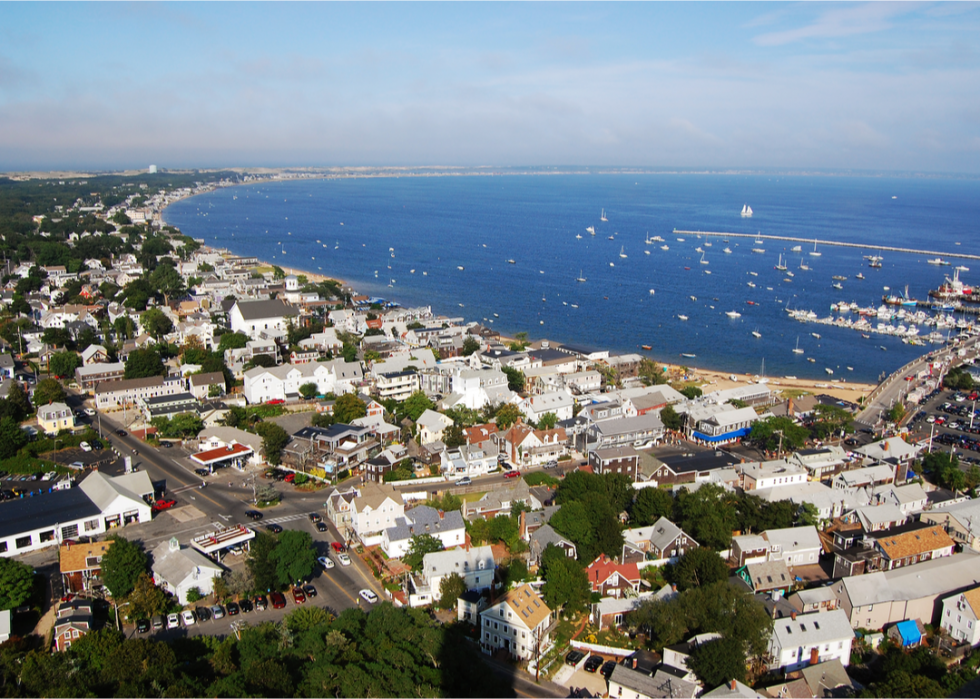
- Total bridges: 106 (2.0% of bridges in the state)
- Share of bridges in poor condition: 5.7%

- Total bridges: 259 (5.0% of bridges in the state)
- Share of bridges in poor condition: 9.3%
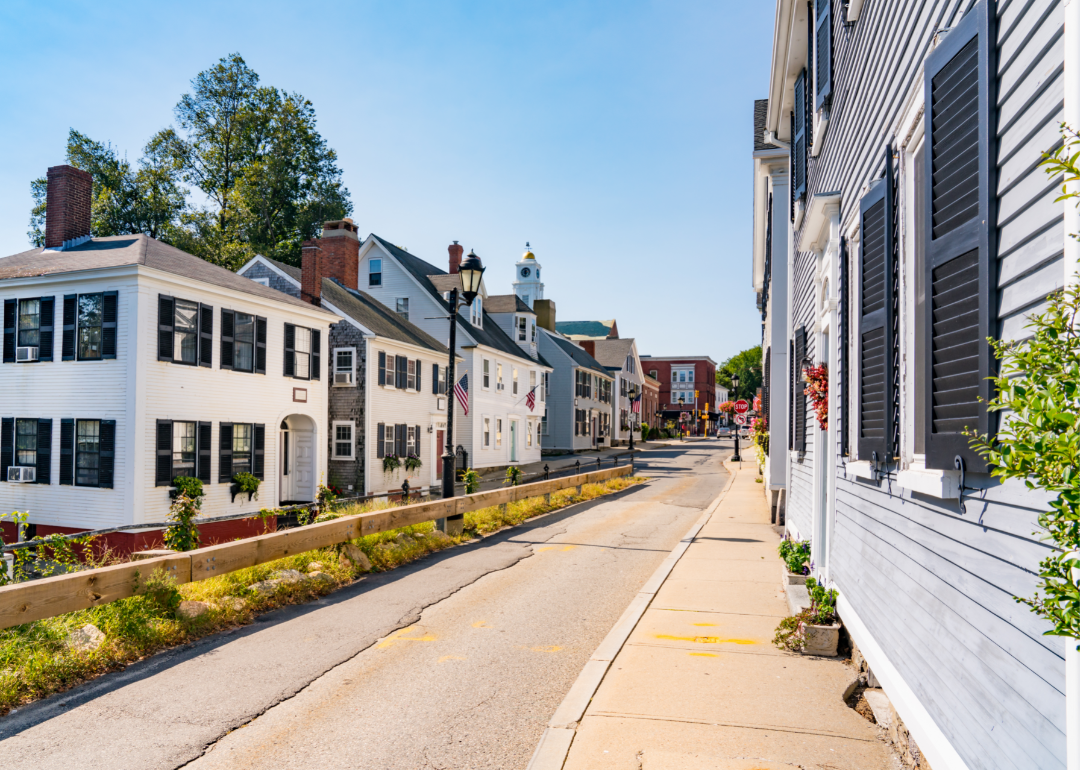
- Total bridges: 280 (5.4% of bridges in the state)
- Share of bridges in poor condition: 5.0%
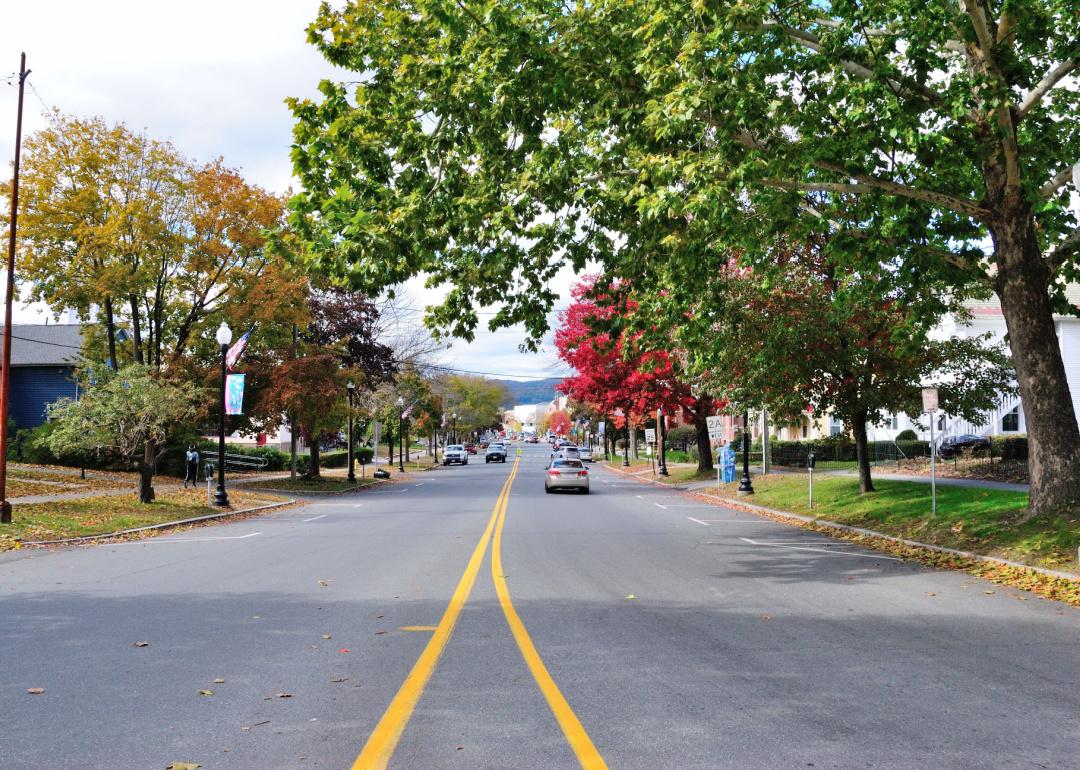
- Total bridges: 302 (5.8% of bridges in the state)
- Share of bridges in poor condition: 11.6%
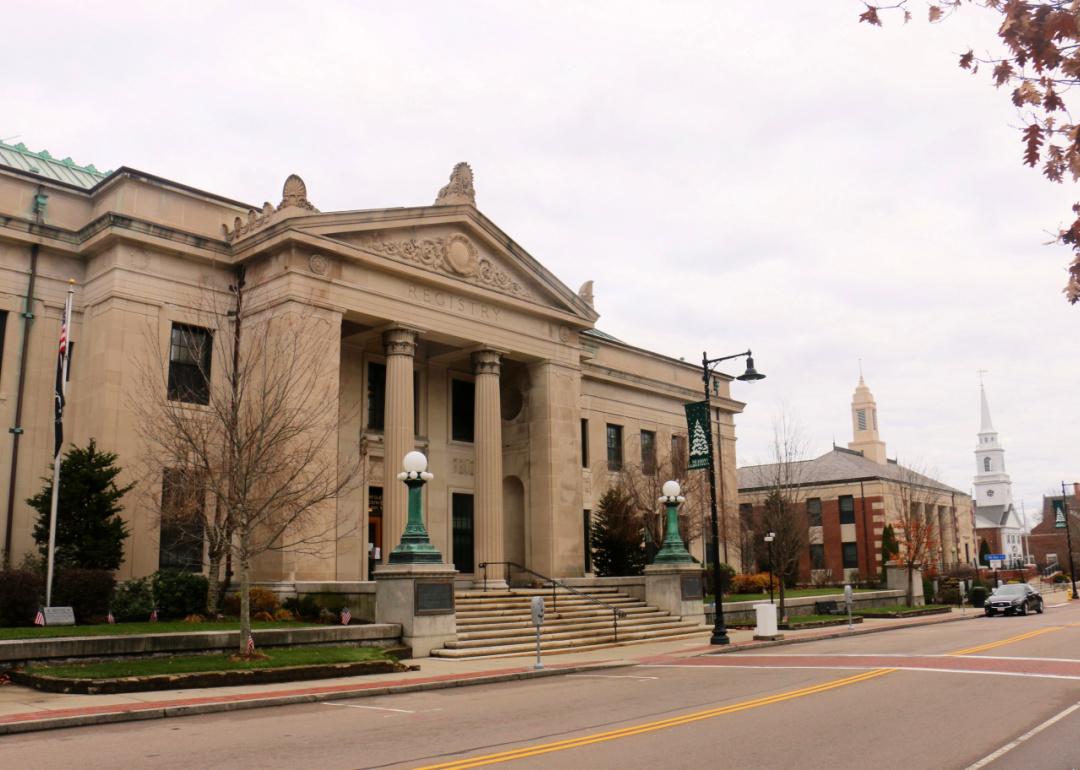
- Total bridges: 341 (6.5% of bridges in the state)
- Share of bridges in poor condition: 3.5%

- Total bridges: 389 (7.4% of bridges in the state)
- Share of bridges in poor condition: 8.2%

- Total bridges: 392 (7.5% of bridges in the state)
- Share of bridges in poor condition: 16.8%

- Total bridges: 429 (8.2% of bridges in the state)
- Share of bridges in poor condition: 7.2%

- Total bridges: 445 (8.5% of bridges in the state)
- Share of bridges in poor condition: 9.2%

- Total bridges: 493 (9.4% of bridges in the state)
- Share of bridges in poor condition: 11.0%

- Total bridges: 797 (15.2% of bridges in the state)
- Share of bridges in poor condition: 10.0%

- Total bridges: 989 (18.9% of bridges in the state)
- Share of bridges in poor condition: 7.8%
This story features data reporting and writing by Paxtyn Merten, and is part of a series utilizing data automation across 50 states.
