Metros where renters are the most overextended in Massachusetts

Canva
- Median gross rent as a percentage of household income: 29.1%
- Median rent: $1,126
- Number of renter-occupied homes: 125,393 (33.7% of all housing units)
- Median rent: $1,126
- Number of renter-occupied homes: 125,393 (33.7% of all housing units)
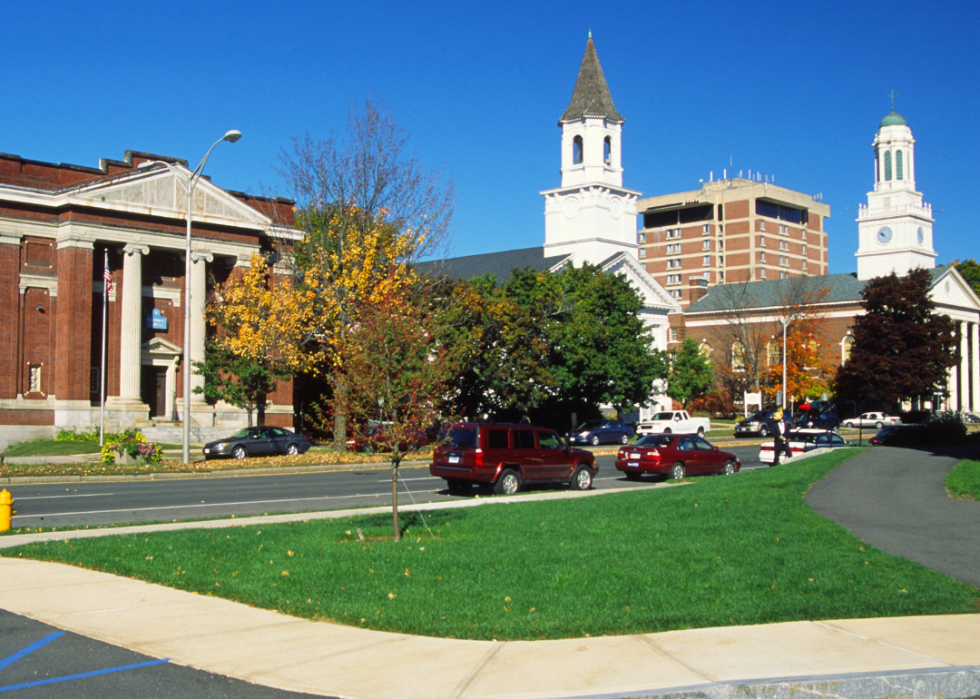
#6. Worcester

lunamarina // Shutterstock
- Median gross rent as a percentage of household income: 29.5%
- Median rent: $1,659
- Number of renter-occupied homes: 728,666 (38.5% of all housing units)
- Median rent: $1,659
- Number of renter-occupied homes: 728,666 (38.5% of all housing units)
#5. Boston

Canva
- Median gross rent as a percentage of household income: 30.6%
- Median rent: $1,462
- Number of renter-occupied homes: 1,814 (26.7% of all housing units)
- Median rent: $1,462
- Number of renter-occupied homes: 1,814 (26.7% of all housing units)
#4. Vineyard Haven
Canva
- Median gross rent as a percentage of household income: 31.4%
- Median rent: $943
- Number of renter-occupied homes: 16,621 (29.9% of all housing units)
- Median rent: $943
- Number of renter-occupied homes: 16,621 (29.9% of all housing units)
#3. Pittsfield

Canva
- Median gross rent as a percentage of household income: 31.4%
- Median rent: $1,008
- Number of renter-occupied homes: 100,054 (36.4% of all housing units)
- Median rent: $1,008
- Number of renter-occupied homes: 100,054 (36.4% of all housing units)
#2. Springfield
Wangkun Jia // Shutterstock
- Median gross rent as a percentage of household income: 33.3%
- Median rent: $1,408
- Number of renter-occupied homes: 18,864 (19.2% of all housing units)
- Median rent: $1,408
- Number of renter-occupied homes: 18,864 (19.2% of all housing units)
This story features data reporting by Elena Cox, writing by Andrea Vale, and is part of a series utilizing data automation across 50 states.
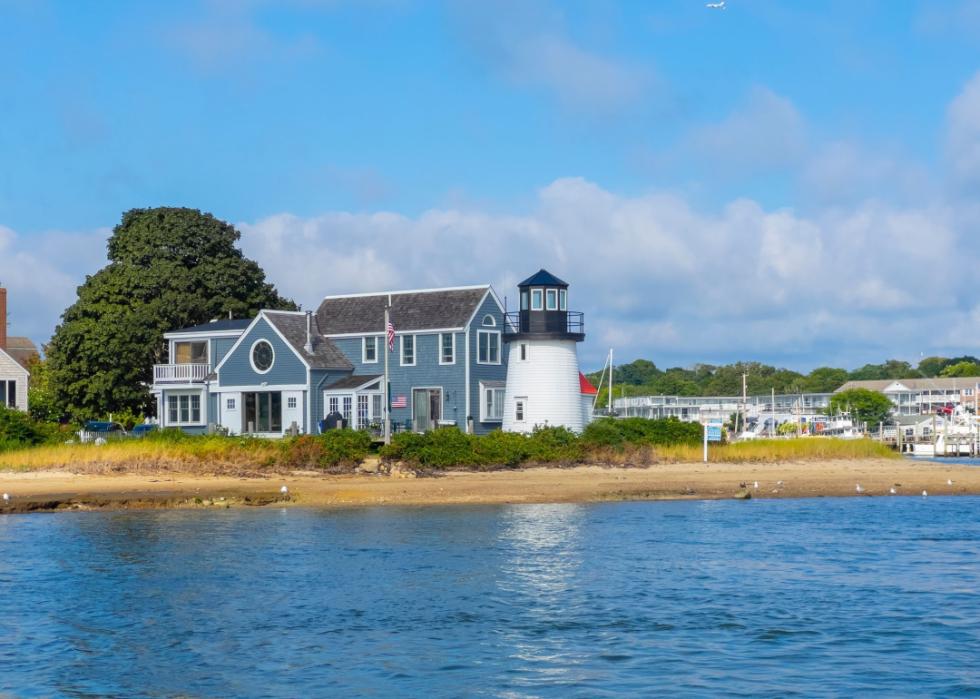
#1. Barnstable Town

Photo Illustration by Stacker // Canva