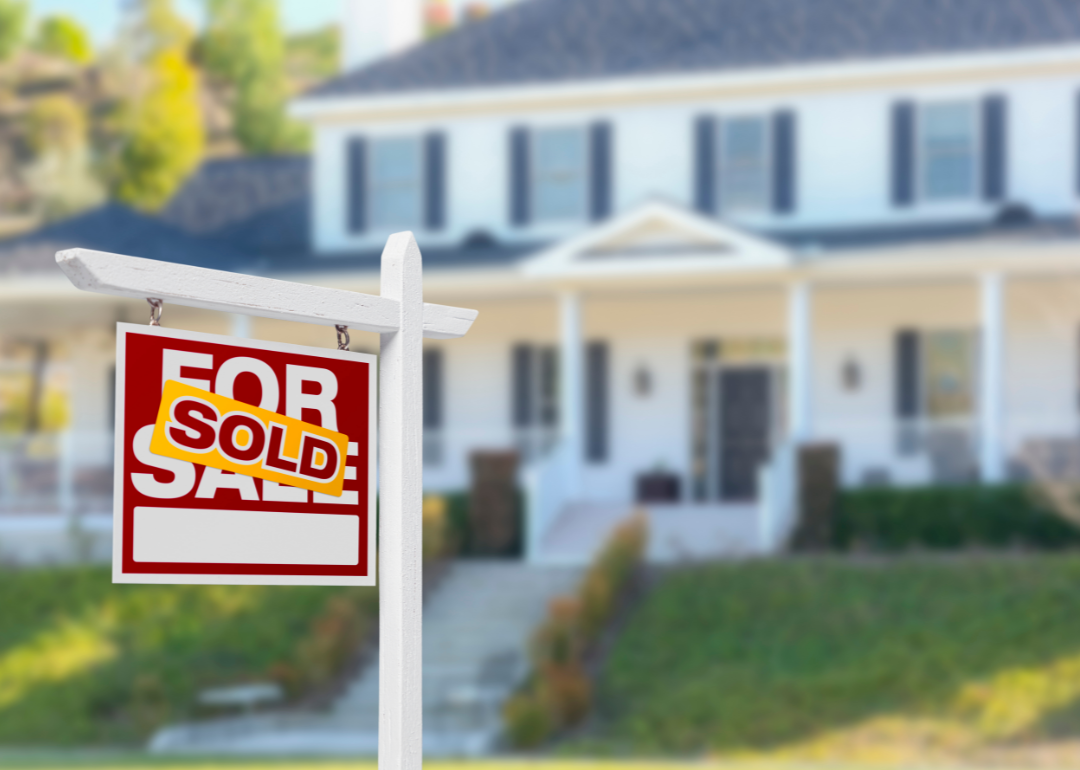
Counties with the most homes selling under list price in Mississippi
- Average price difference: 1.30% below list
-- Median list price: $333,558
-- Median sale price: $305,000
- Total homes sold: 229
-- Share that sold above list: 15.7%

- Average price difference: 1.76% below list
-- Median list price: $289,999
-- Median sale price: $279,950
- Total homes sold: 146
-- Share that sold above list: 14.4%

- Average price difference: 2.31% below list
-- Median list price: $385,500
-- Median sale price: $315,000
- Total homes sold: 128
-- Share that sold above list: 18.0%

- Average price difference: 2.90% below list
-- Median list price: $253,900
-- Median sale price: $252,699
- Total homes sold: 249
-- Share that sold above list: 9.2%

- Average price difference: 3.38% below list
-- Median list price: $248,900
-- Median sale price: $215,000
- Total homes sold: 144
-- Share that sold above list: 10.4%

- Average price difference: 6.56% below list
-- Median list price: $199,425
-- Median sale price: $104,000
- Total homes sold: 155
-- Share that sold above list: 8.4%
This story features data reporting and writing by Elena Cox and is part of a series utilizing data automation across 28 states.