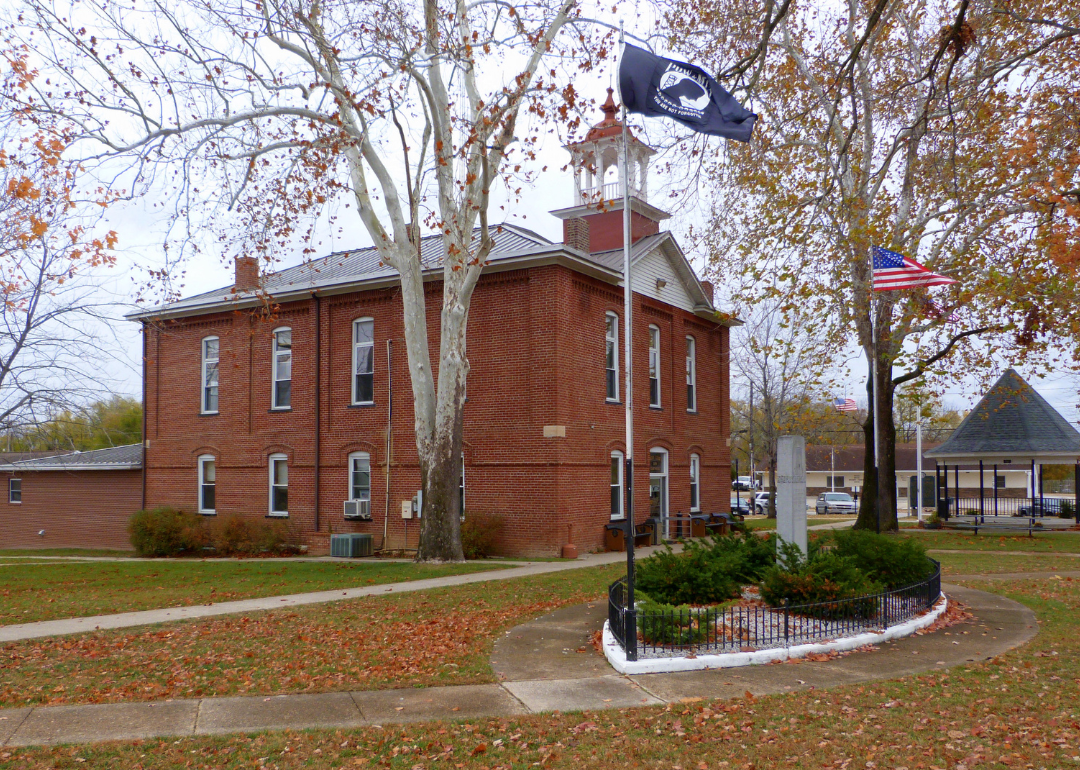
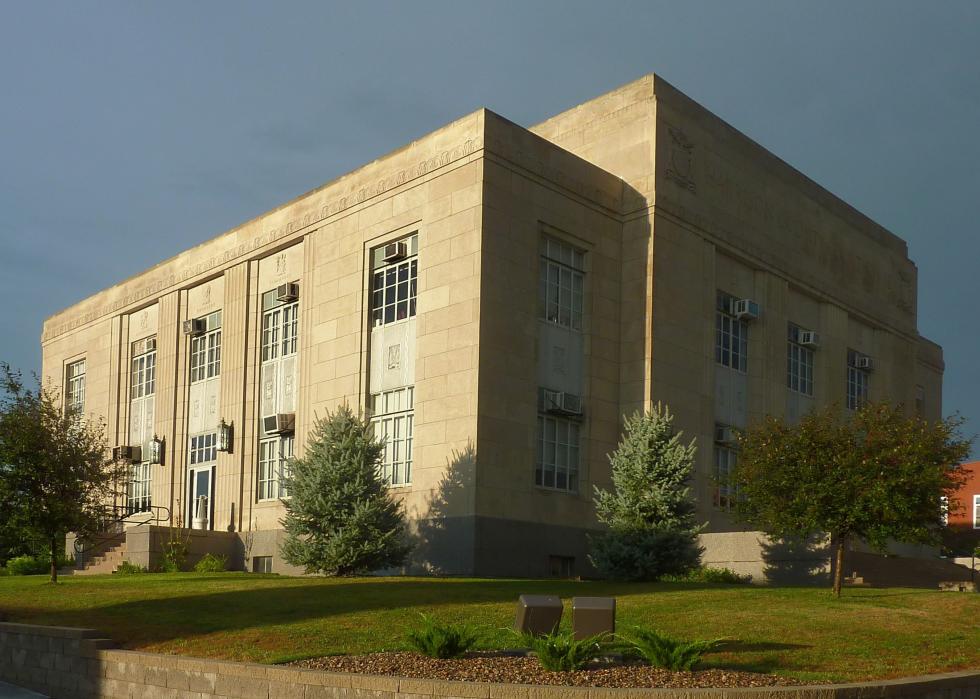
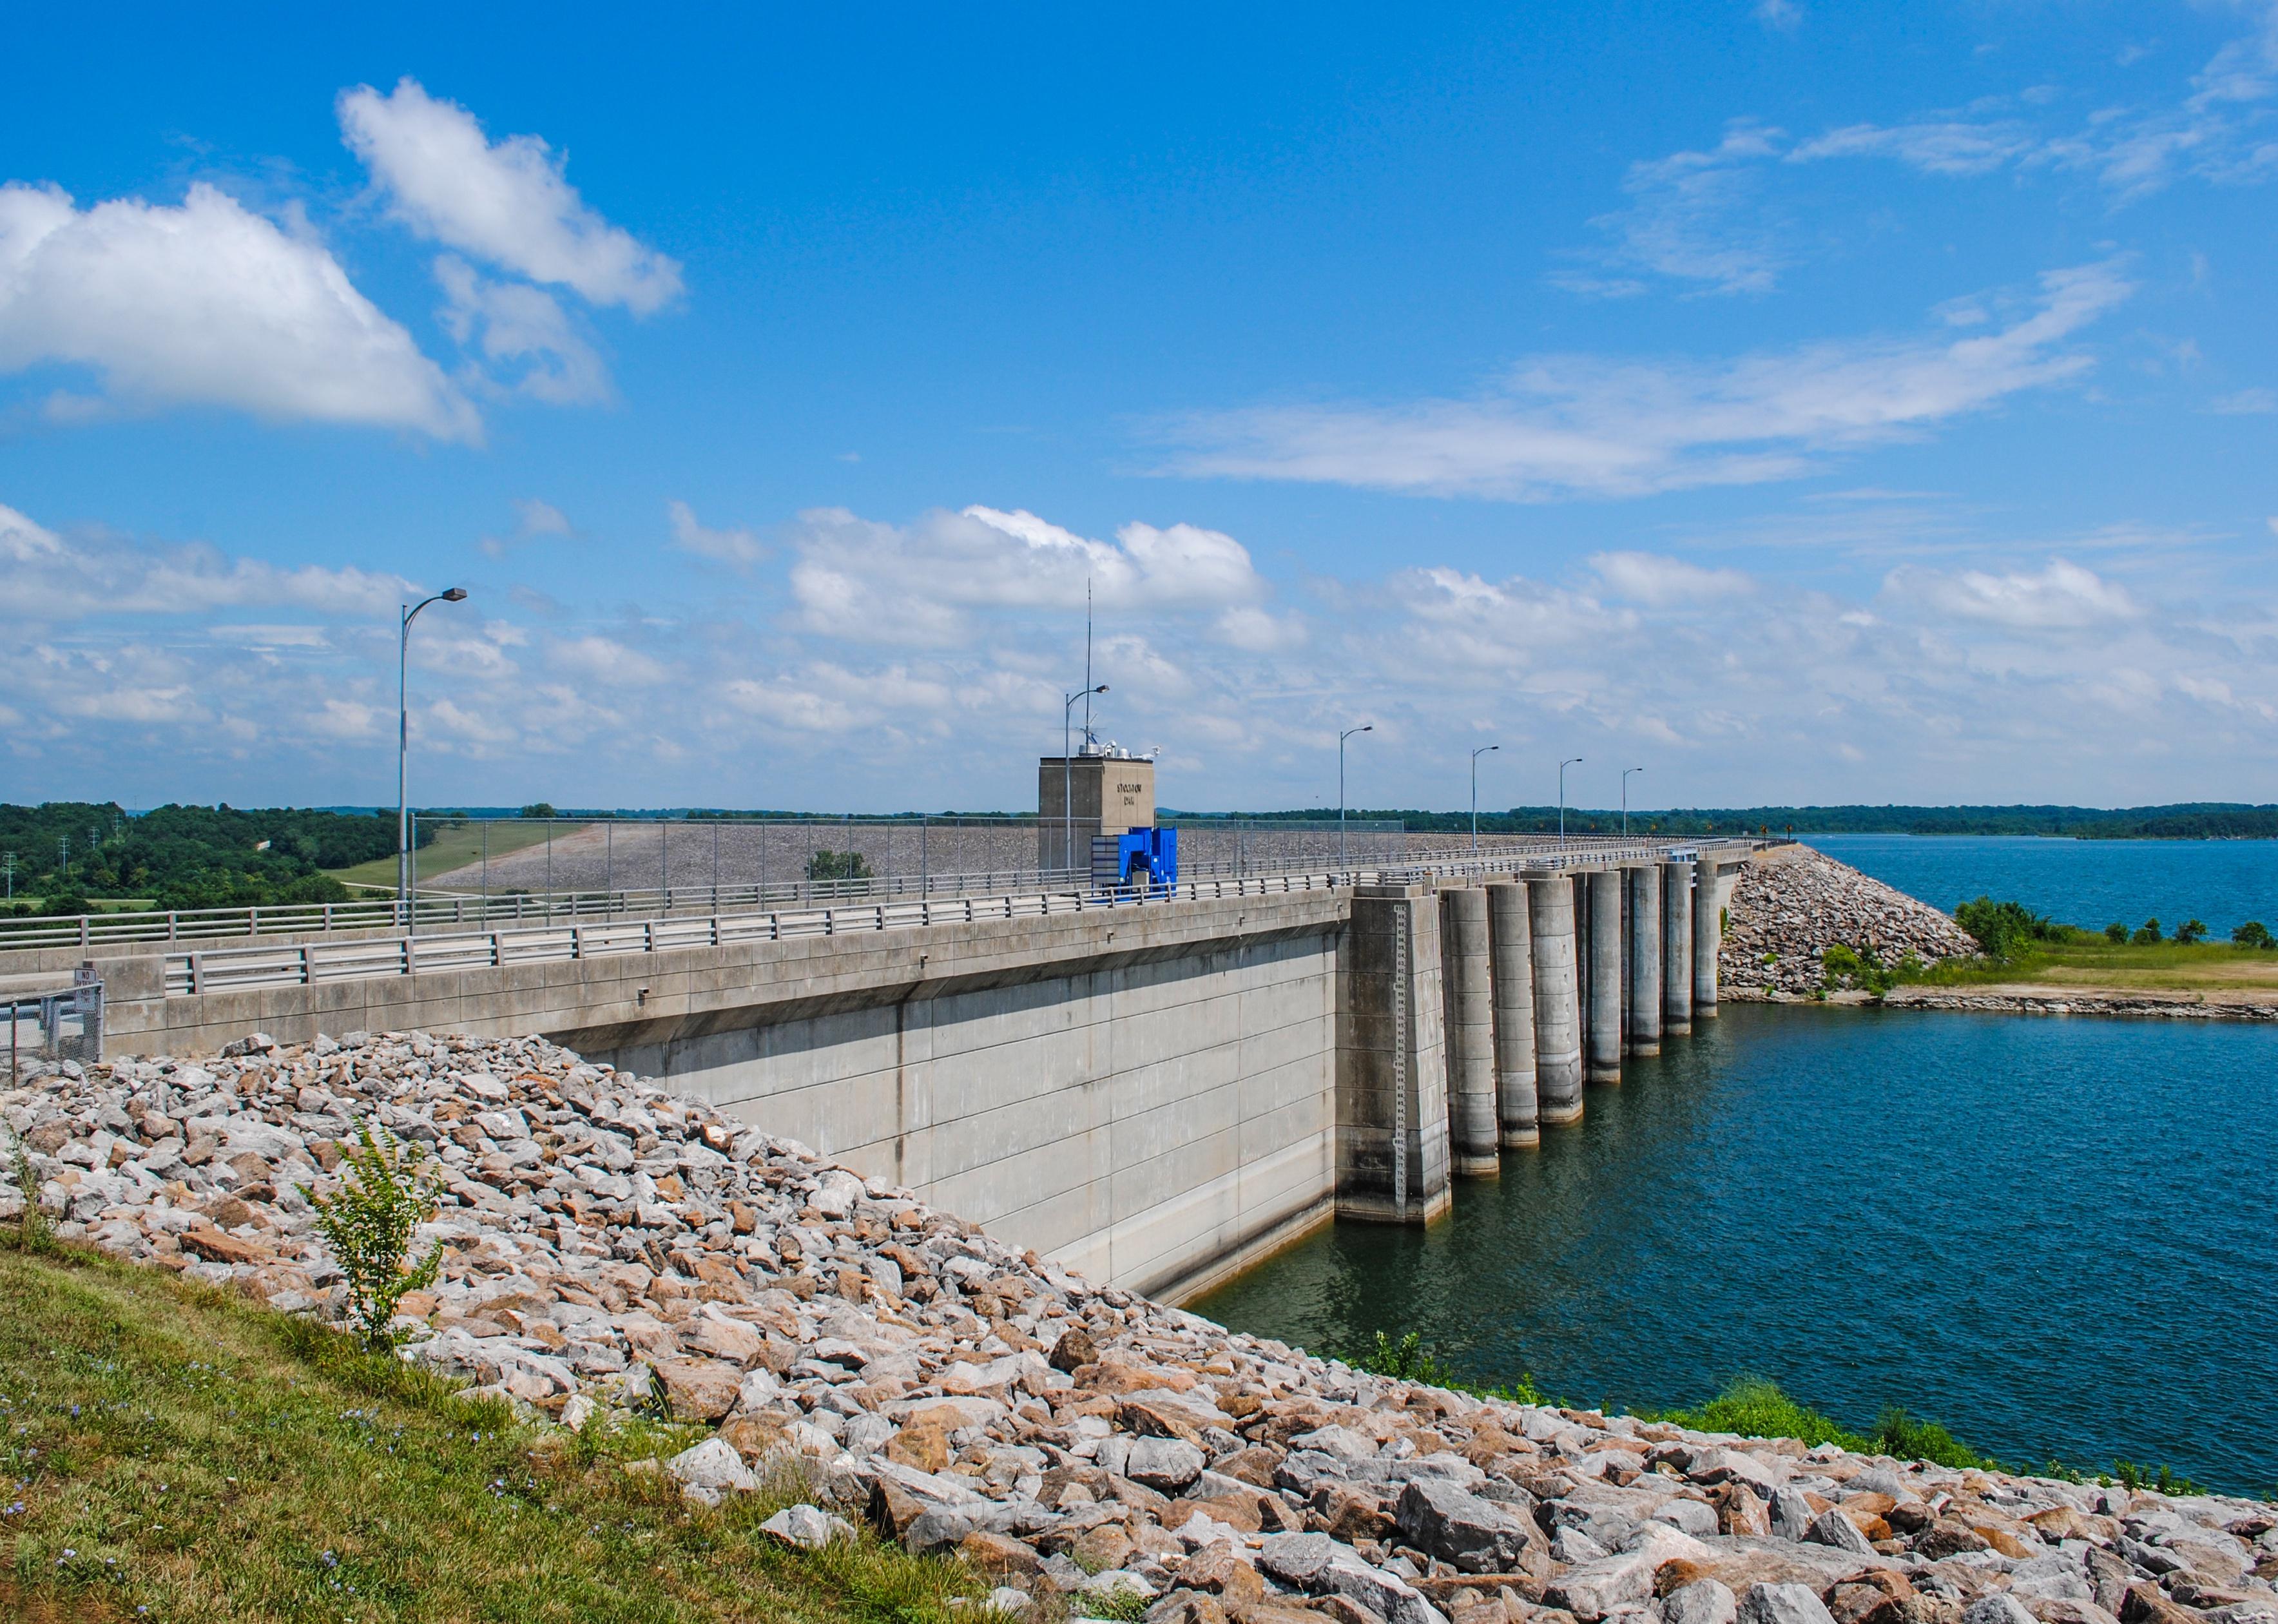
Counties with the most bridges in dire need of repair in Missouri
- Bridges in poor condition: 14.4% (18 of 125 bridges)
- Square meters of bridges in poor condition: 4.8% (1,220 of 25,626 square meters of bridges)

- Bridges in poor condition: 15.0% (16 of 107 bridges)
- Square meters of bridges in poor condition: 6.6% (1,665 of 25,130 square meters of bridges)
- Bridges in poor condition: 16.5% (31 of 188 bridges)
- Square meters of bridges in poor condition: 10.0% (4,138 of 41,298 square meters of bridges)
- Bridges in poor condition: 16.7% (27 of 162 bridges)
- Square meters of bridges in poor condition: 6.1% (3,997 of 65,006 square meters of bridges)
- Bridges in poor condition: 17.0% (28 of 165 bridges)
- Square meters of bridges in poor condition: 10.1% (7,198 of 71,613 square meters of bridges)
- Bridges in poor condition: 17.6% (33 of 187 bridges)
- Square meters of bridges in poor condition: 6.5% (4,074 of 62,876 square meters of bridges)

- Bridges in poor condition: 18.0% (25 of 139 bridges)
- Square meters of bridges in poor condition: 12.6% (7,200 of 57,296 square meters of bridges)
- Bridges in poor condition: 18.1% (15 of 83 bridges)
- Square meters of bridges in poor condition: 21.8% (3,976 of 18,261 square meters of bridges)
- Bridges in poor condition: 18.4% (25 of 136 bridges)
- Square meters of bridges in poor condition: 2.6% (1,836 of 69,758 square meters of bridges)
- Bridges in poor condition: 18.6% (13 of 70 bridges)
- Square meters of bridges in poor condition: 33.7% (8,094 of 24,047 square meters of bridges)

- Bridges in poor condition: 18.9% (60 of 317 bridges)
- Square meters of bridges in poor condition: 10.1% (6,335 of 62,999 square meters of bridges)
- Bridges in poor condition: 19.0% (11 of 58 bridges)
- Square meters of bridges in poor condition: 36.7% (6,088 of 16,586 square meters of bridges)

- Bridges in poor condition: 20.0% (20 of 100 bridges)
- Square meters of bridges in poor condition: 12.0% (3,720 of 30,983 square meters of bridges)
- Bridges in poor condition: 20.2% (68 of 336 bridges)
- Square meters of bridges in poor condition: 13.0% (8,705 of 67,039 square meters of bridges)
- Bridges in poor condition: 20.3% (76 of 375 bridges)
- Square meters of bridges in poor condition: 9.0% (8,007 of 88,912 square meters of bridges)
- Bridges in poor condition: 20.9% (38 of 182 bridges)
- Square meters of bridges in poor condition: 13.7% (6,188 of 45,153 square meters of bridges)
- Bridges in poor condition: 22.1% (25 of 113 bridges)
- Square meters of bridges in poor condition: 20.2% (6,808 of 33,777 square meters of bridges)
- Bridges in poor condition: 22.4% (90 of 401 bridges)
- Square meters of bridges in poor condition: 12.4% (11,509 of 92,899 square meters of bridges)
- Bridges in poor condition: 25.2% (35 of 139 bridges)
- Square meters of bridges in poor condition: 19.3% (6,137 of 31,839 square meters of bridges)
- Bridges in poor condition: 26.2% (58 of 221 bridges)
- Square meters of bridges in poor condition: 8.7% (7,063 of 81,117 square meters of bridges)
