Where U.S. residents are experiencing the most financial instability
SmartAsset
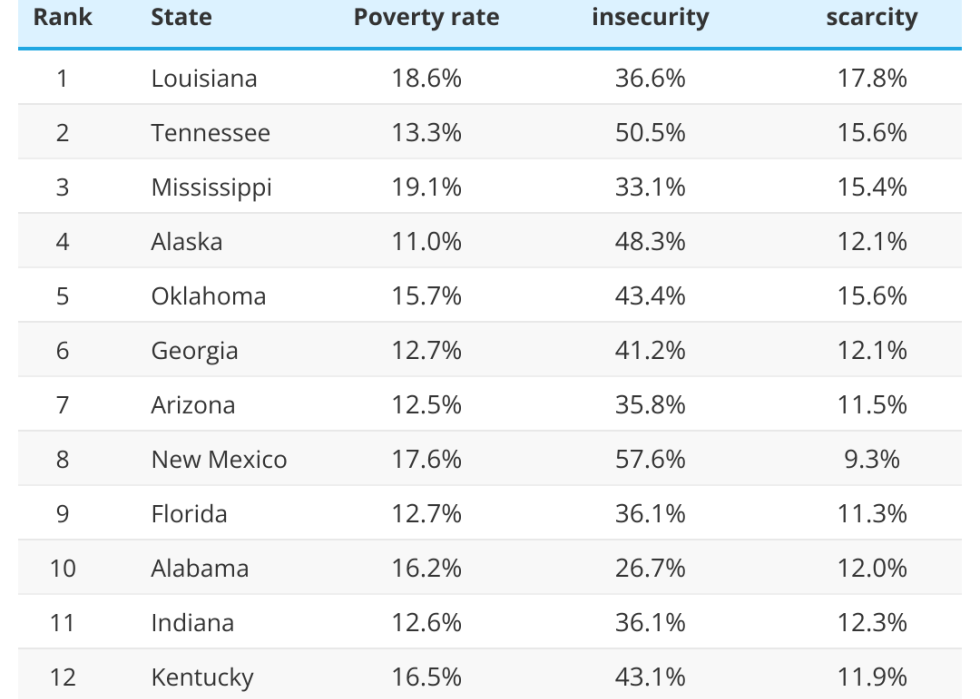
- Louisiana
- Poverty rate: 18.6%
- Unemployment rate, 2024: 4.2%
- Two-year change in unemployment: -0.1%
- Unemployment benefits replacement rate: 29.9%
- Housing insecurity: 36.6%
- Food scarcity: 17.8%
- Tennessee
- Poverty rate: 13.3%
- Unemployment rate, 2024: 3.3%
- Two-year change in unemployment: -0.1%
- Unemployment benefits replacement rate: 27.2%
- Housing insecurity: 50.5%
- Food scarcity: 15.6%
- Mississippi
- Poverty rate: 19.1%
- Unemployment rate, 2024: 3.1%
- Two-year change in unemployment: -1.4%
- Unemployment benefits replacement rate: 29.9%
- Housing insecurity: 33.1%
- Food scarcity: 15.4%
- Alaska
- Poverty rate: 11.0%
- Unemployment rate, 2024: 4.6%
- Two-year change in unemployment: -0.7%
- Unemployment benefits replacement rate: 26.7%
- Housing insecurity: 48.3%
- Food scarcity: 12.1%
- Oklahoma
- Poverty rate: 15.7%
- Unemployment rate, 2024: 3.6%
- Two-year change in unemployment: 1.0%
- Unemployment benefits replacement rate: 42.6%
- Housing insecurity: 43.4%
- Food scarcity: 15.6%
- Georgia
- Poverty rate: 12.7%
- Unemployment rate, 2024: 3.1%
- Two-year change in unemployment: -0.1%
- Unemployment benefits replacement rate: 29.0%
- Housing insecurity: 41.2%
- Food scarcity: 12.1%
- Arizona
- Poverty rate: 12.5%
- Unemployment rate, 2024: 4.1%
- Two-year change in unemployment: 0.5%
- Unemployment benefits replacement rate: 30.2%
- Housing insecurity: 35.8%
- Food scarcity: 11.5%
- New Mexico
- Poverty rate: 17.6%
- Unemployment rate, 2024: 3.9%
- Two-year change in unemployment: -1.7%
- Unemployment benefits replacement rate: 41.3%
- Housing insecurity: 57.6%
- Food scarcity: 9.3%
- Florida
- Poverty rate: 12.7%
- Unemployment rate, 2024: 3.1%
- Two-year change in unemployment: -0.2%
- Unemployment benefits replacement rate: 26.4%
- Housing insecurity: 36.1%
- Food scarcity: 11.3%
- Alabama
- Poverty rate: 16.2%
- Unemployment rate, 2024: 3.0%
- Two-year change in unemployment: 0.0%
- Unemployment benefits replacement rate: 29.8%
- Housing insecurity: 26.7%
- Food scarcity: 12.0%
10 places where residents are most financially sound
- Hawaii
- Poverty rate: 10.2%
- Unemployment rate, 2024: 3.1%
- Two-year change in unemployment: -1.1%
- Unemployment benefits replacement rate: 49.3%
- Housing insecurity: 22.3%
- Food scarcity: 5.7%
- North Dakota
- Poverty rate: 11.5%
- Unemployment rate, 2024: 2.0%
- Two-year change in unemployment: -0.9%
- Unemployment benefits replacement rate: 48.0%
- Housing insecurity: 16.7%
- Food scarcity: 7.6%
- Maine
- Poverty rate: 10.8%
- Unemployment rate, 2024: 3.4%
- Two-year change in unemployment: -0.6%
- Unemployment benefits replacement rate: 45.9%
- Housing insecurity: 17.2%
- Food scarcity: 7.6%
- Iowa
- Poverty rate: 11.0%
- Unemployment rate, 2024: 3.0%
- Two-year change in unemployment: -0.5%
- Unemployment benefits replacement rate: 45.7%
- Housing insecurity: 19.1%
- Food scarcity: 8.7%
- Vermont
- Poverty rate: 10.4%
- Unemployment rate, 2024: 2.3%
- Two-year change in unemployment: -0.6%
- Unemployment benefits replacement rate: 47.6%
- Housing insecurity: 32.4%
- Food scarcity: 8.1%
- Utah
- Poverty rate: 8.2%
- Unemployment rate, 2024: 2.8%
- Two-year change in unemployment: 0.7%
- Unemployment benefits replacement rate: 43.9%
- Housing insecurity: 14.1%
- Food scarcity: 10.9%
- Massachusetts
- Poverty rate: 10.4%
- Unemployment rate, 2024: 2.9%
- Two-year change in unemployment: -1.8%
- Unemployment benefits replacement rate: 43.3%
- Housing insecurity: 28.9%
- Food scarcity: 8.4%
- Minnesota
- Poverty rate: 9.6%
- Unemployment rate, 2024: 2.7%
- Two-year change in unemployment: 0.0%
- Unemployment benefits replacement rate: 44.5%
- Housing insecurity: 23.7%
- Food scarcity: 9.2%
- Colorado
- Poverty rate: 9.4%
- Unemployment rate, 2024: 3.5%
- Two-year change in unemployment: -0.5%
- Unemployment benefits replacement rate: 42.8%
- Housing insecurity: 21.9%
- Food scarcity: 8.4%
- Delaware
- Poverty rate: 9.4%
- Unemployment rate, 2024: 4.0%
- Two-year change in unemployment: -0.6%
- Unemployment benefits replacement rate: 42.2%
- Housing insecurity: 21.1%
- Food scarcity: 8.2%
Data and Methodology
To find the states where residents are financially hurting most, SmartAsset analyzed six metrics for U.S. states.
- Poverty rate. This is the percentage of residents living below the poverty line. Data comes from the U.S. Census Bureau's 2022 1-year American Community Survey.
- Unemployment rate. Data is for February 2024 and comes from the Bureau of Labor Statistics' Local Area Unemployment Statistics.
- Two-year change in unemployment rate. This is the two-year percentage point difference between the February 2024 unemployment rate and February 2022 unemployment rate. Data comes from the Bureau of Labor Statistics' Local Area Unemployment Statistics.
- Unemployment benefit replacement rate. This is the ratio of the average unemployment benefit received to the average worker's weekly salary. Data comes from the U.S. Department of Labor and is annual for 2023.
- Percentage of adults experiencing recent housing insecurity. This is the percentage of households not current on rent or mortgage where eviction or foreclosure in the next two months is either very likely or somewhat likely. Data comes from the Census Bureau's Household Pulse Survey. Respondents were surveyed from March 5, 2024 through April 1, 2024.
- Percentage of adults experiencing recent food insufficiency. This is the percentage of adults in households where there was either sometimes or often not enough to eat in the last seven days. Data comes from the Census Bureau's Household Pulse Survey. Respondents were surveyed from March 5, 2024 through April 1, 2024.
The following metrics were half-weighted: unemployment rate and two-year change in the unemployment rate.
10 places where residents are hurting most financially

Carlos M. Silva // Shutterstock