Counties with the highest rates of strokes in Montana
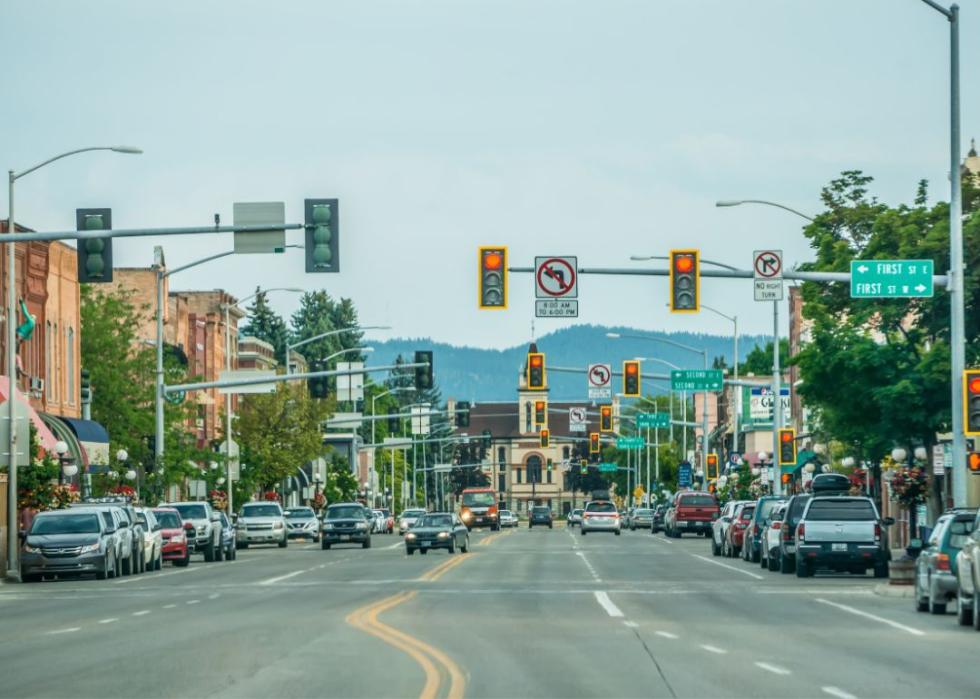
- Death rate for ischemic strokes, 2018-20: 15.5 per 100K people
- Death rate for hemorrhagic strokes, 2018-20: 7.8 per 100K people

- Death rate for ischemic strokes, 2018-20: 15.9 per 100K people
- Death rate for hemorrhagic strokes, 2018-20: 7.9 per 100K people
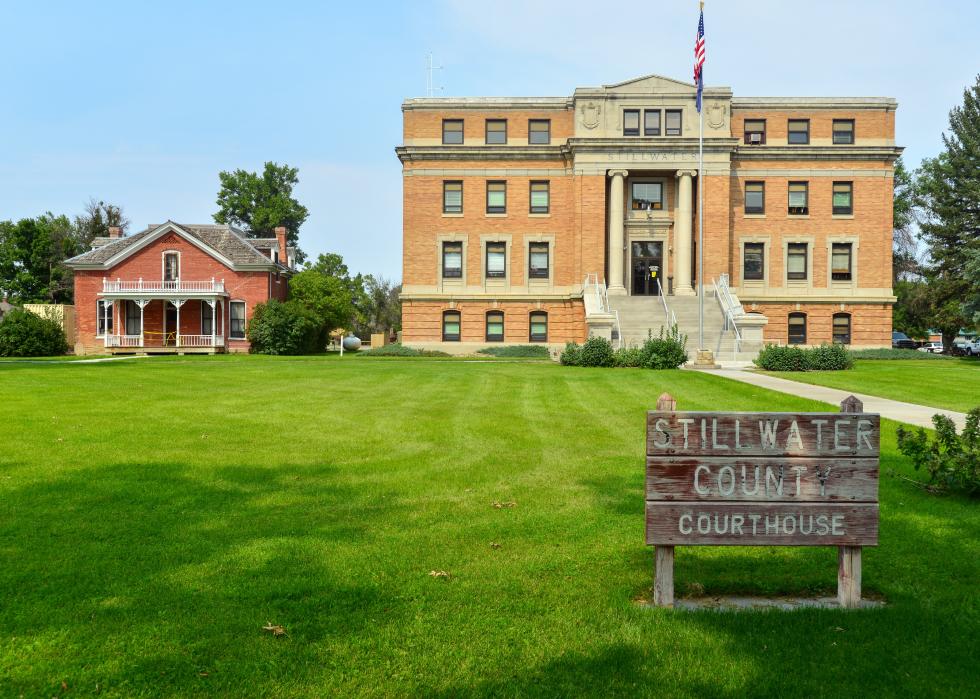
- Death rate for ischemic strokes, 2018-20: 16.6 per 100K people
- Death rate for hemorrhagic strokes, 2018-20: 9.1 per 100K people
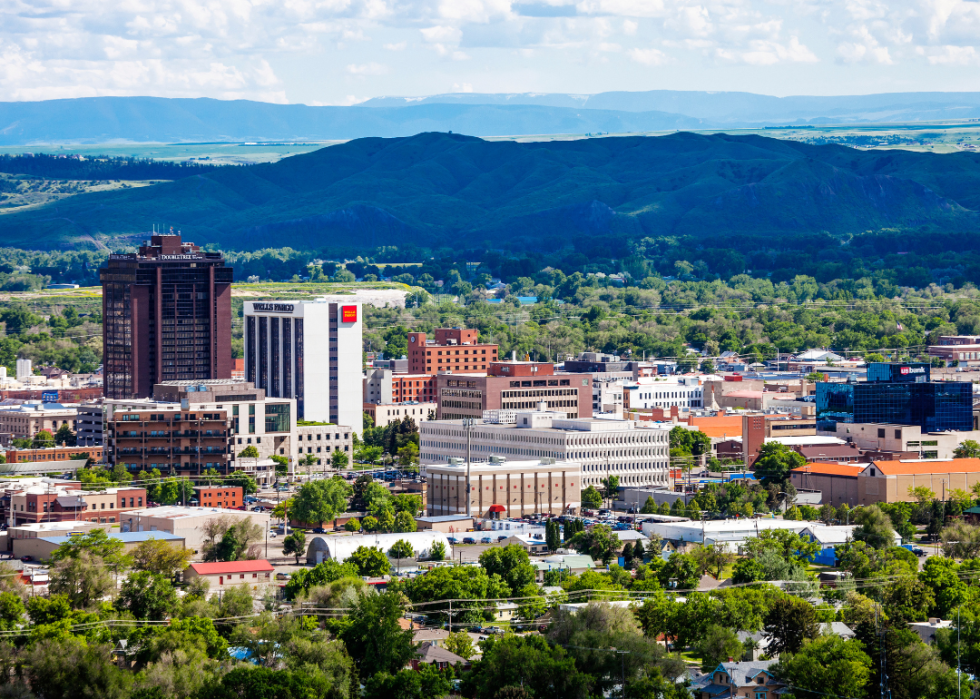
- Death rate for ischemic strokes, 2018-20: 16.6 per 100K people
- Death rate for hemorrhagic strokes, 2018-20: 9.5 per 100K people
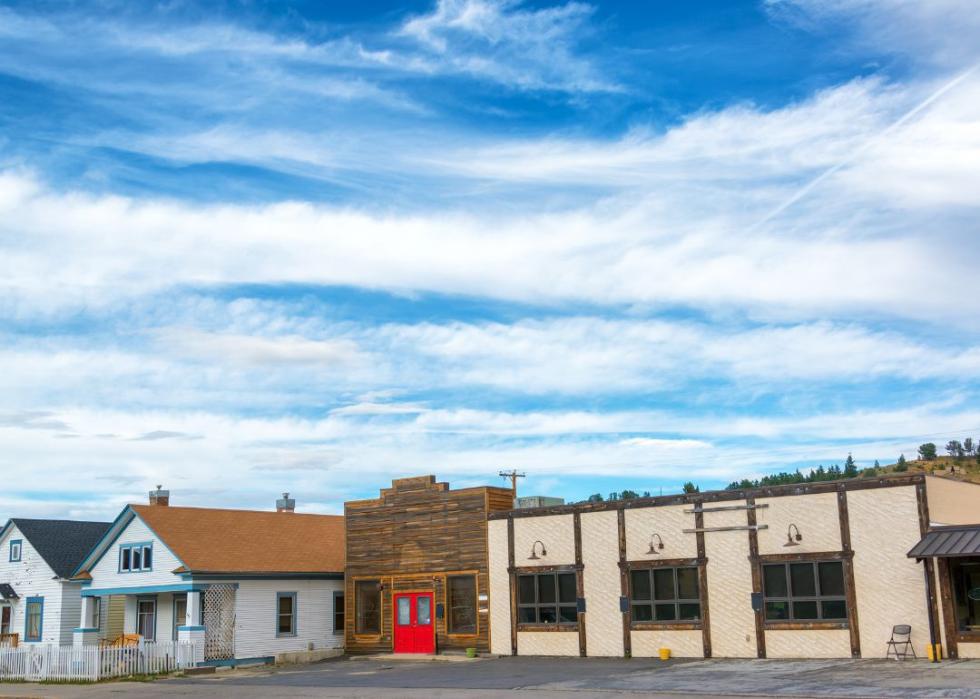
- Death rate for ischemic strokes, 2018-20: 18.5 per 100K people
- Death rate for hemorrhagic strokes, 2018-20: 9.3 per 100K people
You may also like: Highest NFL draft picks from Montana

- Death rate for ischemic strokes, 2018-20: 12.1 per 100K people
- Death rate for hemorrhagic strokes, 2018-20: 11.3 per 100K people
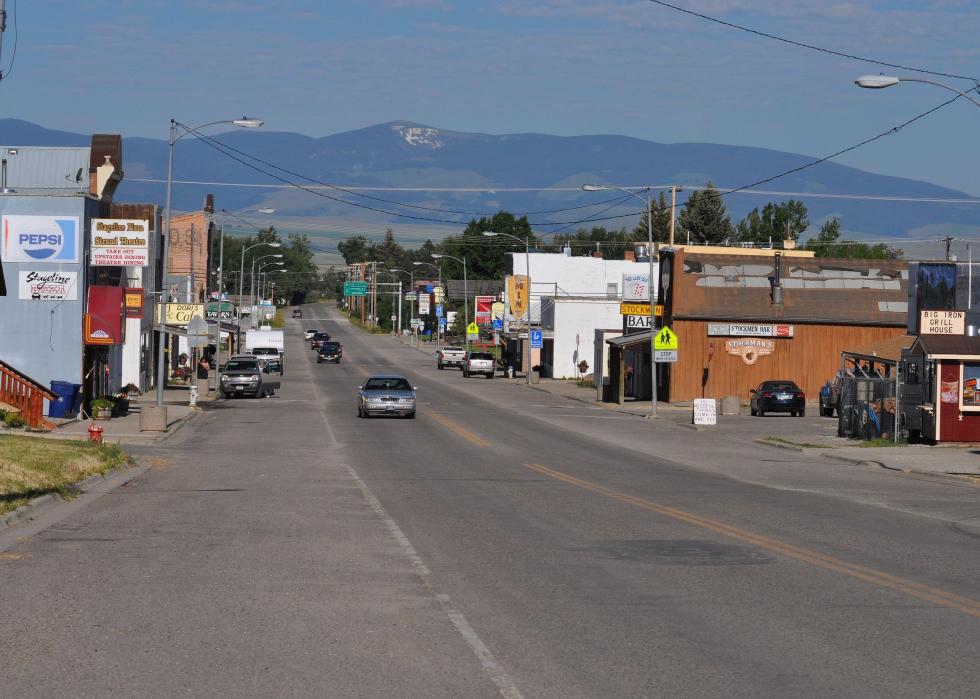
- Death rate for ischemic strokes, 2018-20: 13.9 per 100K people
- Death rate for hemorrhagic strokes, 2018-20: 6.6 per 100K people
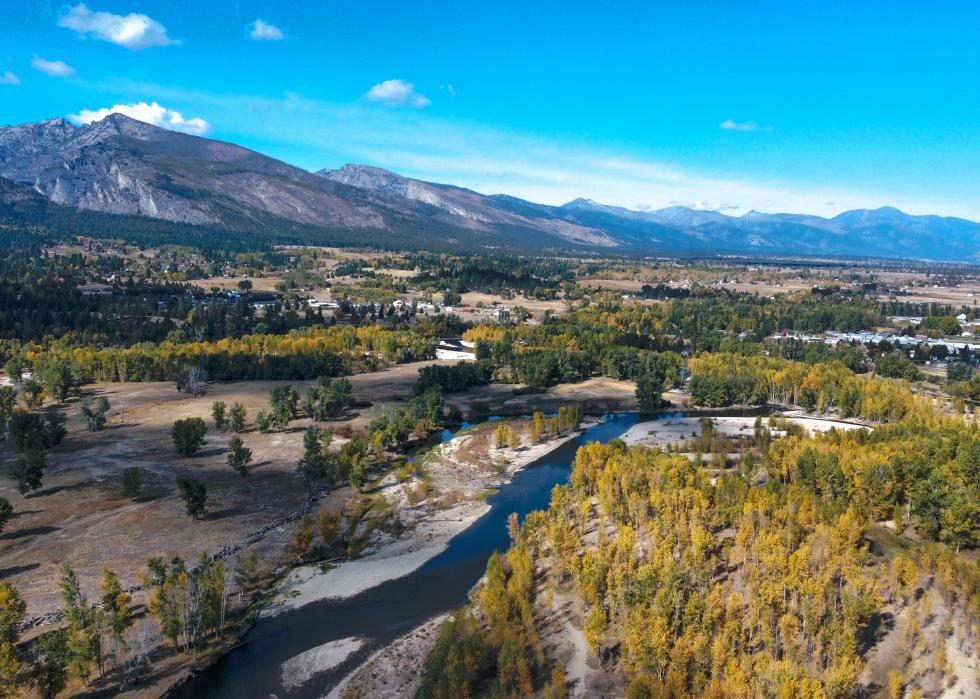
- Death rate for ischemic strokes, 2018-20: 14.2 per 100K people
- Death rate for hemorrhagic strokes, 2018-20: 7.5 per 100K people
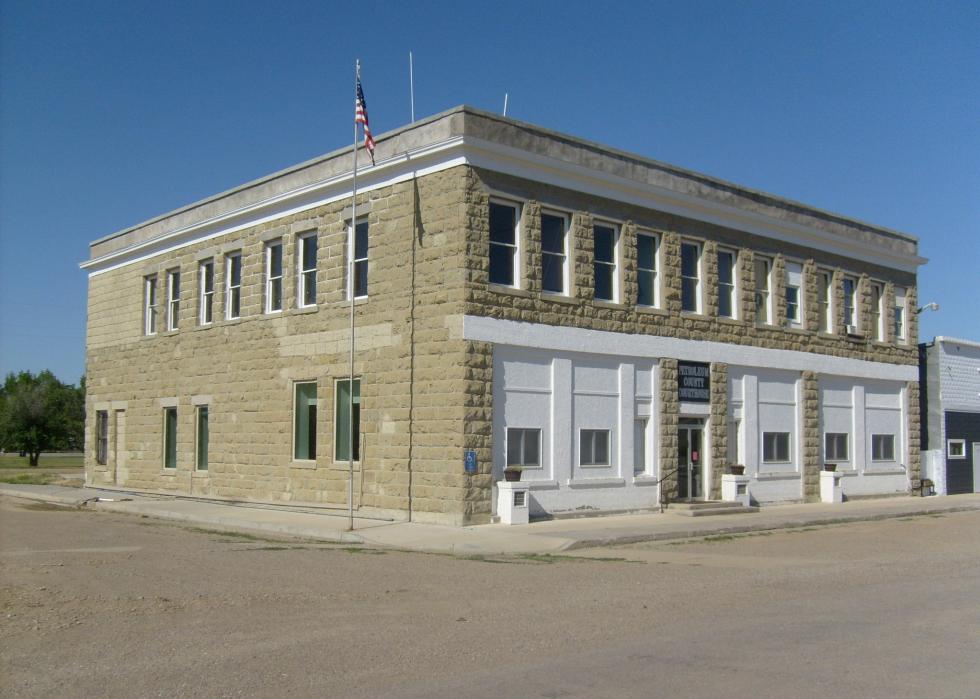
- Death rate for ischemic strokes, 2018-20: 15.9 per 100K people
- Death rate for hemorrhagic strokes, 2018-20: -1.0 per 100K people

- Death rate for ischemic strokes, 2018-20: 21.3 per 100K people
- Death rate for hemorrhagic strokes, 2018-20: -1.0 per 100K people
You may also like: Counties with the most college graduates in Montana
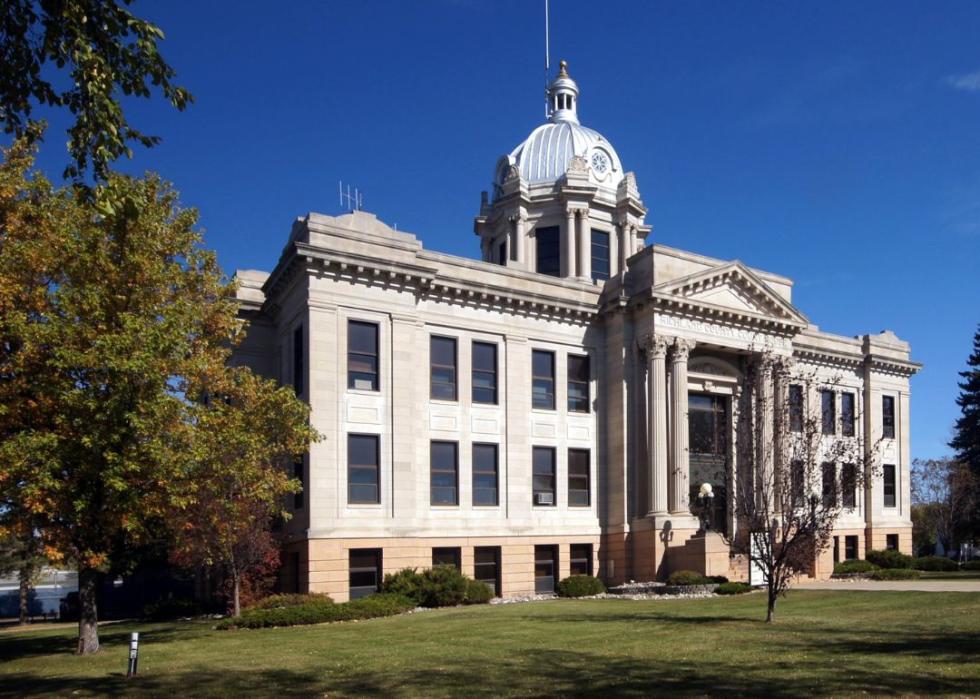
- Death rate for ischemic strokes, 2018-20: 21.5 per 100K people
- Death rate for hemorrhagic strokes, 2018-20: 9.0 per 100K people

- Death rate for ischemic strokes, 2018-20: 24.3 per 100K people
- Death rate for hemorrhagic strokes, 2018-20: 3.6 per 100K people
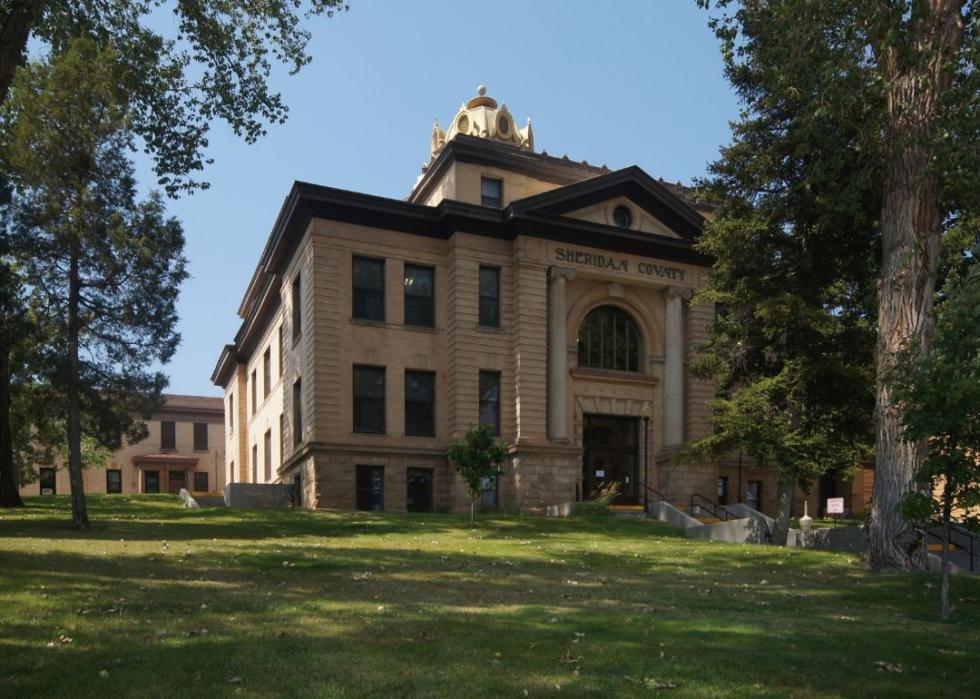
- Death rate for ischemic strokes, 2018-20: 26.9 per 100K people
- Death rate for hemorrhagic strokes, 2018-20: 9.2 per 100K people
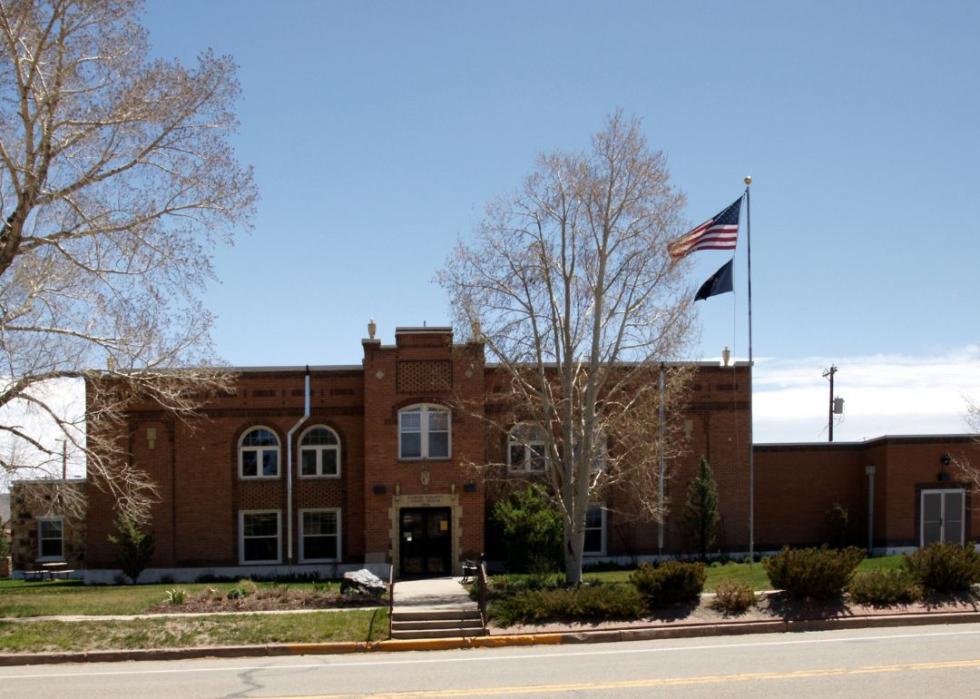
- Death rate for ischemic strokes, 2018-20: 10.8 per 100K people
- Death rate for hemorrhagic strokes, 2018-20: 12.5 per 100K people
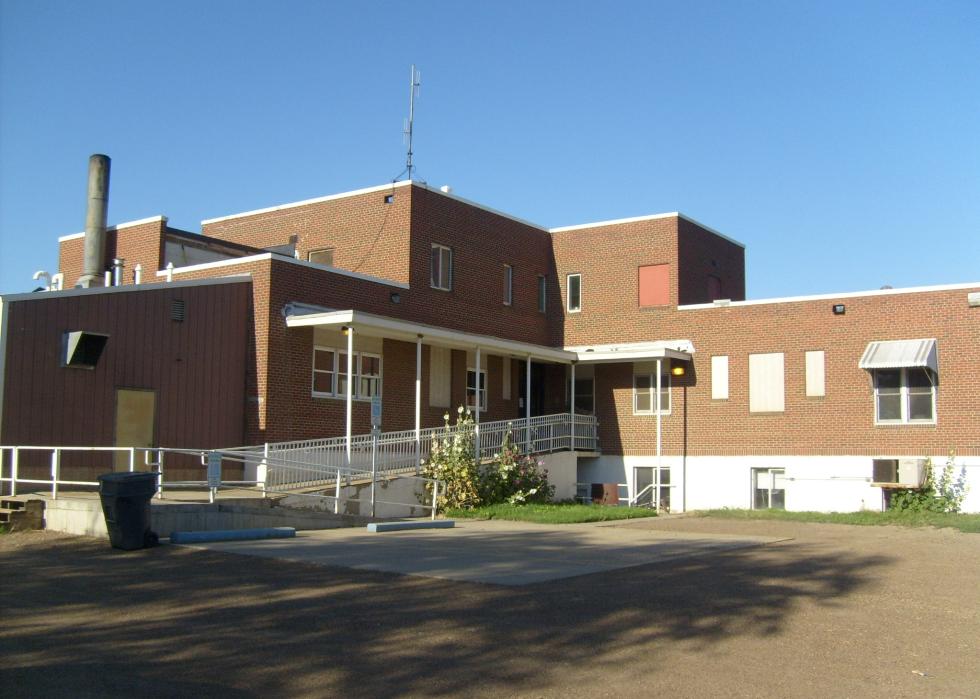
- Death rate for ischemic strokes, 2018-20: 11.8 per 100K people
- Death rate for hemorrhagic strokes, 2018-20: -1.0 per 100K people
You may also like: Most popular girl names in the 60s in Montana
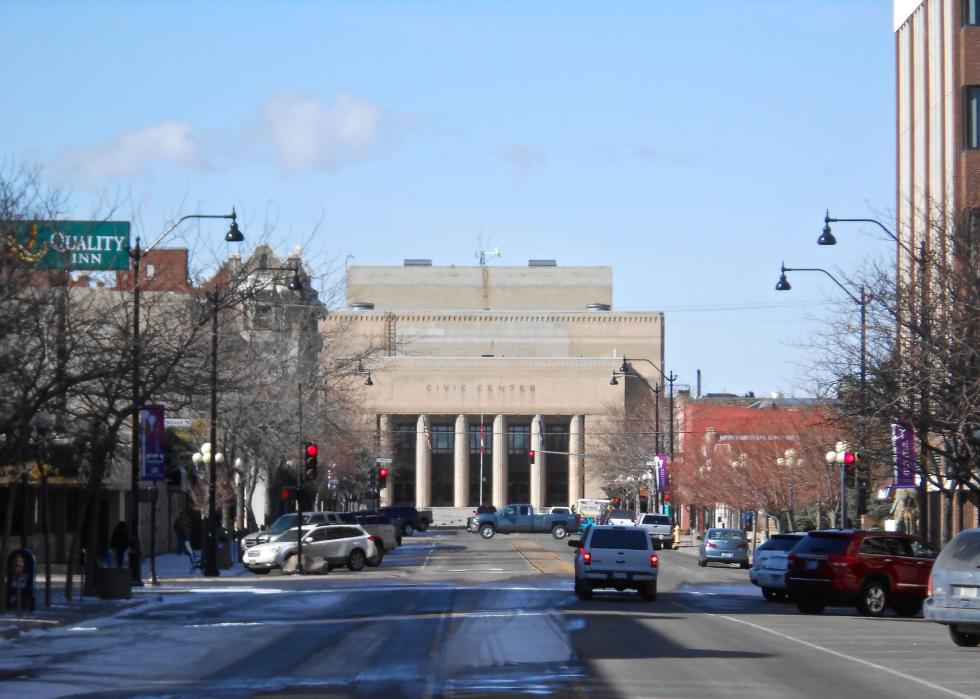
- Death rate for ischemic strokes, 2018-20: 13.8 per 100K people
- Death rate for hemorrhagic strokes, 2018-20: 6.7 per 100K people

- Death rate for ischemic strokes, 2018-20: 15.4 per 100K people
- Death rate for hemorrhagic strokes, 2018-20: 9.2 per 100K people
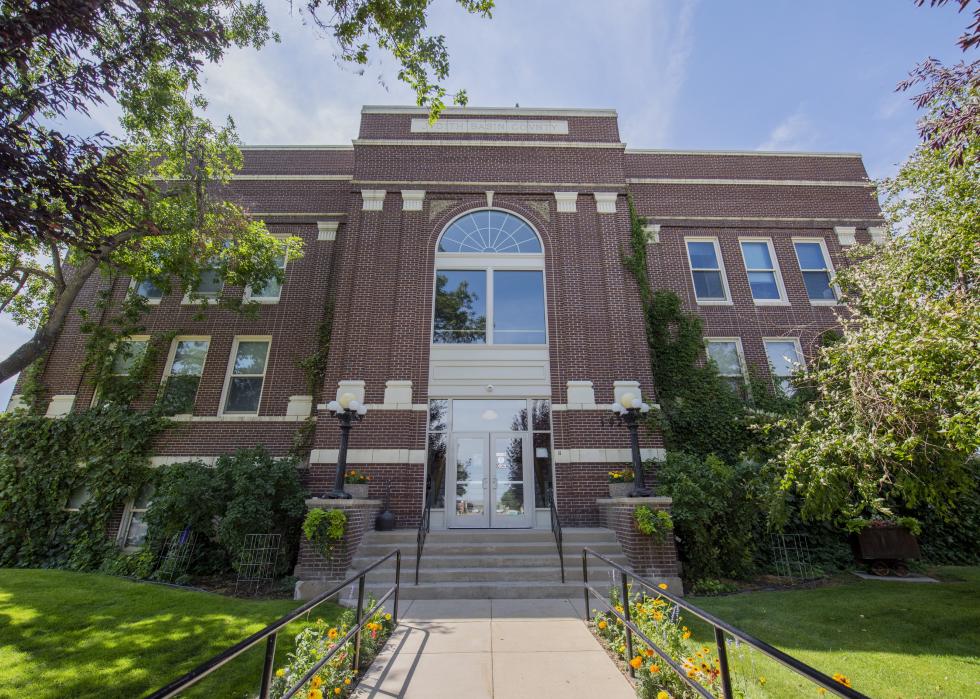
- Death rate for ischemic strokes, 2018-20: 15.5 per 100K people
- Death rate for hemorrhagic strokes, 2018-20: 5.8 per 100K people
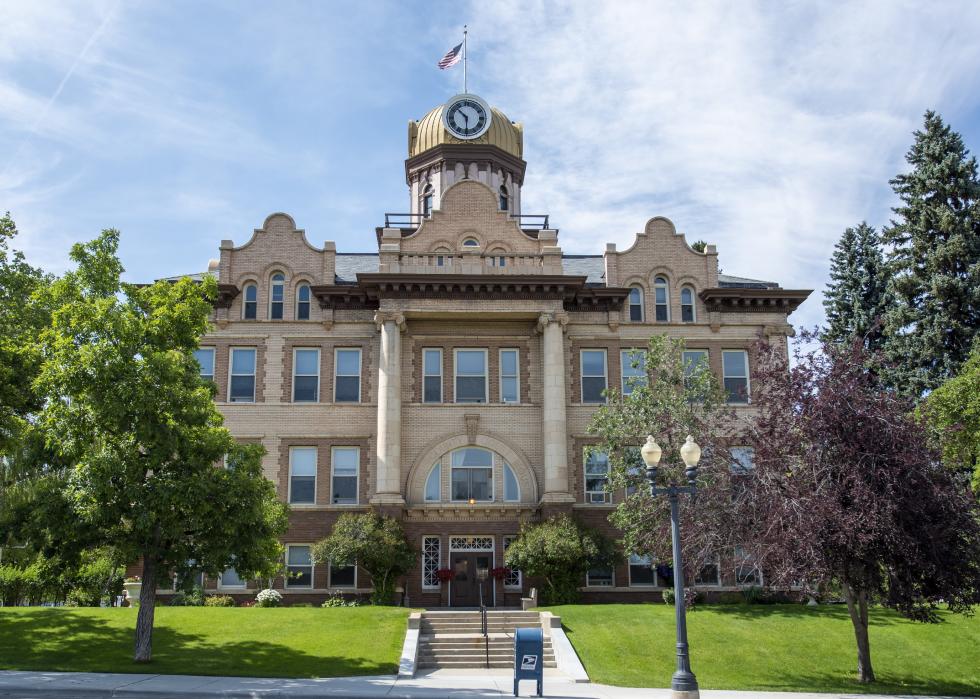
- Death rate for ischemic strokes, 2018-20: 15.8 per 100K people
- Death rate for hemorrhagic strokes, 2018-20: 6.7 per 100K people
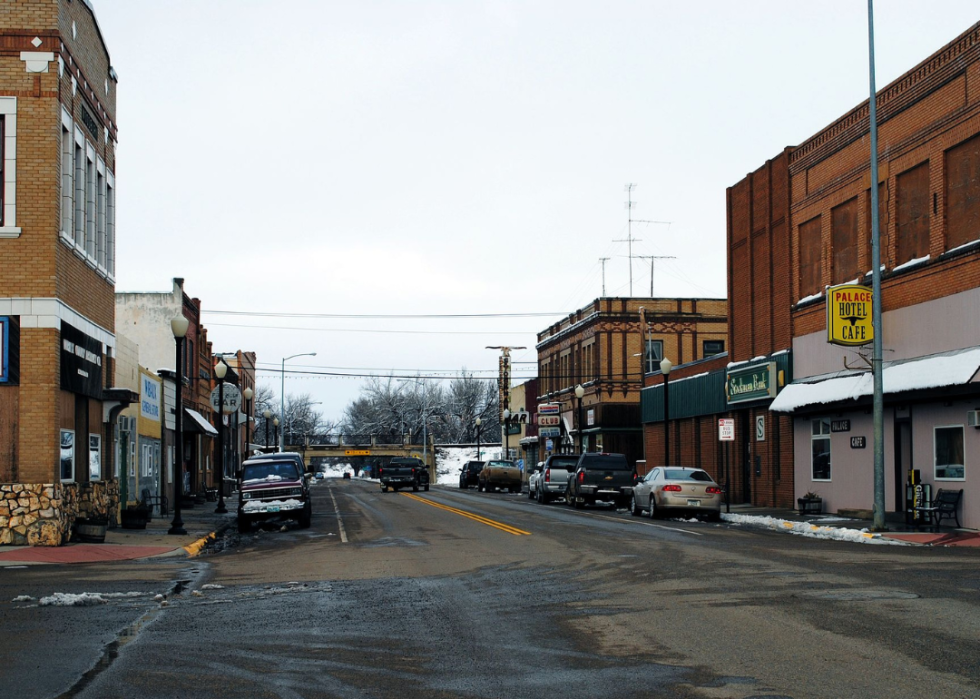
- Death rate for ischemic strokes, 2018-20: 23.5 per 100K people
- Death rate for hemorrhagic strokes, 2018-20: -1.0 per 100K people
You may also like: Most popular boy names in the 60s in Montana
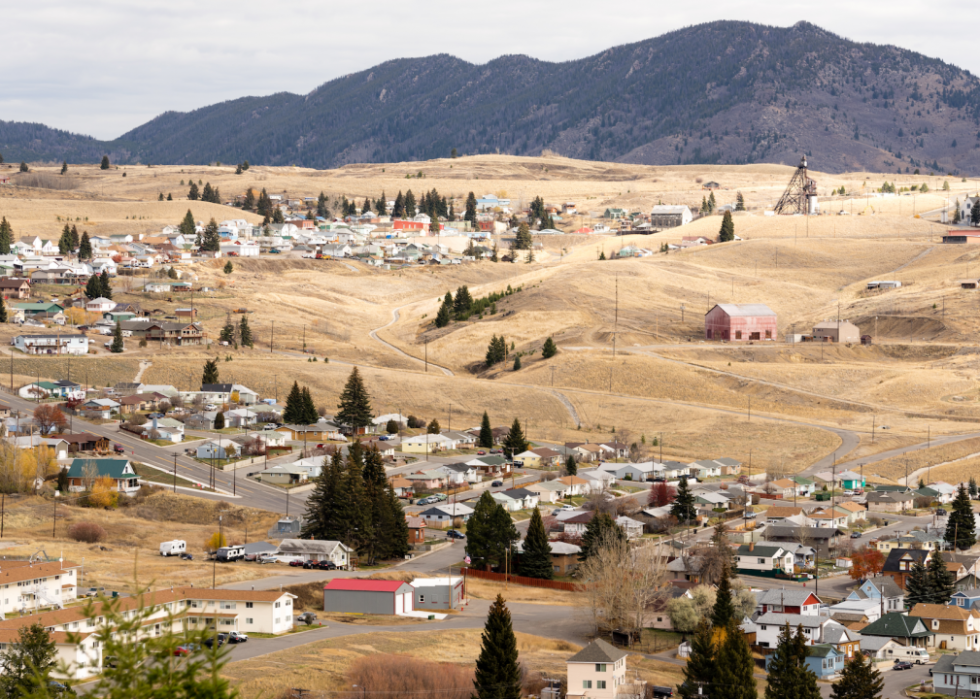
- Death rate for ischemic strokes, 2018-20: 13.0 per 100K people
- Death rate for hemorrhagic strokes, 2018-20: 6.7 per 100K people
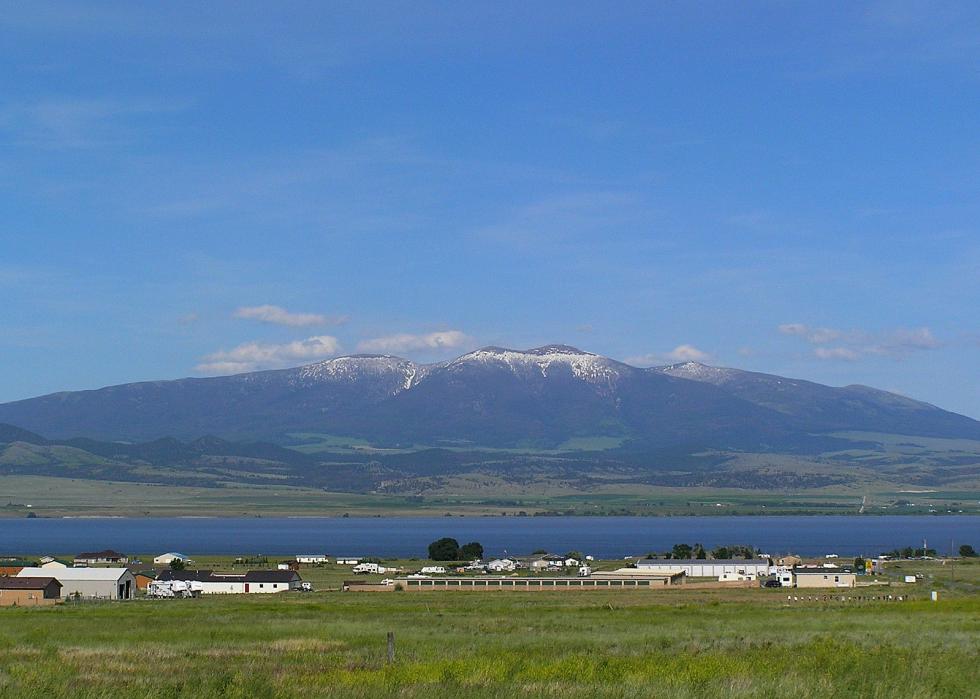
- Death rate for ischemic strokes, 2018-20: 13.2 per 100K people
- Death rate for hemorrhagic strokes, 2018-20: 7.1 per 100K people
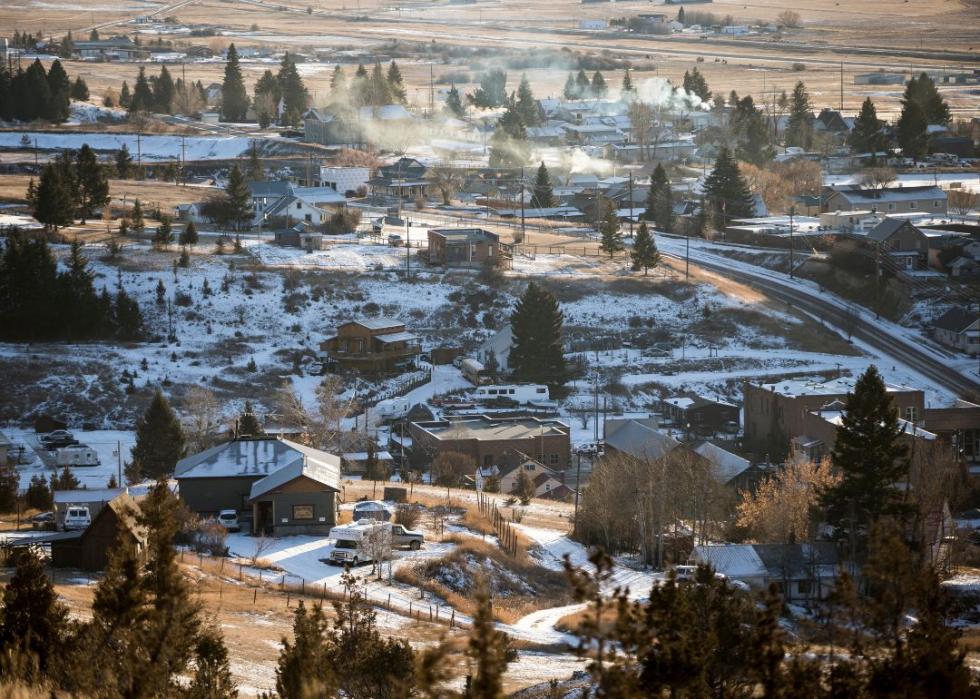
- Death rate for ischemic strokes, 2018-20: 14.1 per 100K people
- Death rate for hemorrhagic strokes, 2018-20: 7.4 per 100K people
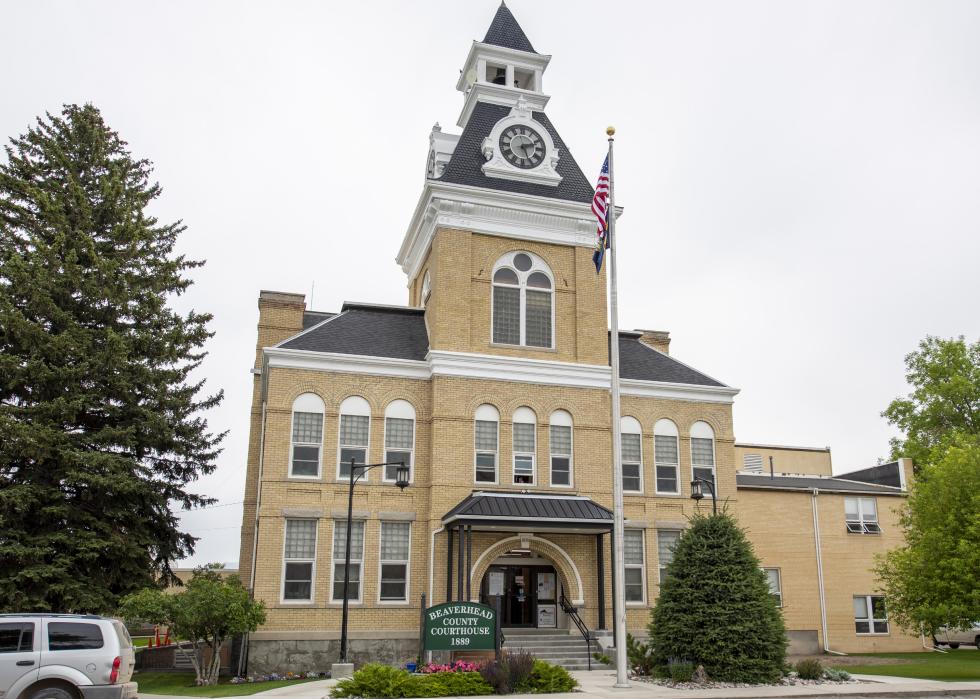
- Death rate for ischemic strokes, 2018-20: 14.3 per 100K people
- Death rate for hemorrhagic strokes, 2018-20: 7.0 per 100K people
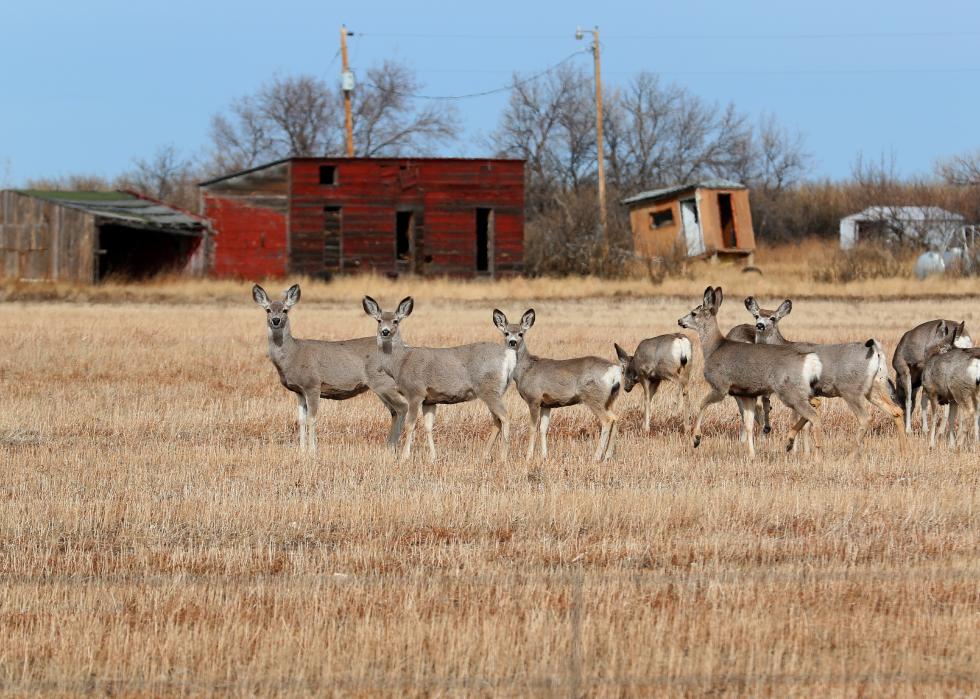
- Death rate for ischemic strokes, 2018-20: 15.0 per 100K people
- Death rate for hemorrhagic strokes, 2018-20: 7.4 per 100K people
You may also like: Highest-earning cities in Montana

- Death rate for ischemic strokes, 2018-20: 17.1 per 100K people
- Death rate for hemorrhagic strokes, 2018-20: 10.0 per 100K people
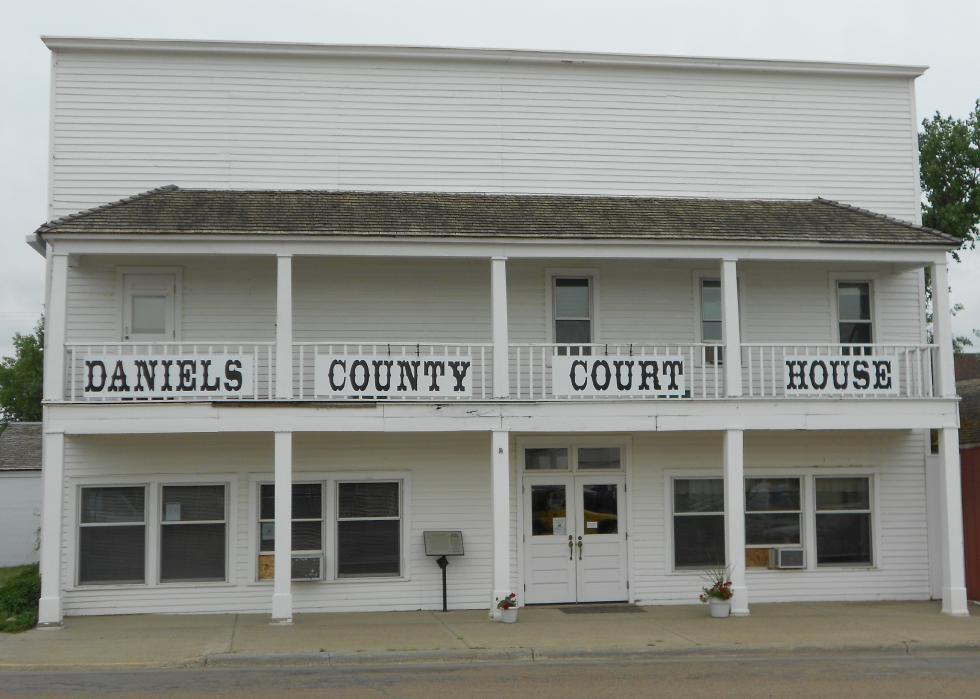
- Death rate for ischemic strokes, 2018-20: 28.2 per 100K people
- Death rate for hemorrhagic strokes, 2018-20: 8.9 per 100K people
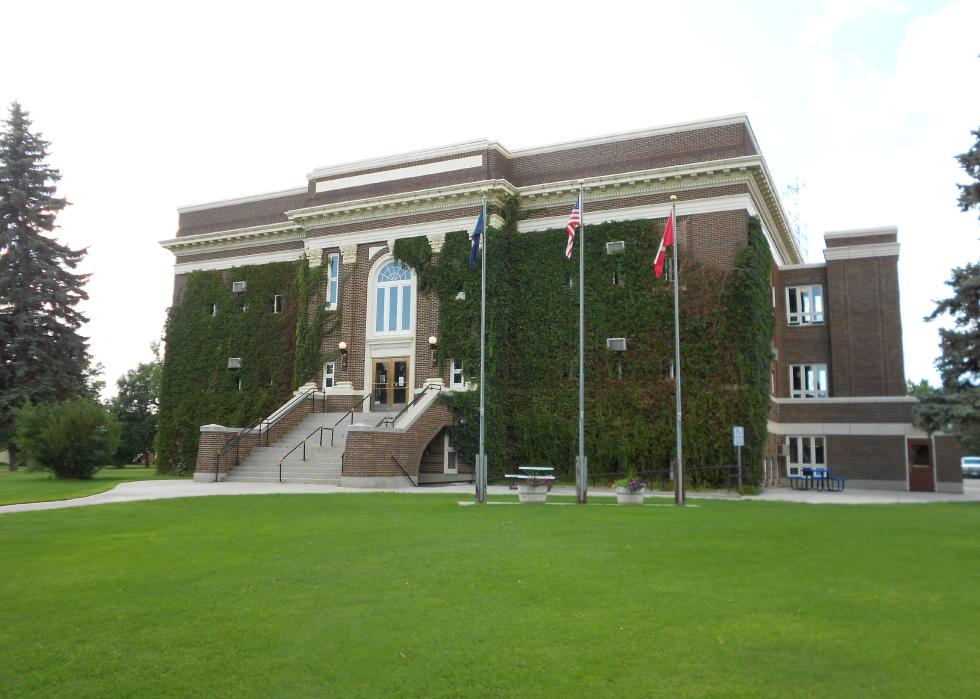
- Death rate for ischemic strokes, 2018-20: 13.3 per 100K people
- Death rate for hemorrhagic strokes, 2018-20: 8.9 per 100K people

- Death rate for ischemic strokes, 2018-20: 15.2 per 100K people
- Death rate for hemorrhagic strokes, 2018-20: 9.4 per 100K people

- Death rate for ischemic strokes, 2018-20: 15.3 per 100K people
- Death rate for hemorrhagic strokes, 2018-20: 7.4 per 100K people
You may also like: Colleges with the best ROI in Montana

- Death rate for ischemic strokes, 2018-20: 16.6 per 100K people
- Death rate for hemorrhagic strokes, 2018-20: 14.6 per 100K people
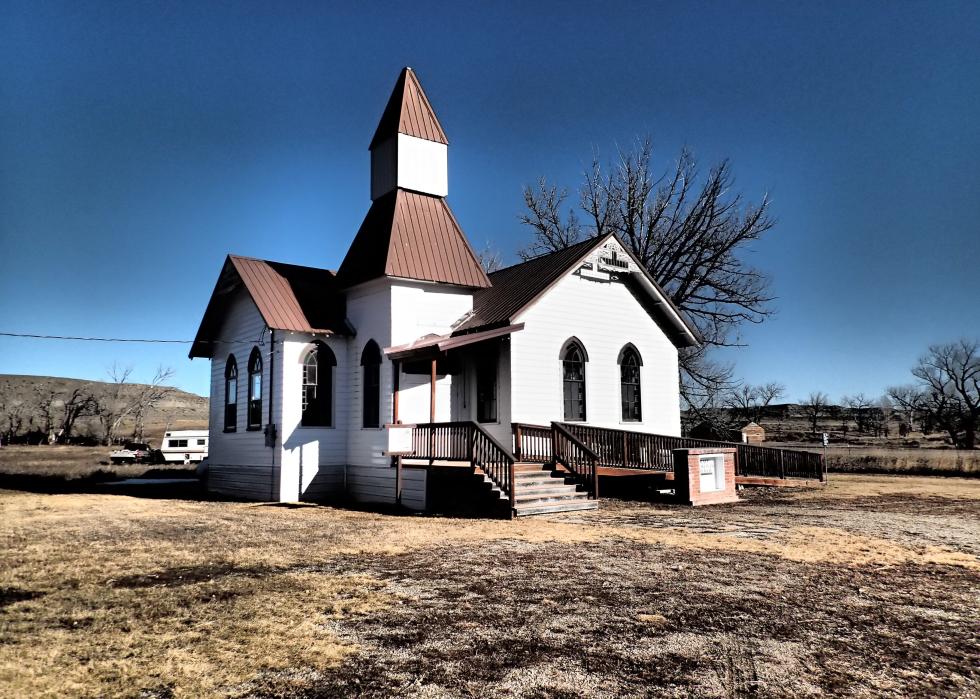
- Death rate for ischemic strokes, 2018-20: 16.7 per 100K people
- Death rate for hemorrhagic strokes, 2018-20: 9.1 per 100K people
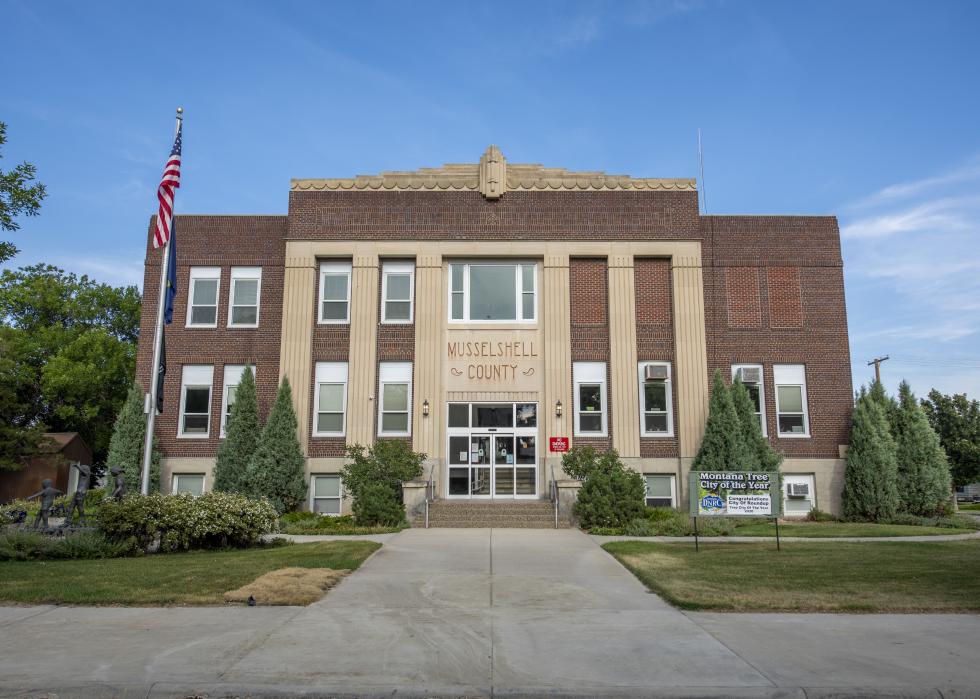
- Death rate for ischemic strokes, 2018-20: 17.1 per 100K people
- Death rate for hemorrhagic strokes, 2018-20: 9.3 per 100K people

- Death rate for ischemic strokes, 2018-20: 18.7 per 100K people
- Death rate for hemorrhagic strokes, 2018-20: 9.5 per 100K people
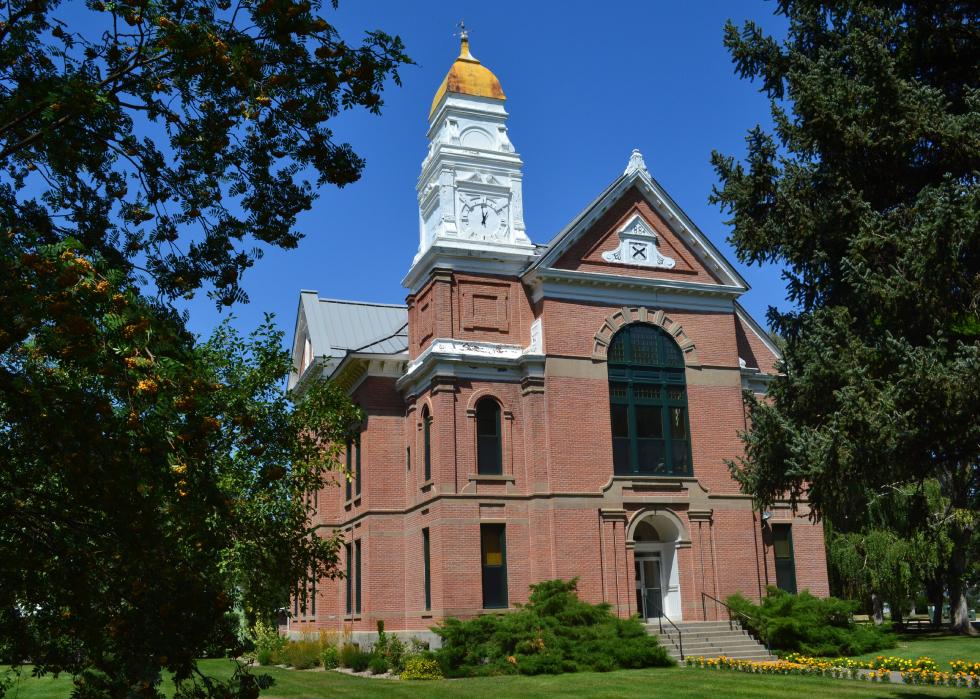
- Death rate for ischemic strokes, 2018-20: 14.4 per 100K people
- Death rate for hemorrhagic strokes, 2018-20: 5.9 per 100K people
You may also like: Highest rated beer in Montana
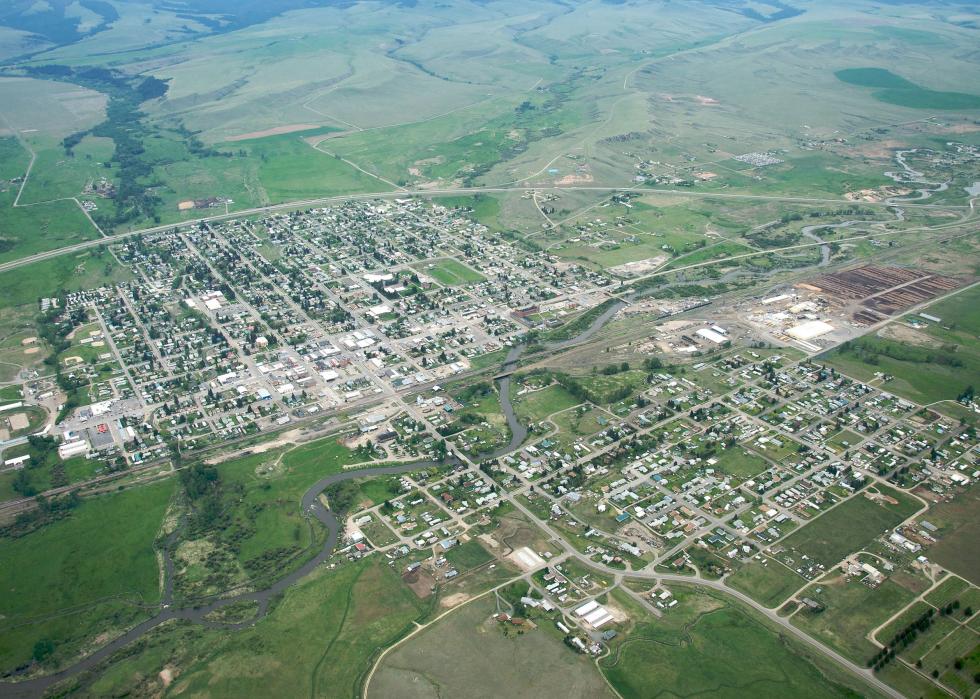
- Death rate for ischemic strokes, 2018-20: 14.8 per 100K people
- Death rate for hemorrhagic strokes, 2018-20: 8.2 per 100K people

- Death rate for ischemic strokes, 2018-20: 16.5 per 100K people
- Death rate for hemorrhagic strokes, 2018-20: 8.0 per 100K people
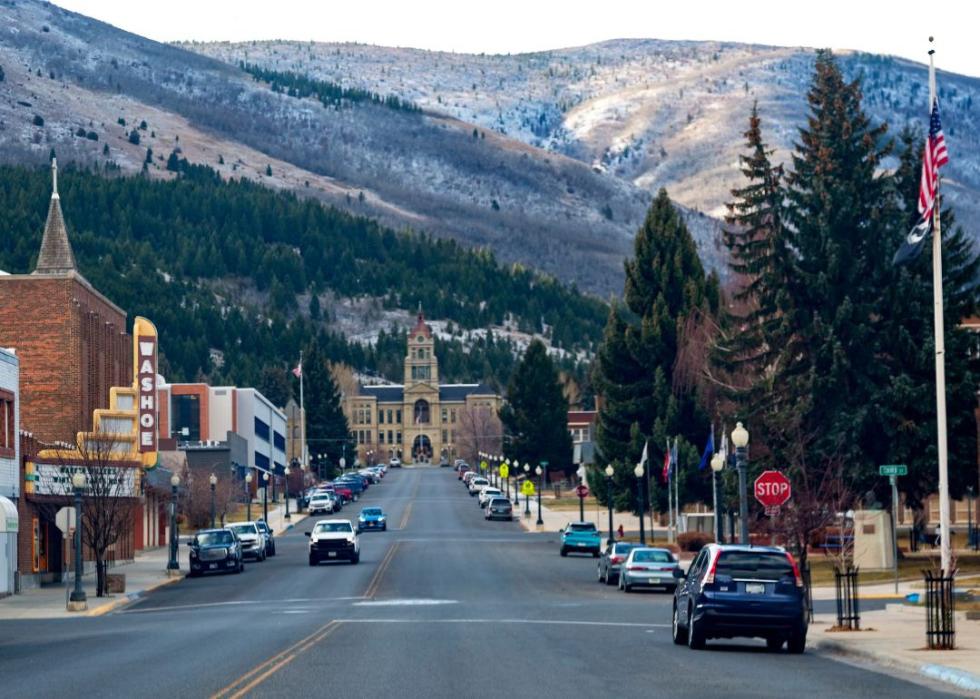
- Death rate for ischemic strokes, 2018-20: 12.8 per 100K people
- Death rate for hemorrhagic strokes, 2018-20: 8.2 per 100K people
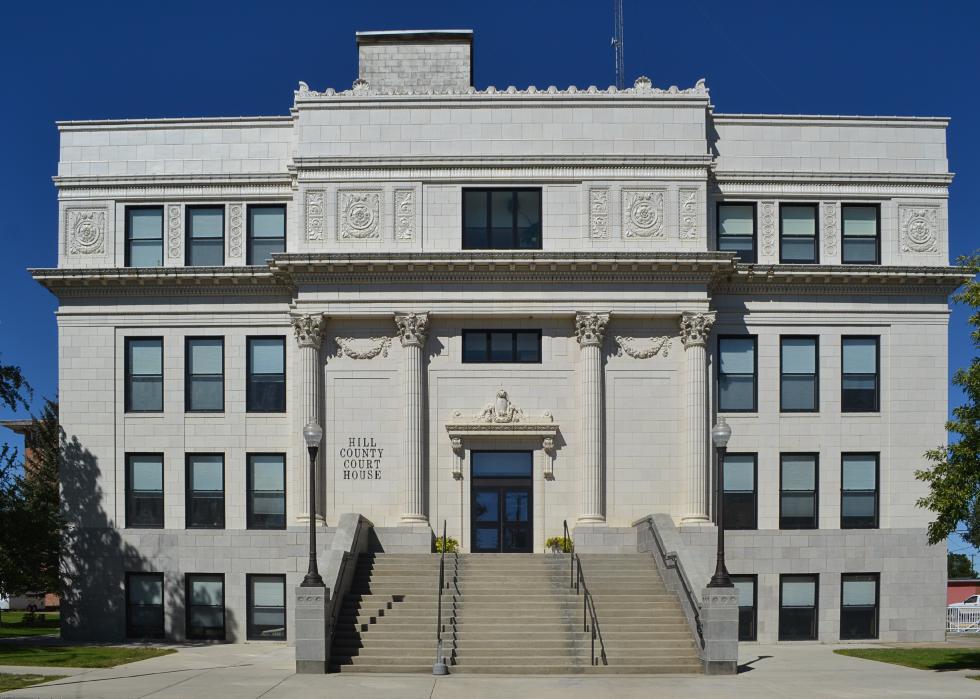
- Death rate for ischemic strokes, 2018-20: 14.3 per 100K people
- Death rate for hemorrhagic strokes, 2018-20: 4.3 per 100K people

- Death rate for ischemic strokes, 2018-20: 15.9 per 100K people
- Death rate for hemorrhagic strokes, 2018-20: 7.9 per 100K people
You may also like: Countries Montana exports the most goods to
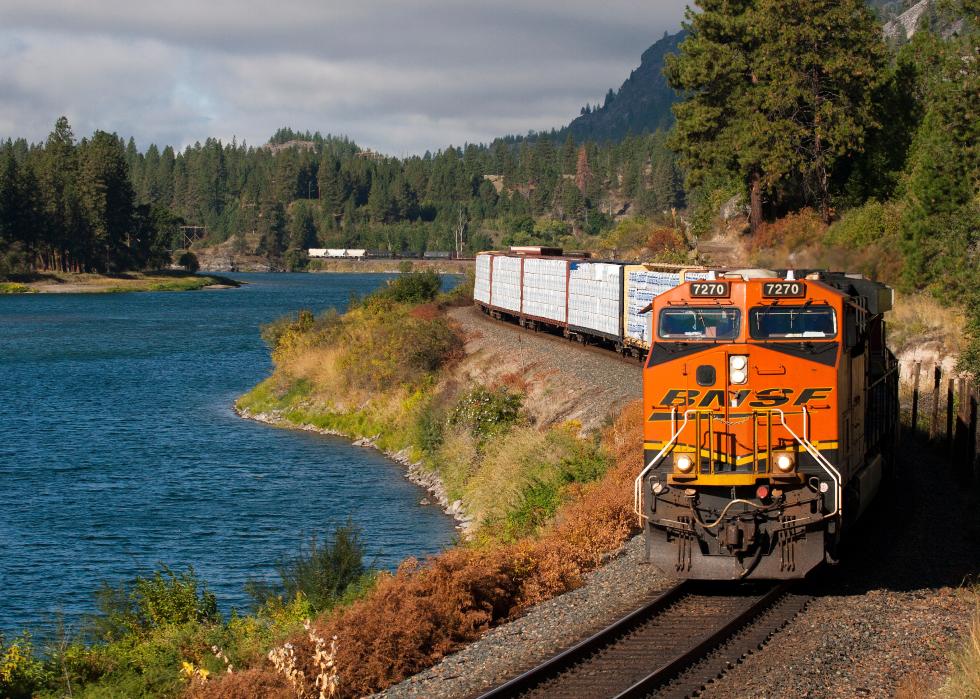
- Death rate for ischemic strokes, 2018-20: 17.6 per 100K people
- Death rate for hemorrhagic strokes, 2018-20: 7.1 per 100K people

- Death rate for ischemic strokes, 2018-20: 19.1 per 100K people
- Death rate for hemorrhagic strokes, 2018-20: 6.7 per 100K people
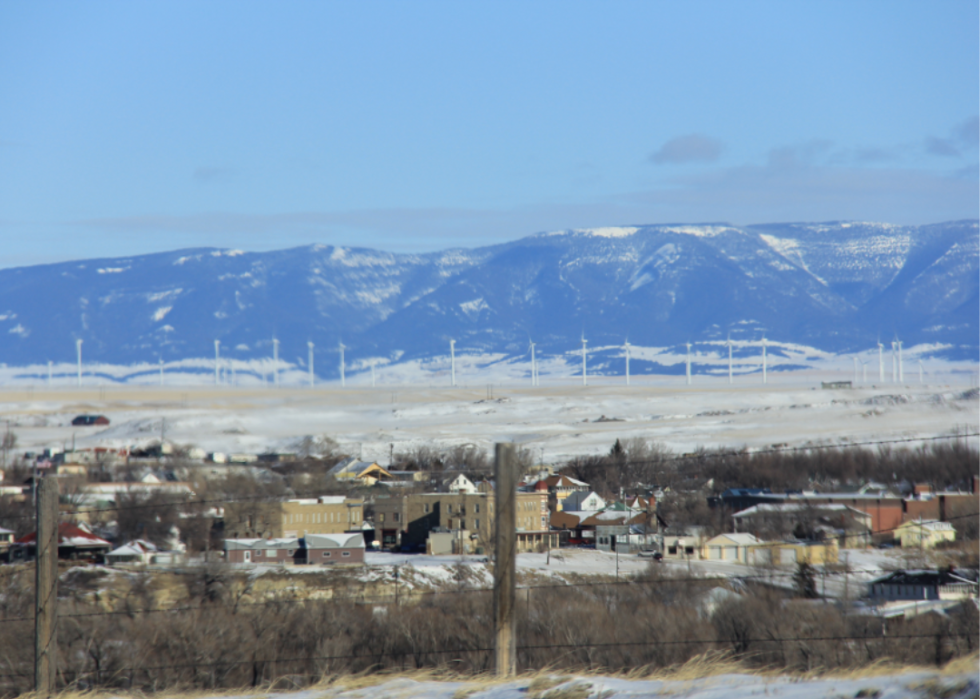
- Death rate for ischemic strokes, 2018-20: 14.2 per 100K people
- Death rate for hemorrhagic strokes, 2018-20: 6.6 per 100K people

- Death rate for ischemic strokes, 2018-20: 18.8 per 100K people
- Death rate for hemorrhagic strokes, 2018-20: -1.0 per 100K people

- Death rate for ischemic strokes, 2018-20: 17.8 per 100K people
- Death rate for hemorrhagic strokes, 2018-20: 4.2 per 100K people
You may also like: Glacier National Park is losing its glaciers: How climate change has affected Montana
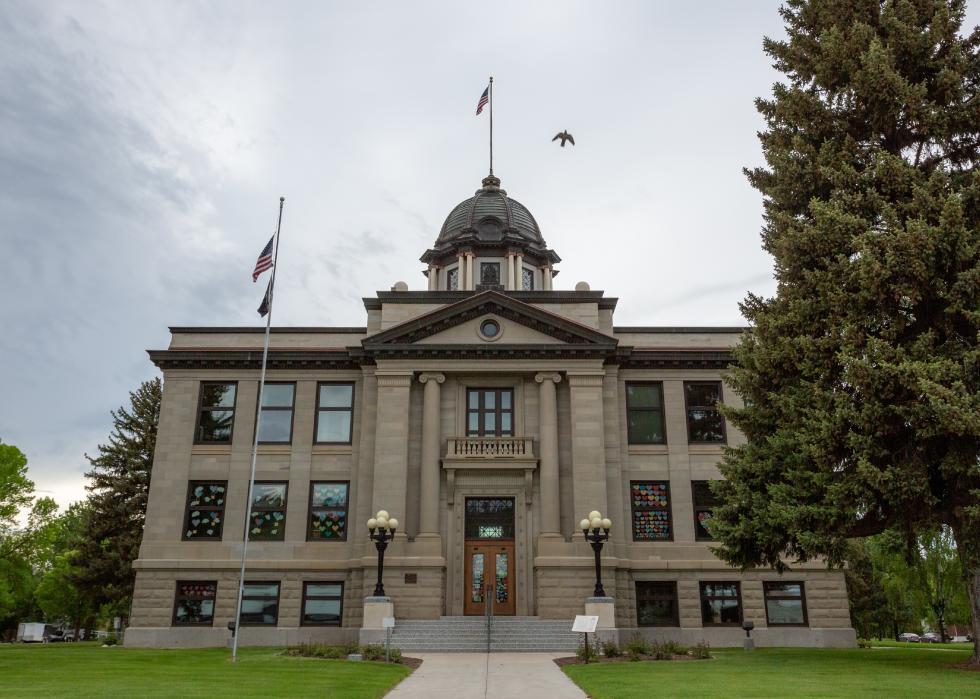
- Death rate for ischemic strokes, 2018-20: 16.3 per 100K people
- Death rate for hemorrhagic strokes, 2018-20: 10.2 per 100K people
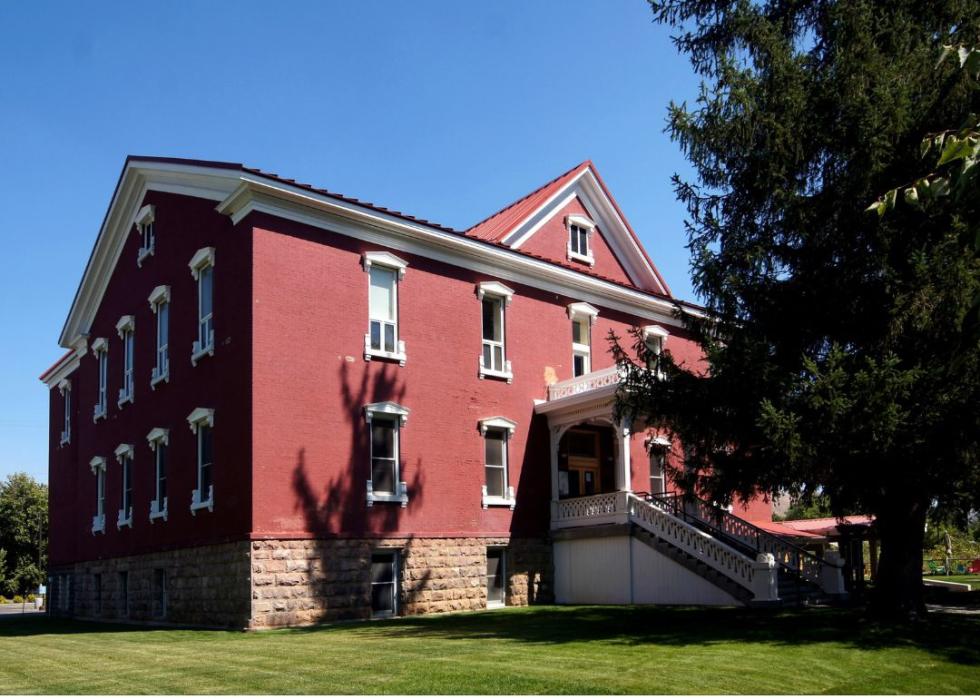
- Death rate for ischemic strokes, 2018-20: 16.3 per 100K people
- Death rate for hemorrhagic strokes, 2018-20: 7.4 per 100K people
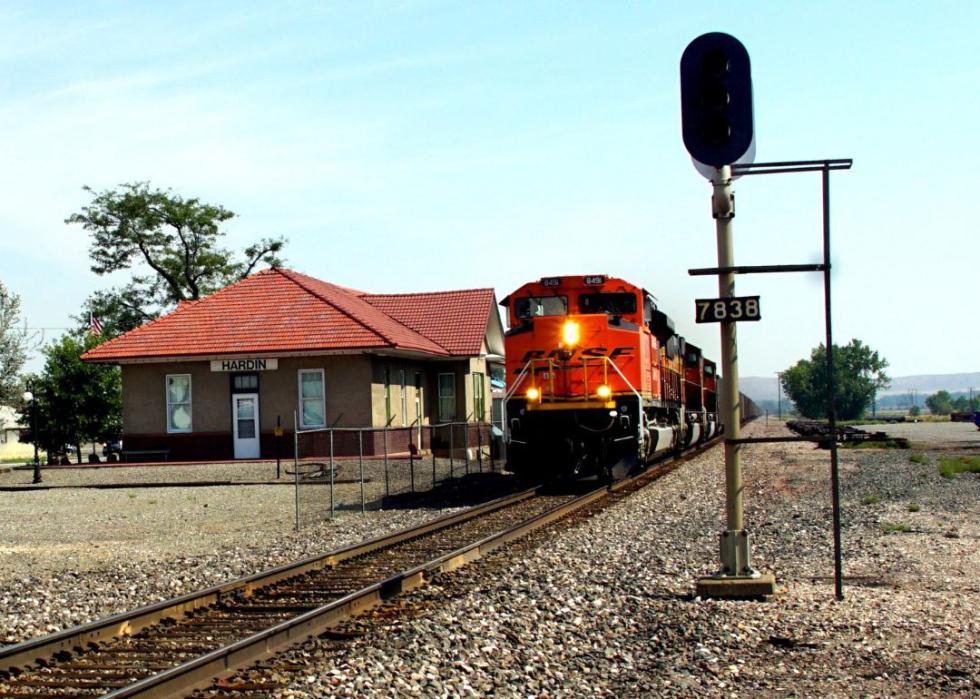
- Death rate for ischemic strokes, 2018-20: 18.7 per 100K people
- Death rate for hemorrhagic strokes, 2018-20: 9.5 per 100K people

- Death rate for ischemic strokes, 2018-20: 42.1 per 100K people
- Death rate for hemorrhagic strokes, 2018-20: 10.7 per 100K people
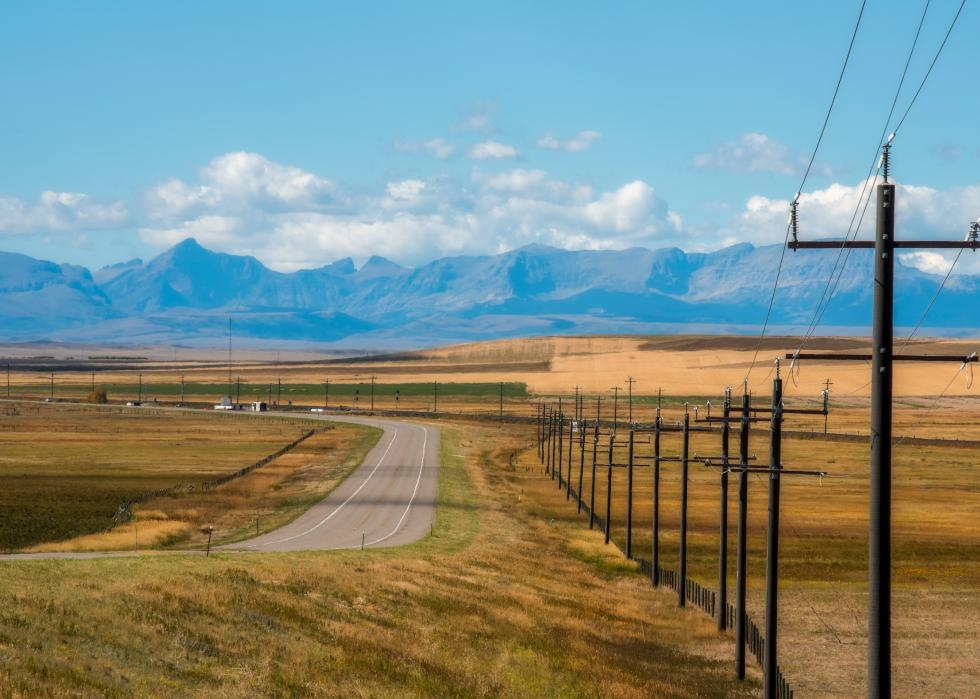
- Death rate for ischemic strokes, 2018-20: 17.3 per 100K people
- Death rate for hemorrhagic strokes, 2018-20: 8.8 per 100K people
You may also like: Best community colleges in Montana
This story features data reporting and writing by Emma Rubin and is part of a series utilizing data automation across 49 states.
