Counties in Montana where landslides pose the greatest threat
In Montana, over half of the land is susceptible to landslides in 30 counties. In 1 county, over 90% of land is susceptible.
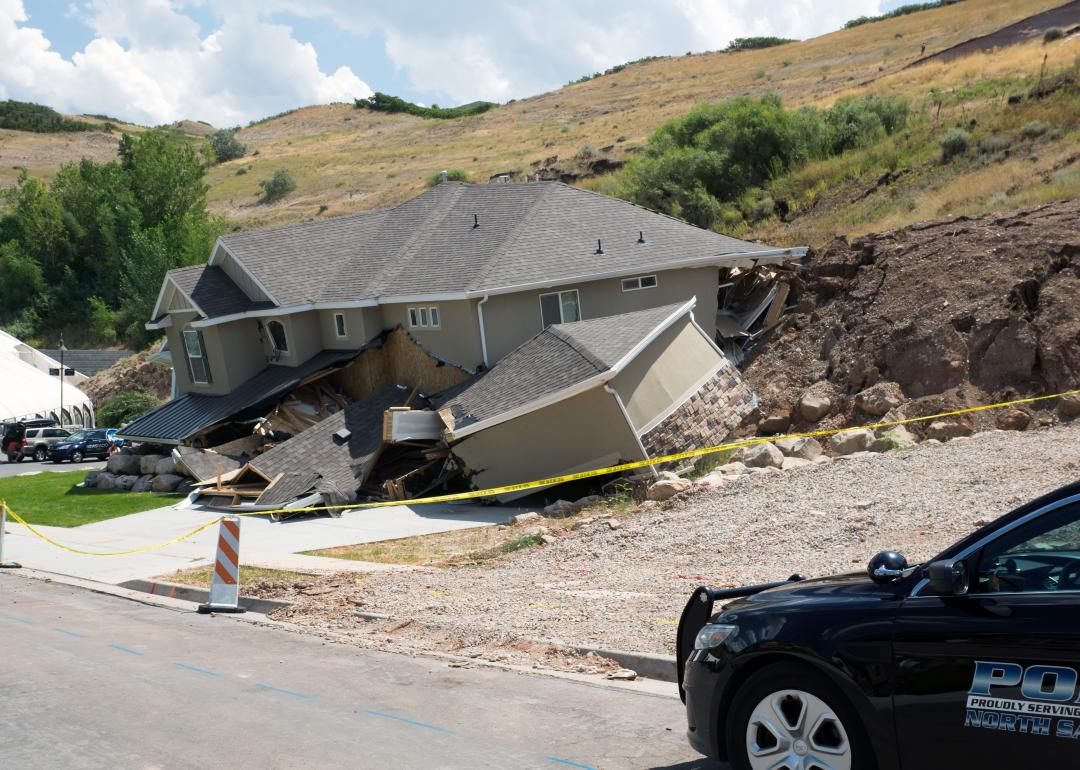
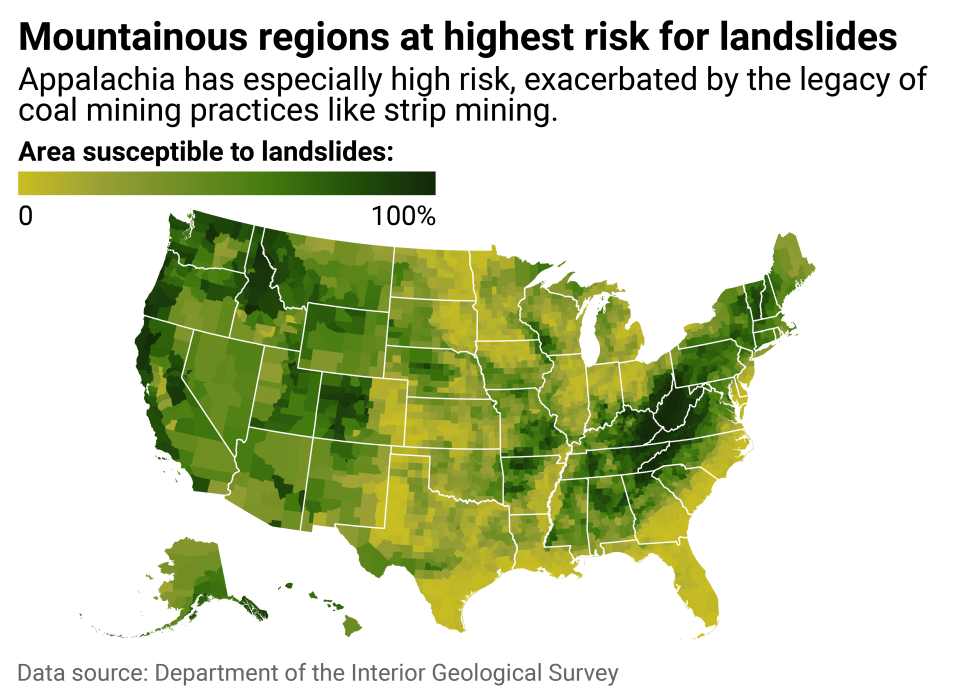
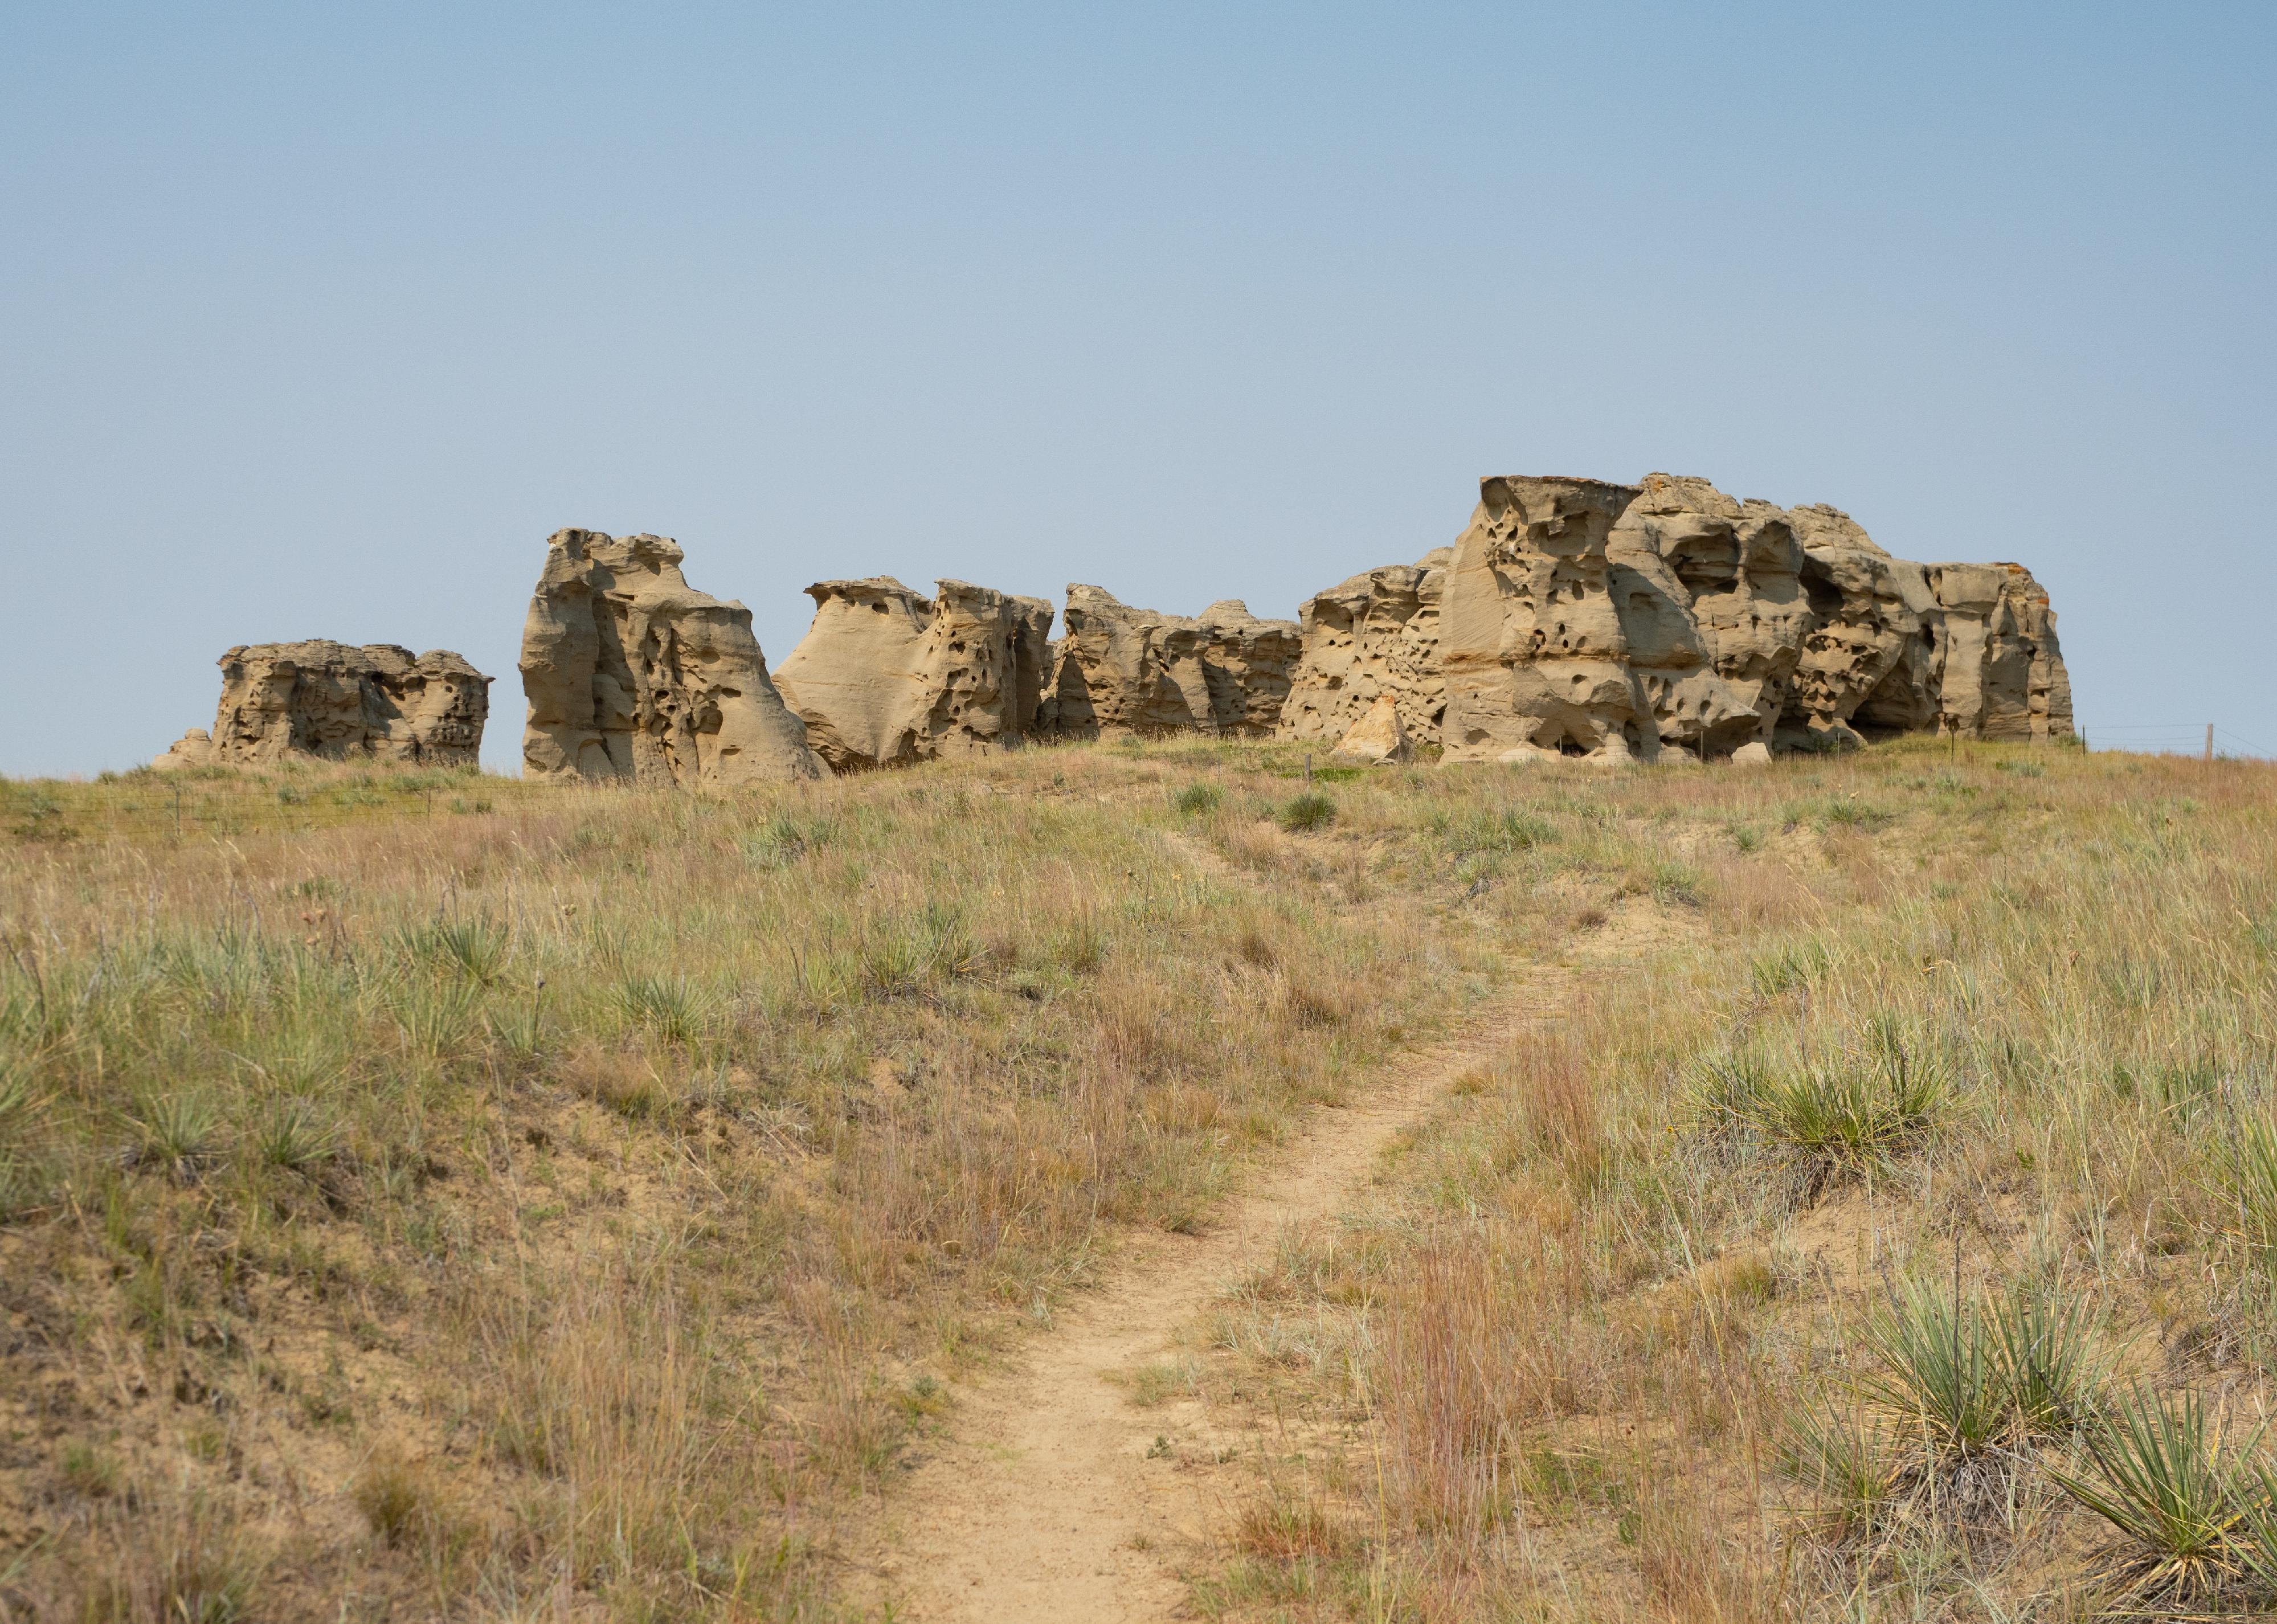
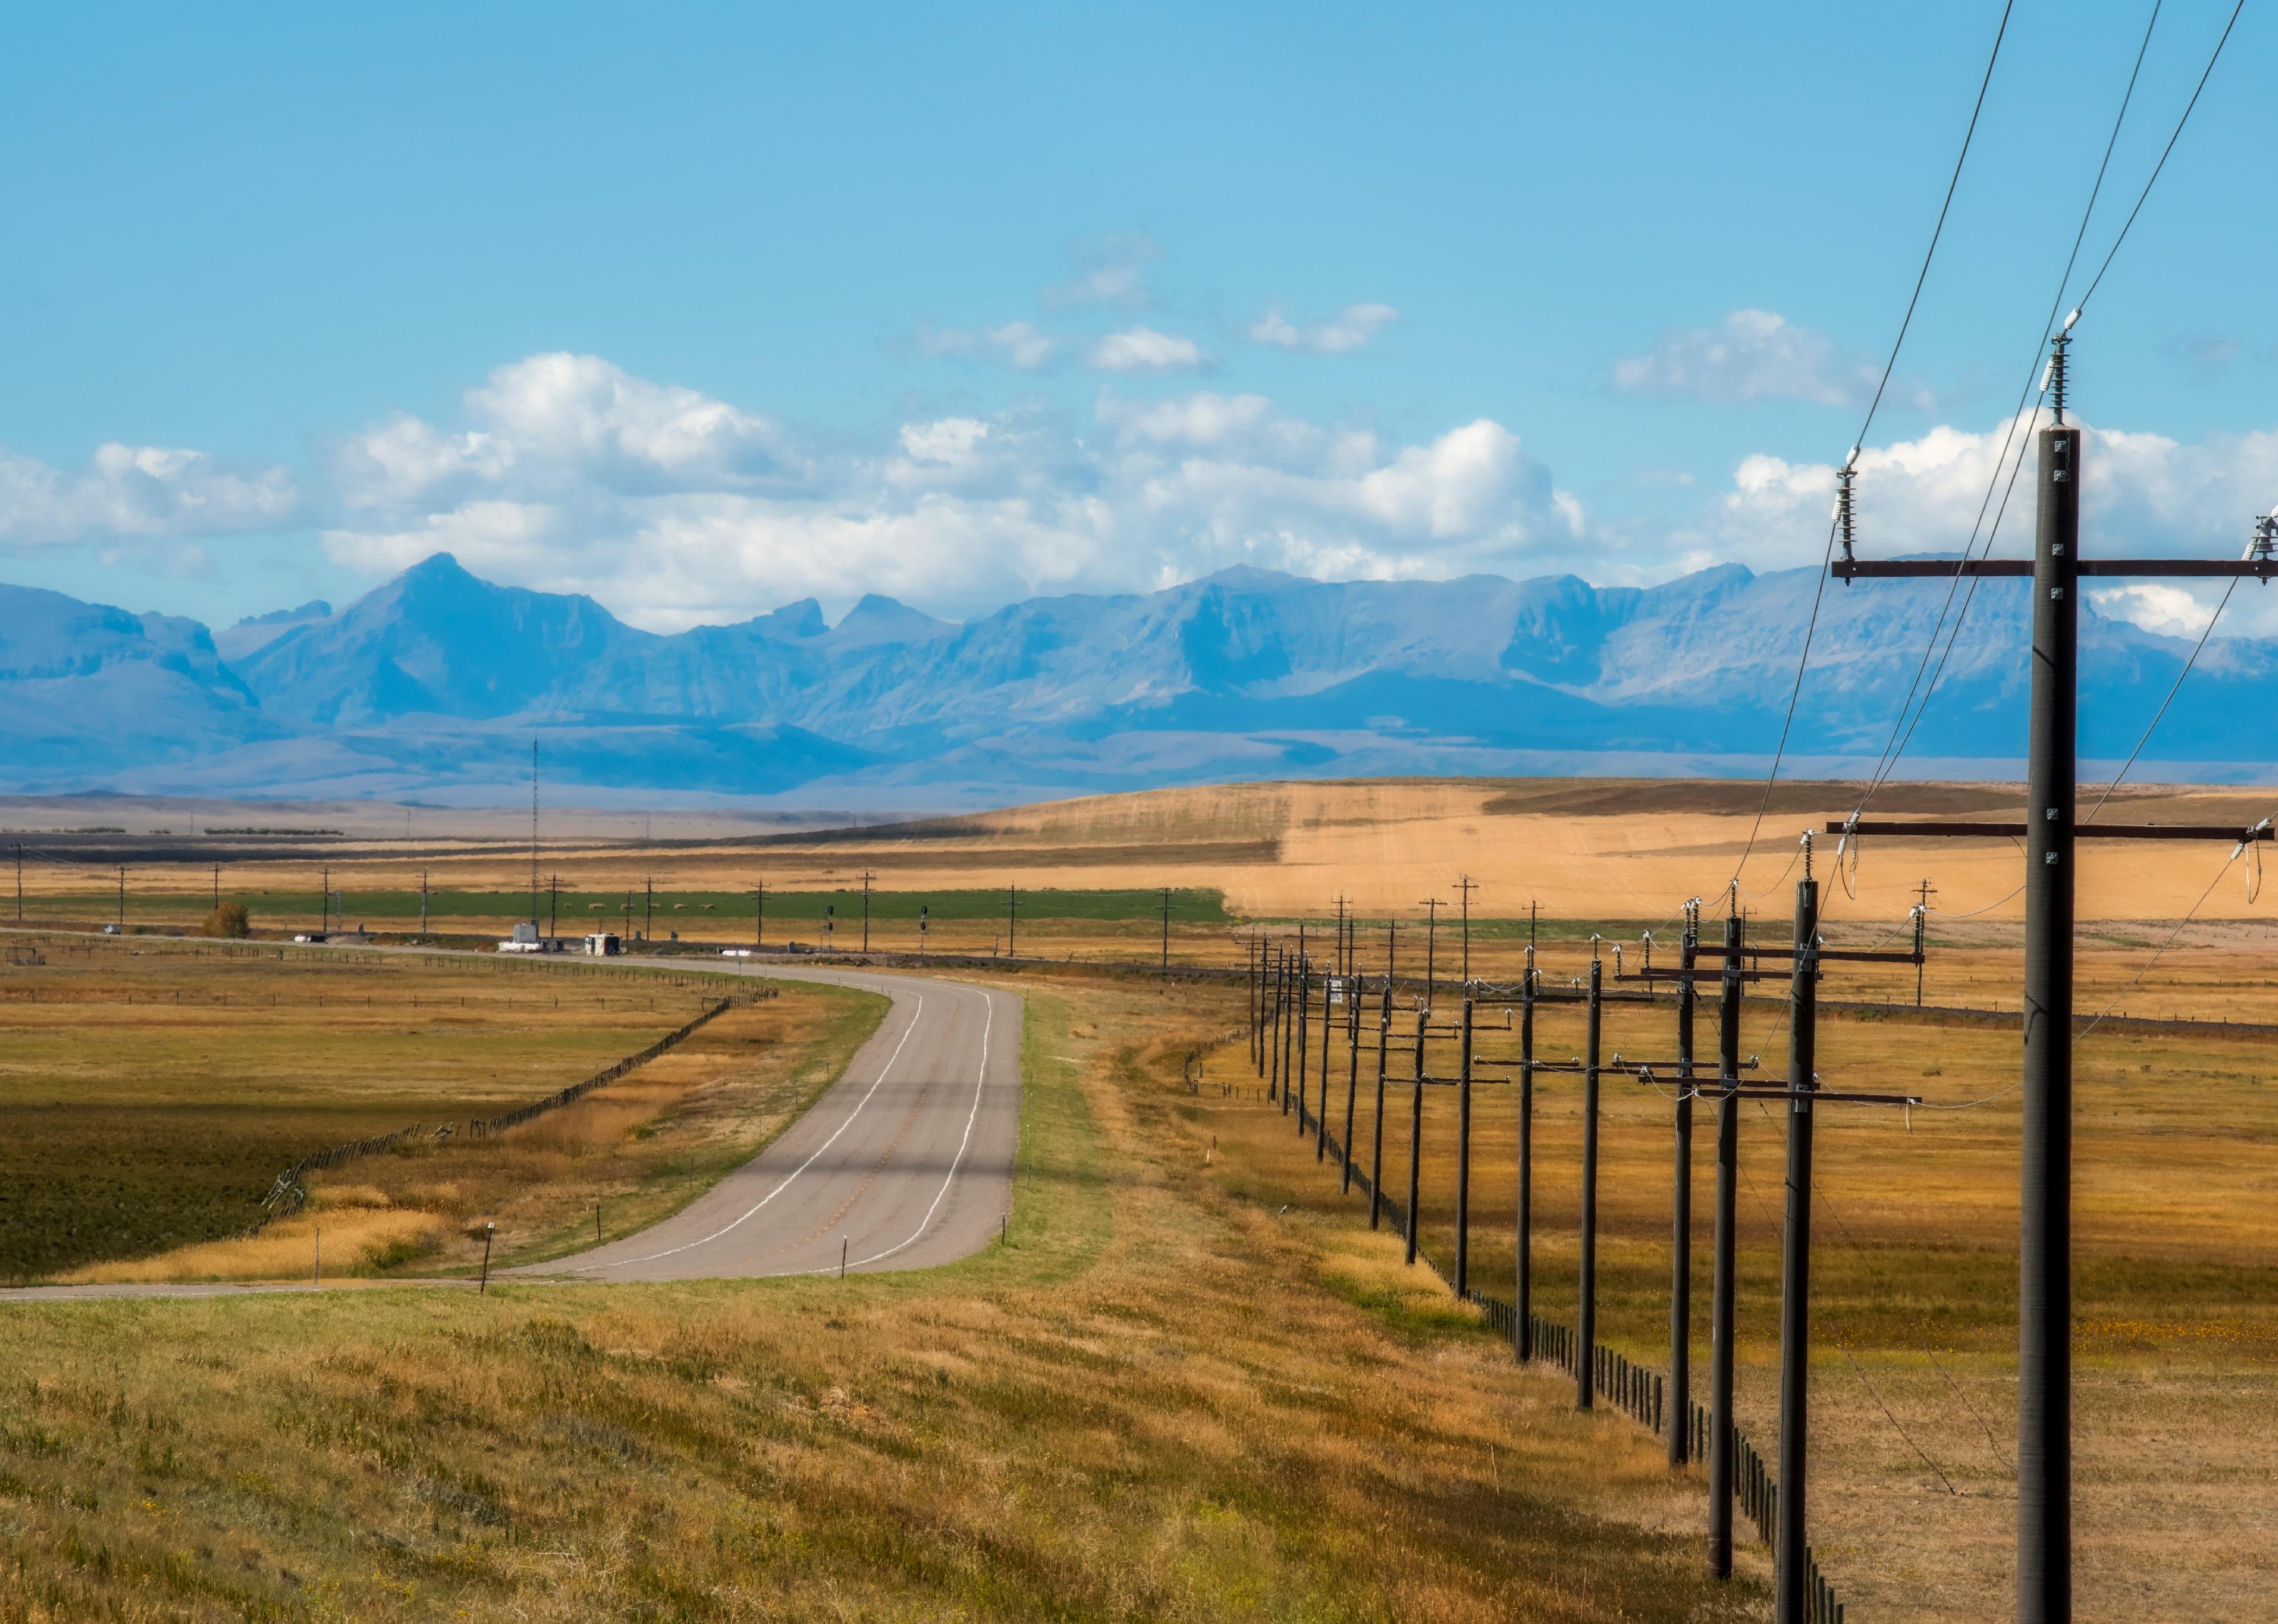
A landslide occurs when rock, debris, or earth moves down a slope. Inclines like hills and bluffs are a critical element of slides, meaning mountainous regions are at higher risk. Typically, landslides are triggered by forces like heavy rainfall, snowmelt, earthquakes, volcanic activity, human activities, or some combination of factors. Often, they're impossible to predict.
According to the Geological Survey, places where weak or fractured earth sit on steep slopes are likely to experience landslides—for example, areas with a history of strip mining. In Appalachia, about 1,400 square miles of land are scarred by strip mining within the Ohio River basin, according to an Inside Climate News analysis of satellite imagery. Together, the "waste rock" left behind, increasing stream flows, and heavy rainfalls brought on by climate change create a deadly recipe for landslides. This part of Appalachia is also near the Gulf of Mexico, where fast-warming waters stir up exceptionally fast-growing storms, as was the case with Hurricane Helene.
Combined, these elements create the highest vulnerability to landslides in the region. Much of West Virginia, in particular, is at risk: In 47 of the state's 55 counties, more than 90% of the land is susceptible to slides. Parts of Virginia, Kentucky, Ohio, Tennessee, and North Carolina are also exceedingly vulnerable.
Parts of California's coastline have also been plagued by major landslides. Earlier this year, a rockslide destroyed a part of Highway 1 along the state's famed Big Sur. The earth below the highway isn't sturdy, and wetter storms are further weakening it, contributing to more frequent and severe landslides. The majestic Big Sur stretch is an iconic road trip and tourism destination, where the highway winds along cliffs above the Pacific Ocean. However, it was forced to close to most traffic, and still offers just one lane at some points.
Other landslide risk factors include population growth, rapid land use changes, urbanization, heavy logging and deforestation, and inappropriate use of lands—slopes in particular. Wildfires also generate landslide hazards, leaving behind excess debris that can be dragged down during floods, as was the case in Big Sur.
The heightened frequency and severity of landslides are a direct consequence of logging, mining, and climate change, with massive repercussions for safety and critical infrastructure in the U.S. and around the world.
Hazard maps like those from the Geological Survey are a tool that federal, state, and local governments can use to identify landslide vulnerabilities and prepare for them. Preparation and mitigation efforts might include landslide drills, evacuation plans, improved drainage systems, and slope stabilization. Governments in susceptible areas can adopt disaster-resilient building codes and standards, as well as restrictions on mining and logging.
In some cases, such as Highway 1, there are no obvious solutions to fully protect against landslides. Still, with increased awareness and response plans, people can make more informed decisions on where to live (or safely visit) and can prepare themselves for landslides and their aftermath.
Read on to see where in Montana is most vulnerable to the growing landslide threat.

- Percent susceptible area: 17.7%
- Total susceptible area: 514 square miles
- Percent susceptible area: 19.6%
- Total susceptible area: 280 square miles
- Percent susceptible area: 19.8%
- Total susceptible area: 284 square miles
- Percent susceptible area: 21.6%
- Total susceptible area: 418 square miles

- Percent susceptible area: 22.5%
- Total susceptible area: 379 square miles
- Percent susceptible area: 23.1%
- Total susceptible area: 546 square miles
- Percent susceptible area: 28.0%
- Total susceptible area: 456 square miles
- Percent susceptible area: 31.0%
- Total susceptible area: 1,530 square miles
- Percent susceptible area: 32.9%
- Total susceptible area: 1,102 square miles
- Percent susceptible area: 34.6%
- Total susceptible area: 493 square miles
- Percent susceptible area: 34.8%
- Total susceptible area: 790 square miles
- Percent susceptible area: 35.0%
- Total susceptible area: 411 square miles

- Percent susceptible area: 35.7%
- Total susceptible area: 1,424 square miles
- Percent susceptible area: 36.9%
- Total susceptible area: 599 square miles
- Percent susceptible area: 37.8%
- Total susceptible area: 1,950 square miles
- Percent susceptible area: 37.9%
- Total susceptible area: 1,007 square miles
- Percent susceptible area: 38.7%
- Total susceptible area: 1,637 square miles

- Percent susceptible area: 39.8%
- Total susceptible area: 835 square miles

- Percent susceptible area: 43.8%
- Total susceptible area: 1,044 square miles
- Percent susceptible area: 45.2%
- Total susceptible area: 1,362 square miles
- Percent susceptible area: 45.6%
- Total susceptible area: 1,208 square miles
- Percent susceptible area: 47.0%
- Total susceptible area: 419 square miles
- Percent susceptible area: 48.3%
- Total susceptible area: 903 square miles
- Percent susceptible area: 48.5%
- Total susceptible area: 2,272 square miles
- Percent susceptible area: 48.8%
- Total susceptible area: 850 square miles
- Percent susceptible area: 48.9%
- Total susceptible area: 812 square miles

- Percent susceptible area: 51.2%
- Total susceptible area: 2,576 square miles

- Percent susceptible area: 51.7%
- Total susceptible area: 1,397 square miles

- Percent susceptible area: 52.4%
- Total susceptible area: 980 square miles

- Percent susceptible area: 53.4%
- Total susceptible area: 2,324 square miles

- Percent susceptible area: 56.5%
- Total susceptible area: 1,015 square miles
- Percent susceptible area: 57.5%
- Total susceptible area: 565 square miles
- Percent susceptible area: 63.6%
- Total susceptible area: 2,412 square miles
- Percent susceptible area: 64.6%
- Total susceptible area: 772 square miles
- Percent susceptible area: 65.0%
- Total susceptible area: 975 square miles
- Percent susceptible area: 65.6%
- Total susceptible area: 2,164 square miles

- Percent susceptible area: 66.6%
- Total susceptible area: 3,672 square miles
- Percent susceptible area: 67.9%
- Total susceptible area: 1,773 square miles
- Percent susceptible area: 68.8%
- Total susceptible area: 3,443 square miles
- Percent susceptible area: 69.1%
- Total susceptible area: 1,423 square miles
- Percent susceptible area: 69.4%
- Total susceptible area: 1,661 square miles
- Percent susceptible area: 69.7%
- Total susceptible area: 1,297 square miles
- Percent susceptible area: 70.8%
- Total susceptible area: 521 square miles
- Percent susceptible area: 71.4%
- Total susceptible area: 2,566 square miles

- Percent susceptible area: 75.5%
- Total susceptible area: 1,252 square miles
- Percent susceptible area: 76.5%
- Total susceptible area: 1,780 square miles
- Percent susceptible area: 79.1%
- Total susceptible area: 569 square miles

- Percent susceptible area: 79.1%
- Total susceptible area: 2,744 square miles

- Percent susceptible area: 80.5%
- Total susceptible area: 2,266 square miles
- Percent susceptible area: 81.0%
- Total susceptible area: 4,148 square miles
- Percent susceptible area: 83.5%
- Total susceptible area: 1,445 square miles

- Percent susceptible area: 83.6%
- Total susceptible area: 2,183 square miles
- Percent susceptible area: 84.8%
- Total susceptible area: 2,354 square miles
- Percent susceptible area: 86.2%
- Total susceptible area: 2,068 square miles
- Percent susceptible area: 86.7%
- Total susceptible area: 3,143 square miles

- Percent susceptible area: 95.0%
- Total susceptible area: 1,162 square miles
This story features data reporting and writing by Paxtyn Merten and is part of a series utilizing data automation across 50 states.