Counties with the highest rates of strokes in Nevada
Gchapel // Shutterstock
- Age-adjusted rate of all strokes among adults, estimates for 2021: 2.5% (range between 2.2% and 2.9%)
- Death rate for ischemic strokes, 2018-20: 11.9 per 100K people
- Death rate for hemorrhagic strokes, 2018-20: 8.4 per 100K people
- Death rate for ischemic strokes, 2018-20: 11.9 per 100K people
- Death rate for hemorrhagic strokes, 2018-20: 8.4 per 100K people
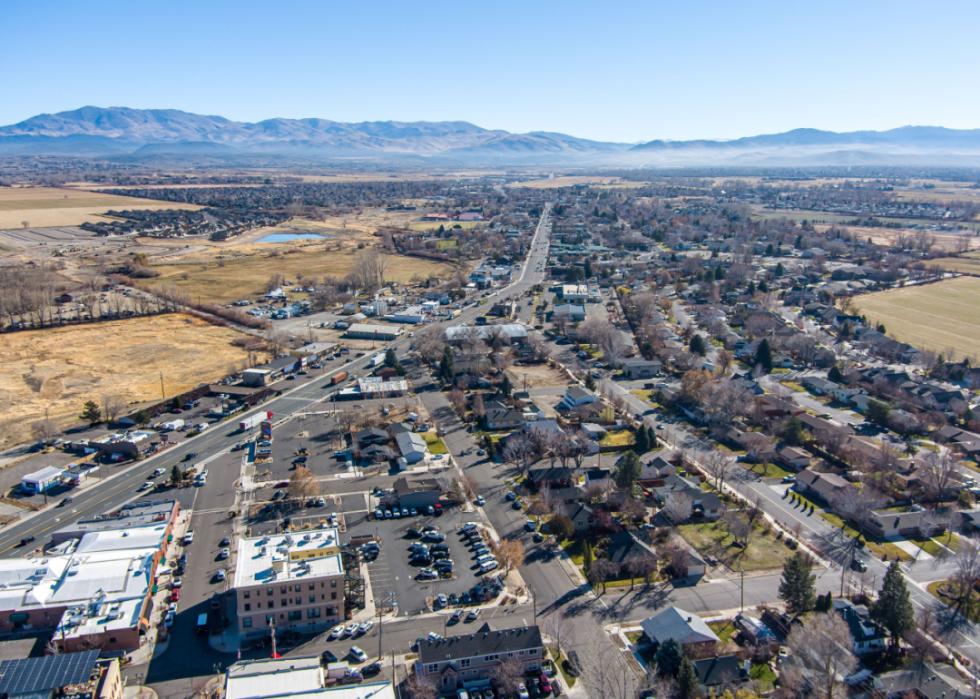
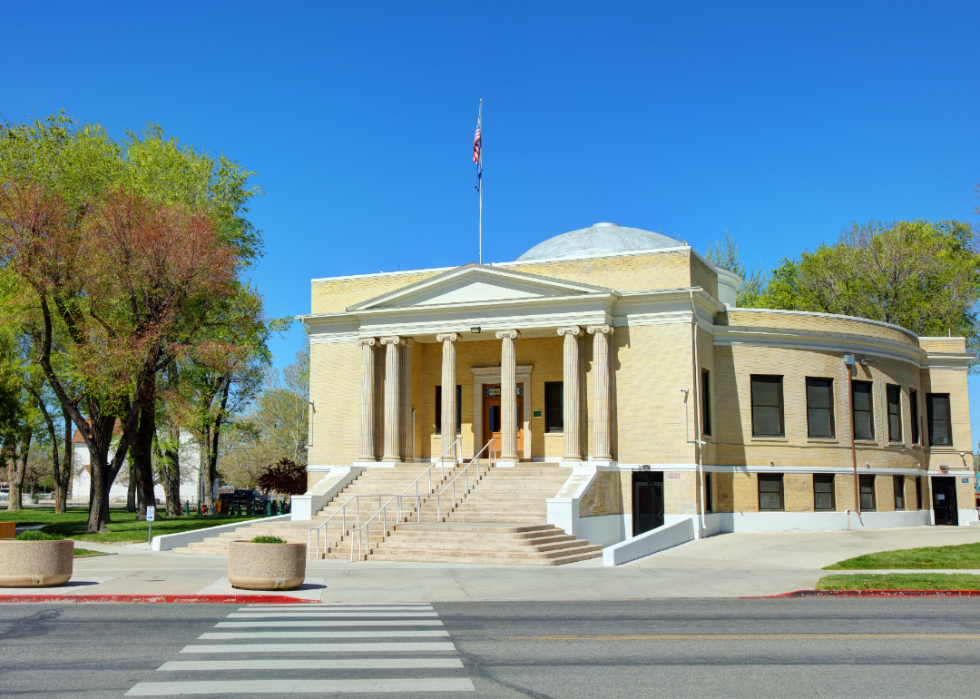
#16. Douglas County
Andrew Zarivny // Shutterstock
- Age-adjusted rate of all strokes among adults, estimates for 2021: 2.7% (range between 2.4% and 3.0%)
- Death rate for ischemic strokes, 2018-20: 15.7 per 100K people
- Death rate for hemorrhagic strokes, 2018-20: 9.0 per 100K people
- Death rate for ischemic strokes, 2018-20: 15.7 per 100K people
- Death rate for hemorrhagic strokes, 2018-20: 9.0 per 100K people
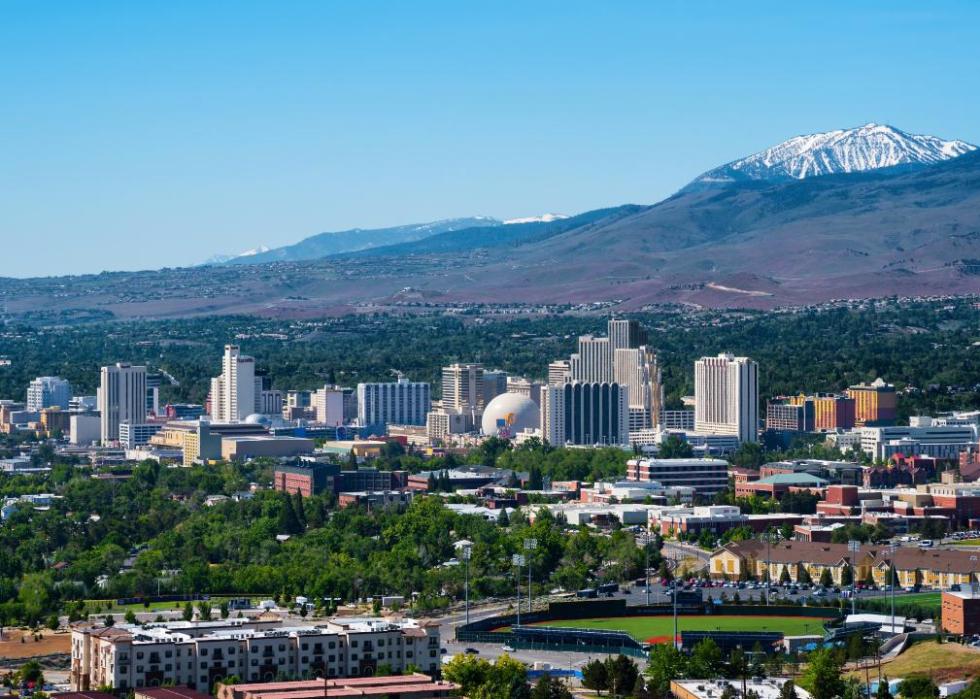
#15. Washoe County
Canva
- Age-adjusted rate of all strokes among adults, estimates for 2021: 2.7% (range between 2.4% and 3.1%)
- Death rate for ischemic strokes, 2018-20: 16.4 per 100K people
- Death rate for hemorrhagic strokes, 2018-20: 9.3 per 100K people
- Death rate for ischemic strokes, 2018-20: 16.4 per 100K people
- Death rate for hemorrhagic strokes, 2018-20: 9.3 per 100K people
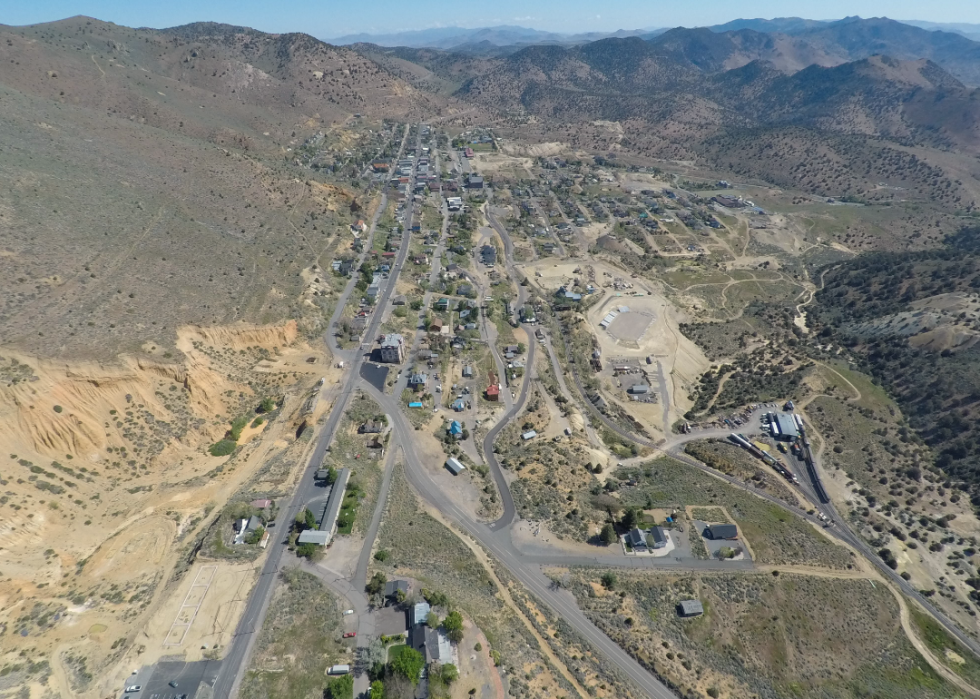
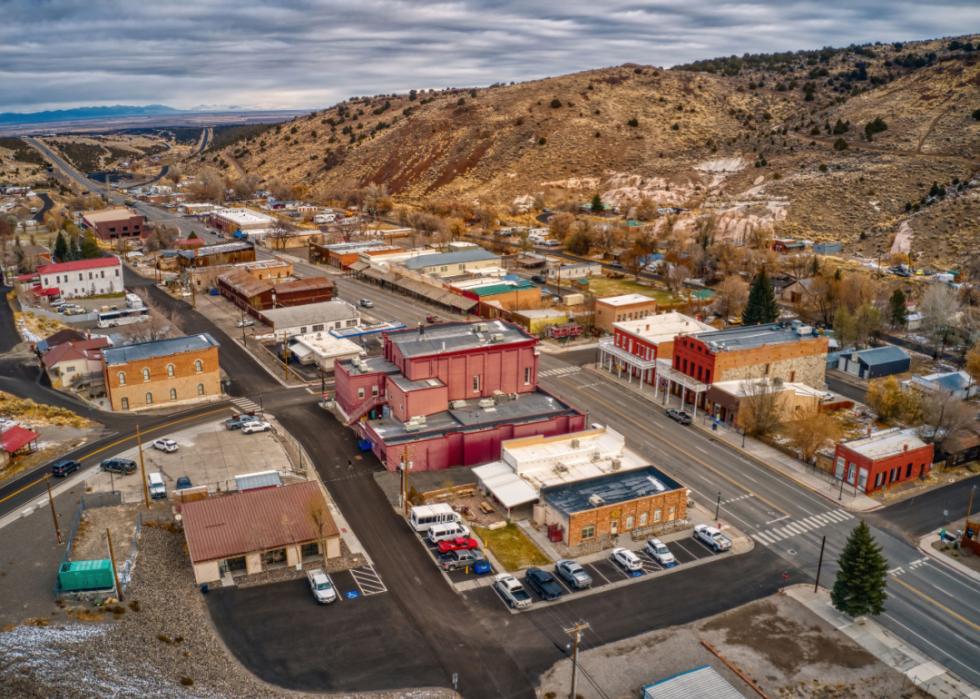
#14. Storey County

Danita Delimont // Shutterstock
- Age-adjusted rate of all strokes among adults, estimates for 2021: 2.8% (range between 2.5% and 3.2%)
- Death rate for ischemic strokes, 2018-20: 17.6 per 100K people
- Death rate for hemorrhagic strokes, 2018-20: 9.3 per 100K people
- Death rate for ischemic strokes, 2018-20: 17.6 per 100K people
- Death rate for hemorrhagic strokes, 2018-20: 9.3 per 100K people
#13. Churchill County
travelview // Shutterstock
- Age-adjusted rate of all strokes among adults, estimates for 2021: 2.8% (range between 2.5% and 3.2%)
- Death rate for ischemic strokes, 2018-20: 19.6 per 100K people
- Death rate for hemorrhagic strokes, 2018-20: 8.8 per 100K people
- Death rate for ischemic strokes, 2018-20: 19.6 per 100K people
- Death rate for hemorrhagic strokes, 2018-20: 8.8 per 100K people
You may also like: Counties with the most born-and-bred residents in Nevada
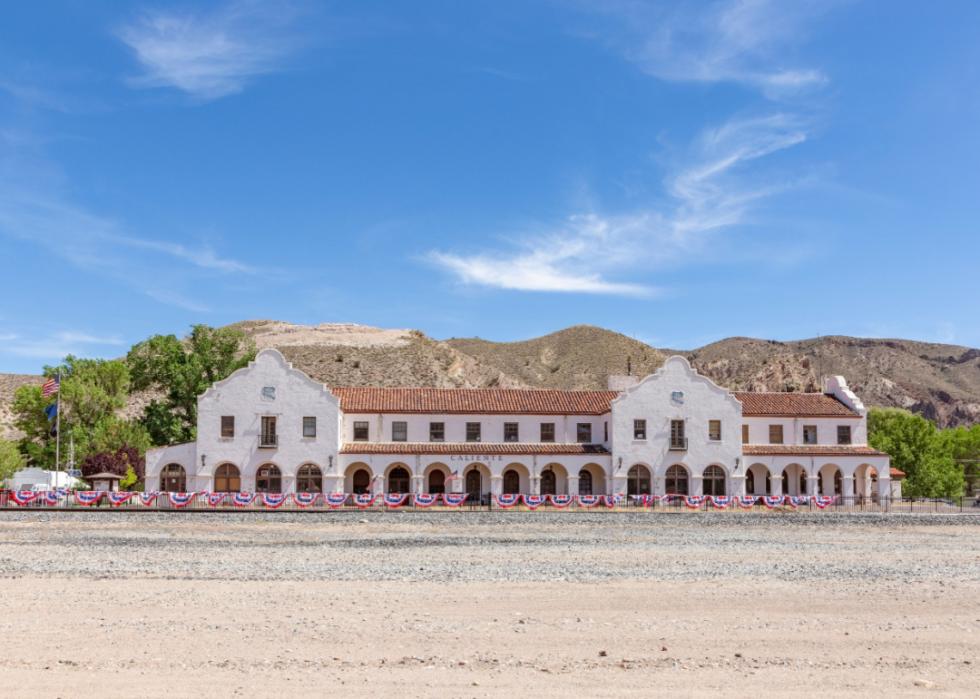
#12. Lincoln County
E Fehrenbacher // Shutterstock
- Age-adjusted rate of all strokes among adults, estimates for 2021: 2.9% (range between 2.6% and 3.3%)
- Death rate for ischemic strokes, 2018-20: 16.0 per 100K people
- Death rate for hemorrhagic strokes, 2018-20: 8.1 per 100K people
- Death rate for ischemic strokes, 2018-20: 16.0 per 100K people
- Death rate for hemorrhagic strokes, 2018-20: 8.1 per 100K people
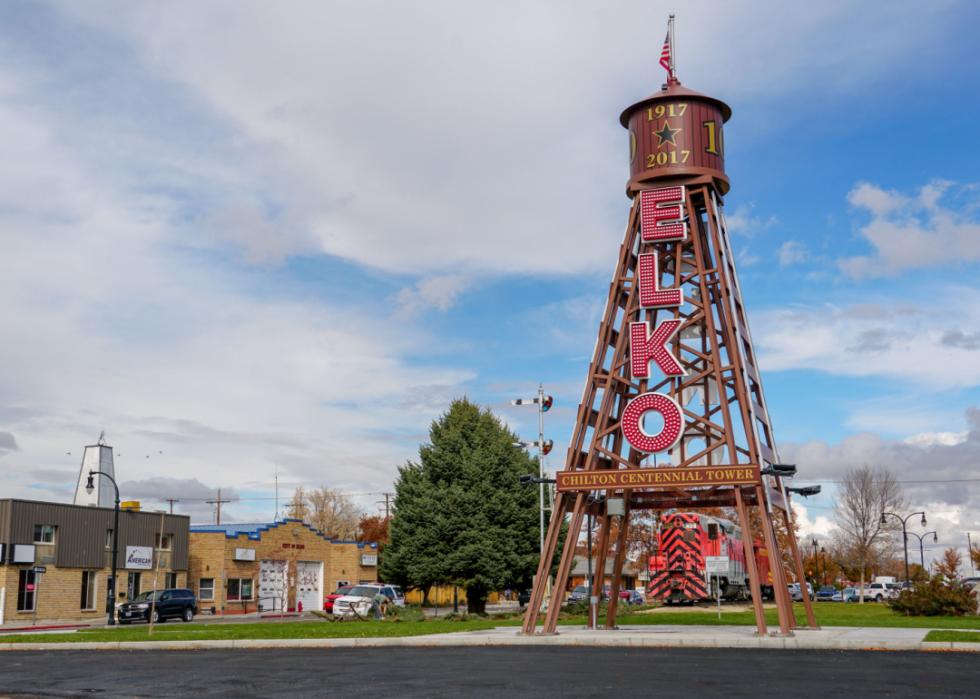
#11. Elko County
Canva
- Age-adjusted rate of all strokes among adults, estimates for 2021: 2.9% (range between 2.6% and 3.2%)
- Death rate for ischemic strokes, 2018-20: 17.0 per 100K people
- Death rate for hemorrhagic strokes, 2018-20: 9.1 per 100K people
- Death rate for ischemic strokes, 2018-20: 17.0 per 100K people
- Death rate for hemorrhagic strokes, 2018-20: 9.1 per 100K people
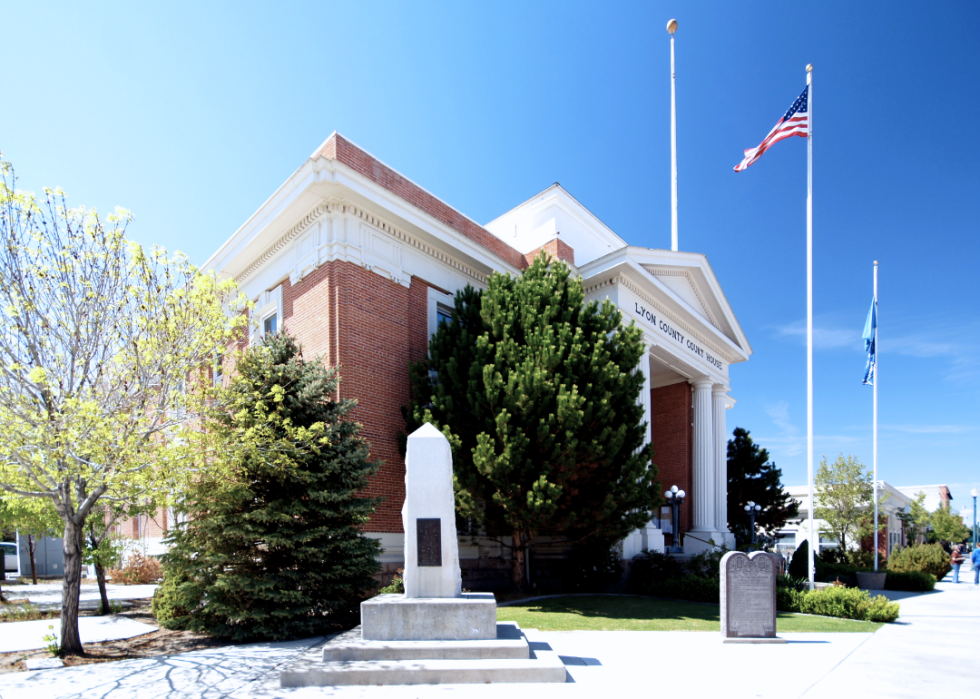
#10. Lyon County
Canva
- Age-adjusted rate of all strokes among adults, estimates for 2021: 2.9% (range between 2.6% and 3.3%)
- Death rate for ischemic strokes, 2018-20: 19.5 per 100K people
- Death rate for hemorrhagic strokes, 2018-20: 9.2 per 100K people
- Death rate for ischemic strokes, 2018-20: 19.5 per 100K people
- Death rate for hemorrhagic strokes, 2018-20: 9.2 per 100K people
#9. Humboldt County
Terence Mendoza // Shutterstock
- Age-adjusted rate of all strokes among adults, estimates for 2021: 3.0% (range between 2.6% and 3.3%)
- Death rate for ischemic strokes, 2018-20: 13.2 per 100K people
- Death rate for hemorrhagic strokes, 2018-20: 7.2 per 100K people
- Death rate for ischemic strokes, 2018-20: 13.2 per 100K people
- Death rate for hemorrhagic strokes, 2018-20: 7.2 per 100K people
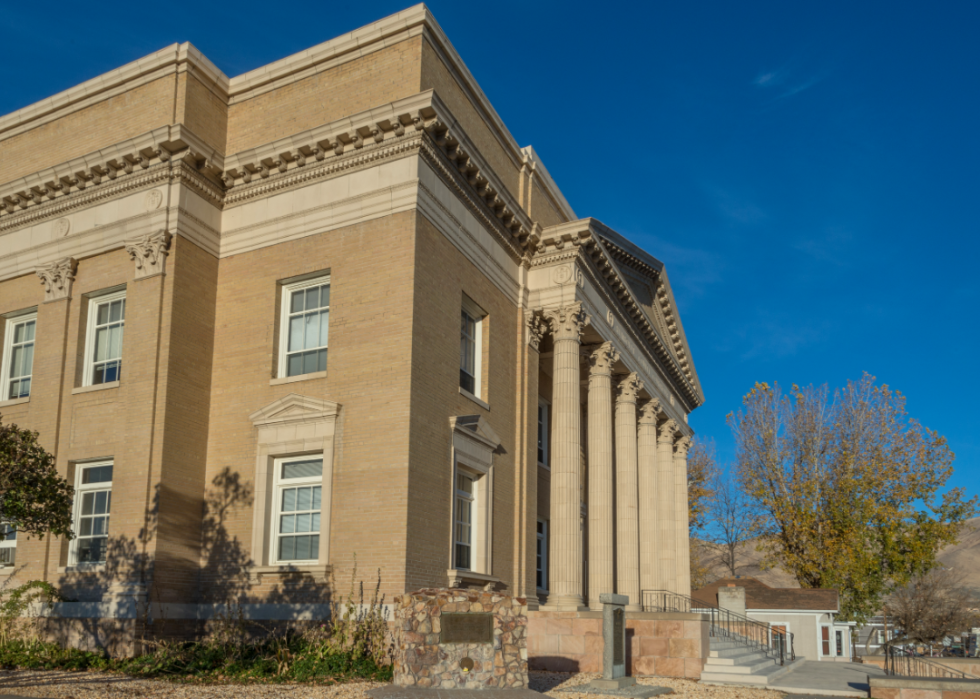
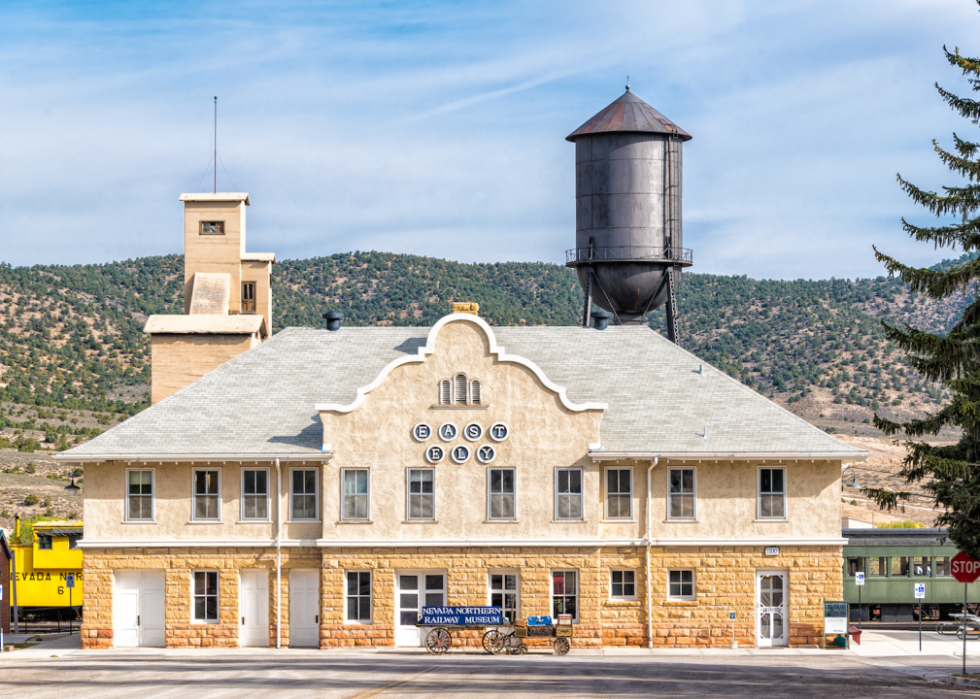
#8. White Pine County
Canva
- Age-adjusted rate of all strokes among adults, estimates for 2021: 3.0% (range between 2.6% and 3.4%)
- Death rate for ischemic strokes, 2018-20: 16.0 per 100K people
- Death rate for hemorrhagic strokes, 2018-20: 9.3 per 100K people
- Death rate for ischemic strokes, 2018-20: 16.0 per 100K people
- Death rate for hemorrhagic strokes, 2018-20: 9.3 per 100K people
You may also like: Where people in Nevada are moving to most
#7. Pershing County

randy andy // Shutterstock
- Age-adjusted rate of all strokes among adults, estimates for 2021: 3.0% (range between 2.7% and 3.3%)
- Death rate for ischemic strokes, 2018-20: 19.7 per 100K people
- Death rate for hemorrhagic strokes, 2018-20: 9.2 per 100K people
- Death rate for ischemic strokes, 2018-20: 19.7 per 100K people
- Death rate for hemorrhagic strokes, 2018-20: 9.2 per 100K people
#6. Clark County
Jacob Boomsma // Shutterstock
- Age-adjusted rate of all strokes among adults, estimates for 2021: 3.2% (range between 2.9% and 3.6%)
- Death rate for ischemic strokes, 2018-20: 19.0 per 100K people
- Death rate for hemorrhagic strokes, 2018-20: 9.5 per 100K people
- Death rate for ischemic strokes, 2018-20: 19.0 per 100K people
- Death rate for hemorrhagic strokes, 2018-20: 9.5 per 100K people
#5. Eureka County
Canva
- Age-adjusted rate of all strokes among adults, estimates for 2021: 3.2% (range between 2.8% and 3.5%)
- Death rate for ischemic strokes, 2018-20: 20.1 per 100K people
- Death rate for hemorrhagic strokes, 2018-20: 9.0 per 100K people
- Death rate for ischemic strokes, 2018-20: 20.1 per 100K people
- Death rate for hemorrhagic strokes, 2018-20: 9.0 per 100K people
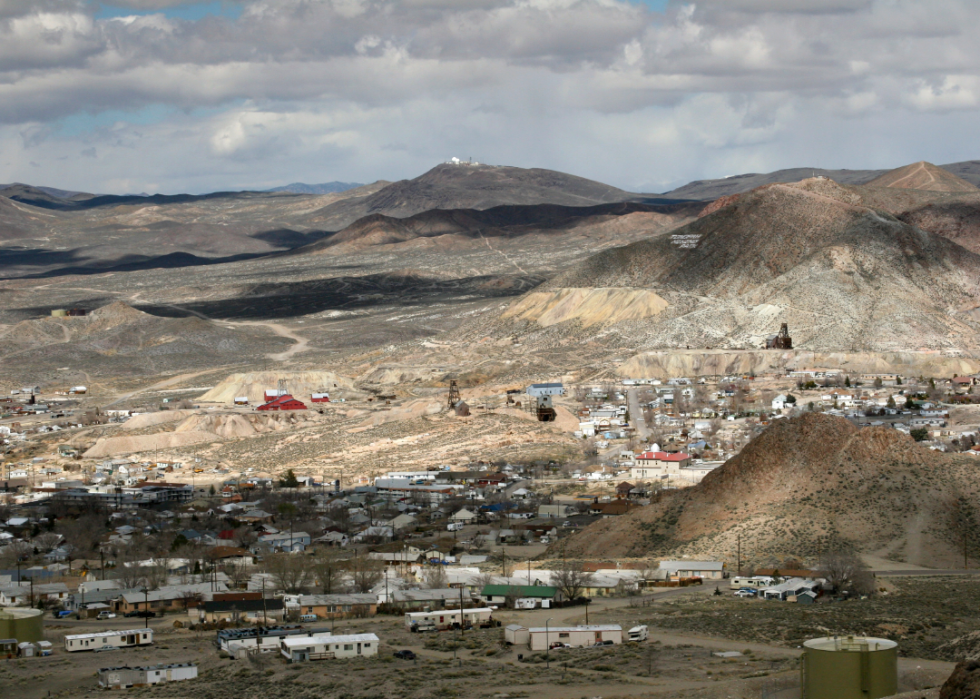
#4. Nye County
Canva
- Age-adjusted rate of all strokes among adults, estimates for 2021: 3.2% (range between 2.8% and 3.5%)
- Death rate for ischemic strokes, 2018-20: 21.8 per 100K people
- Death rate for hemorrhagic strokes, 2018-20: 9.7 per 100K people
- Death rate for ischemic strokes, 2018-20: 21.8 per 100K people
- Death rate for hemorrhagic strokes, 2018-20: 9.7 per 100K people
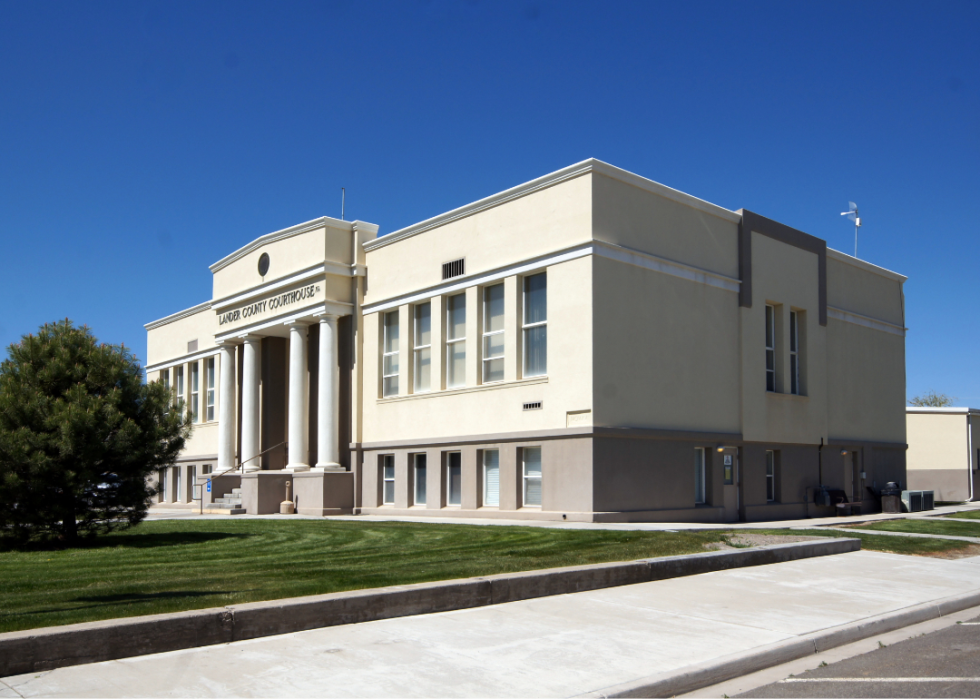
#3. Lander County
Canva
- Age-adjusted rate of all strokes among adults, estimates for 2021: 3.5% (range between 3.1% and 4.0%)
- Death rate for ischemic strokes, 2018-20: 22.2 per 100K people
- Death rate for hemorrhagic strokes, 2018-20: 9.7 per 100K people
- Death rate for ischemic strokes, 2018-20: 22.2 per 100K people
- Death rate for hemorrhagic strokes, 2018-20: 9.7 per 100K people
You may also like: Most popular boy names in the 60s in Nevada
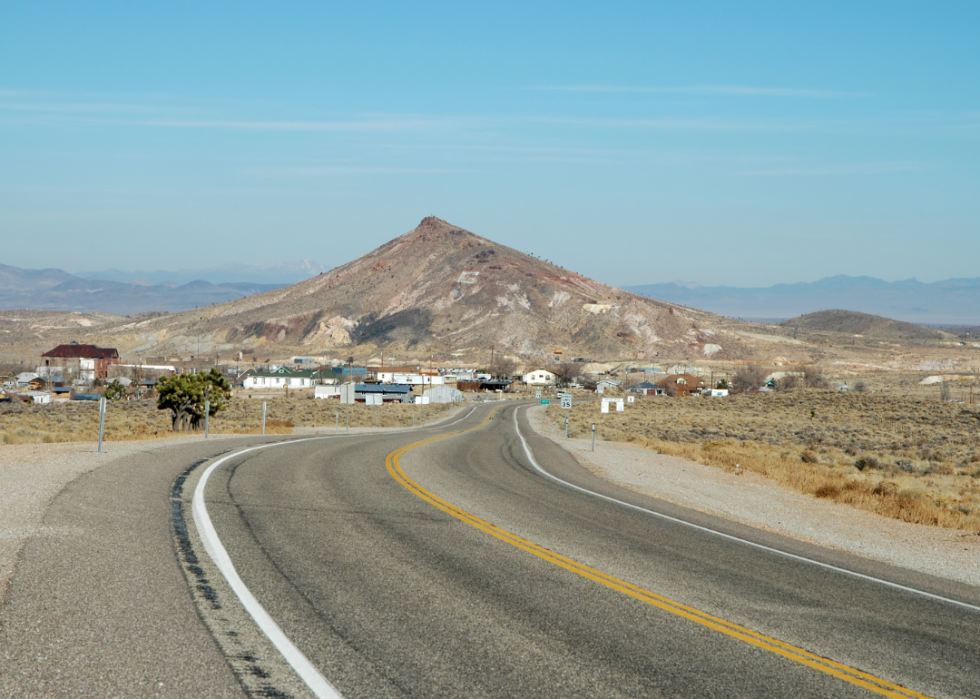
#2. Esmeralda County
Canva
- Age-adjusted rate of all strokes among adults, estimates for 2021: 3.7% (range between 3.3% and 4.0%)
- Death rate for ischemic strokes, 2018-20: 21.5 per 100K people
- Death rate for hemorrhagic strokes, 2018-20: 8.4 per 100K people
- Death rate for ischemic strokes, 2018-20: 21.5 per 100K people
- Death rate for hemorrhagic strokes, 2018-20: 8.4 per 100K people
This story features data reporting and writing by Emma Rubin and is part of a series utilizing data automation across 49 states.
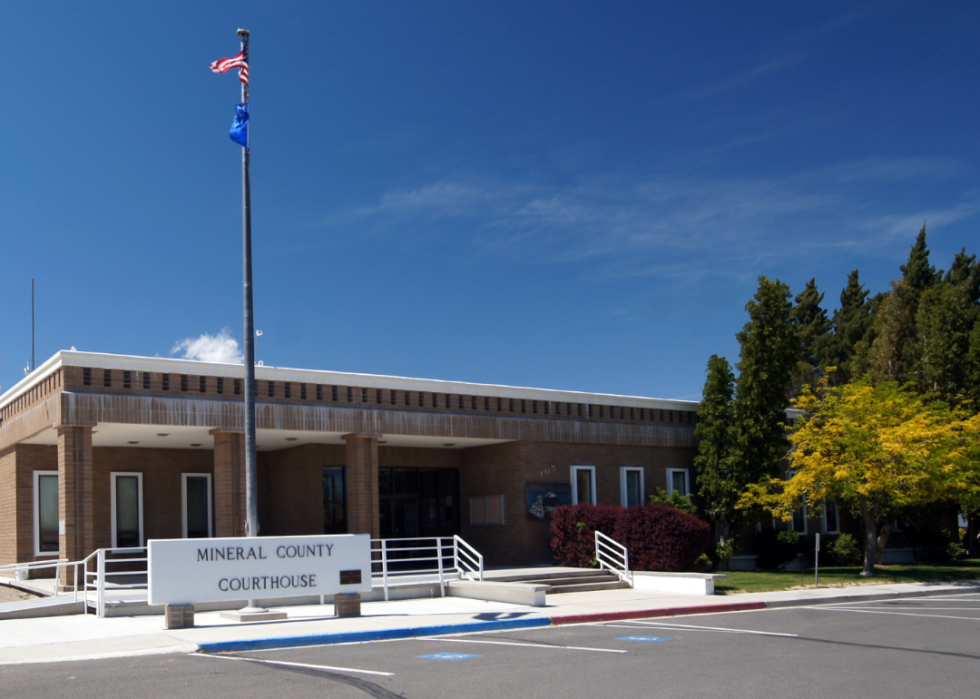
#1. Mineral County

Canva