Counties with the highest rates of strokes in New Hampshire
Wangkun Jia // Shutterstock
- Age-adjusted rate of all strokes among adults, estimates for 2021: 2.3% (range between 2.0% and 2.6%)
- Death rate for ischemic strokes, 2018-20: 12.8 per 100K people
- Death rate for hemorrhagic strokes, 2018-20: 7.1 per 100K people
- Death rate for ischemic strokes, 2018-20: 12.8 per 100K people
- Death rate for hemorrhagic strokes, 2018-20: 7.1 per 100K people
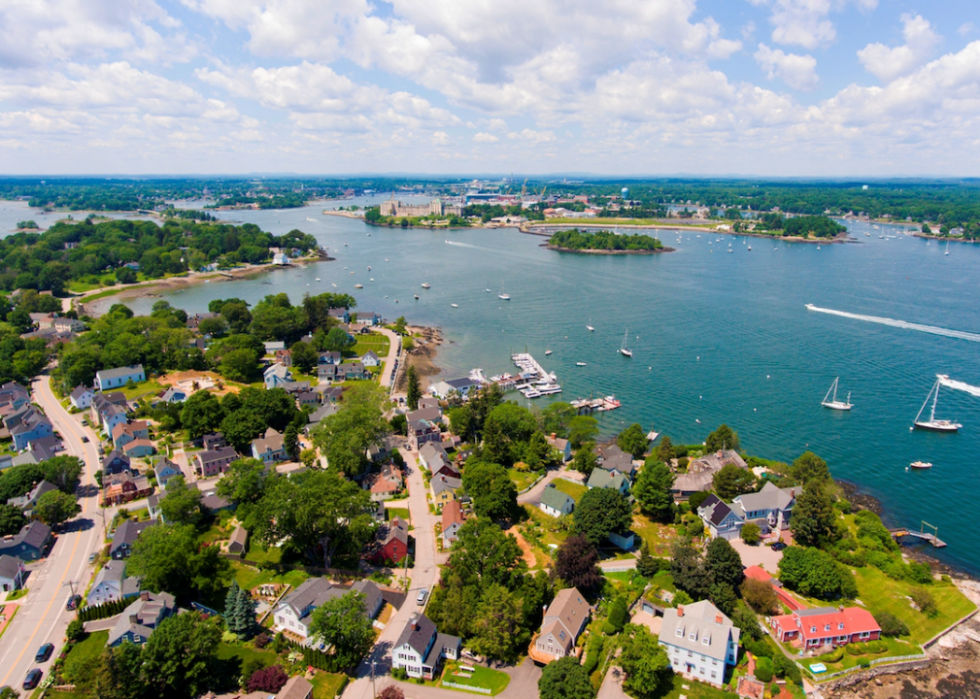
#10. Rockingham County

Canva
- Age-adjusted rate of all strokes among adults, estimates for 2021: 2.4% (range between 2.1% and 2.8%)
- Death rate for ischemic strokes, 2018-20: 11.7 per 100K people
- Death rate for hemorrhagic strokes, 2018-20: 6.8 per 100K people
- Death rate for ischemic strokes, 2018-20: 11.7 per 100K people
- Death rate for hemorrhagic strokes, 2018-20: 6.8 per 100K people
#9. Hillsborough County

Canva
- Age-adjusted rate of all strokes among adults, estimates for 2021: 2.4% (range between 2.1% and 2.8%)
- Death rate for ischemic strokes, 2018-20: 14.2 per 100K people
- Death rate for hemorrhagic strokes, 2018-20: 8.0 per 100K people
- Death rate for ischemic strokes, 2018-20: 14.2 per 100K people
- Death rate for hemorrhagic strokes, 2018-20: 8.0 per 100K people
#8. Merrimack County
NEKVT // Shutterstock
- Age-adjusted rate of all strokes among adults, estimates for 2021: 2.4% (range between 2.1% and 2.8%)
- Death rate for ischemic strokes, 2018-20: 16.7 per 100K people
- Death rate for hemorrhagic strokes, 2018-20: 8.8 per 100K people
- Death rate for ischemic strokes, 2018-20: 16.7 per 100K people
- Death rate for hemorrhagic strokes, 2018-20: 8.8 per 100K people
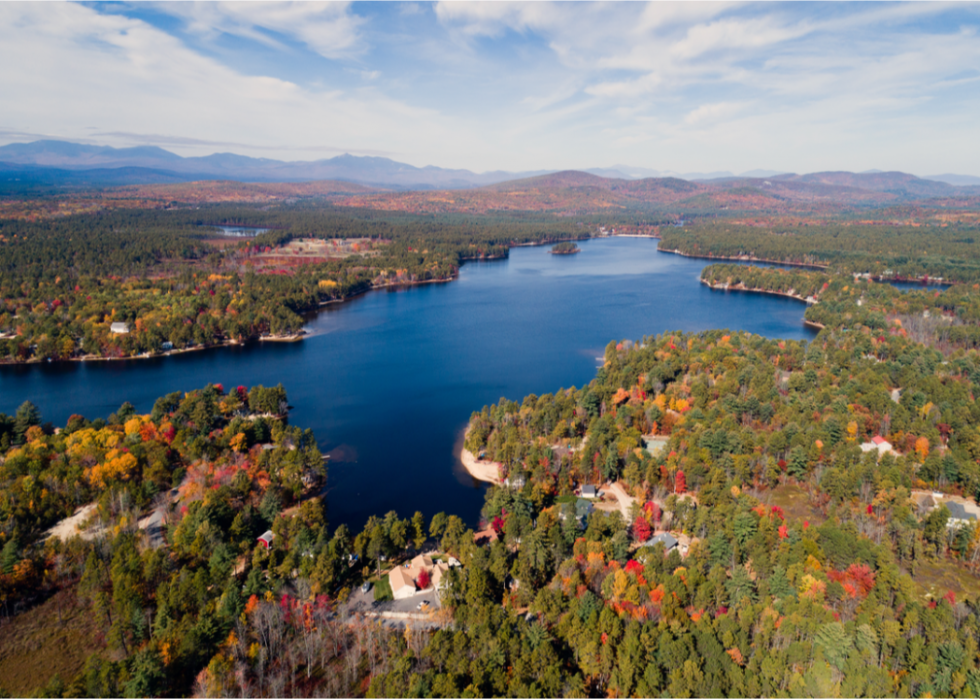
#7. Carroll County
Josh Conover // Shutterstock
- Age-adjusted rate of all strokes among adults, estimates for 2021: 2.4% (range between 2.1% and 2.8%)
- Death rate for ischemic strokes, 2018-20: 17.8 per 100K people
- Death rate for hemorrhagic strokes, 2018-20: 6.9 per 100K people
- Death rate for ischemic strokes, 2018-20: 17.8 per 100K people
- Death rate for hemorrhagic strokes, 2018-20: 6.9 per 100K people
You may also like: Counties with the highest rate of food insecurity in New Hampshire
#6. Grafton County
Canva
- Age-adjusted rate of all strokes among adults, estimates for 2021: 2.5% (range between 2.2% and 2.9%)
- Death rate for ischemic strokes, 2018-20: 14.6 per 100K people
- Death rate for hemorrhagic strokes, 2018-20: 9.1 per 100K people
- Death rate for ischemic strokes, 2018-20: 14.6 per 100K people
- Death rate for hemorrhagic strokes, 2018-20: 9.1 per 100K people
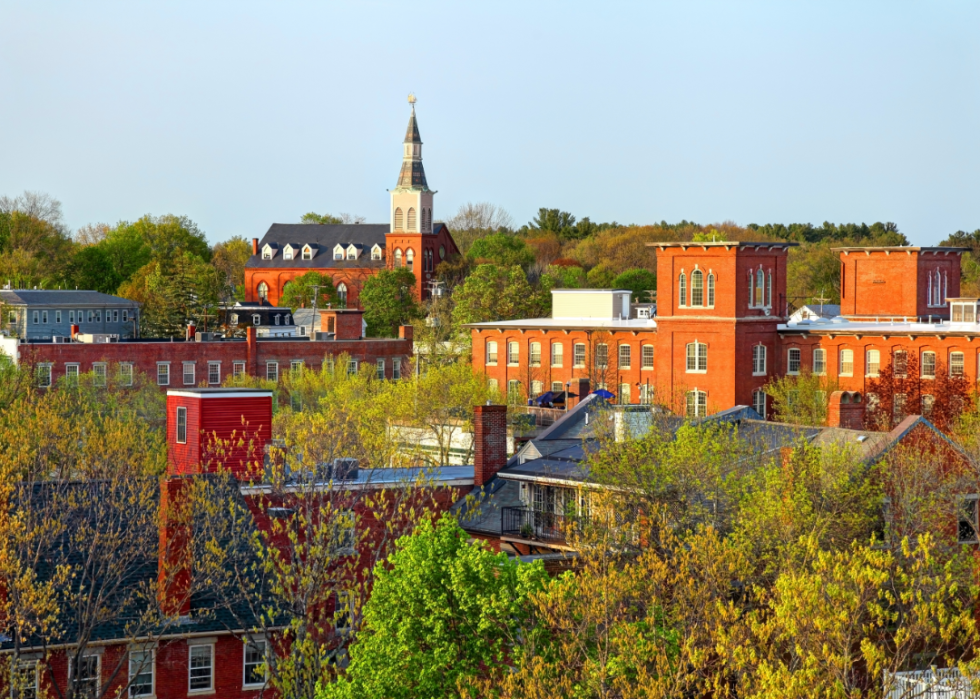
#5. Strafford County
Edward Fileding // Shutterstock
- Age-adjusted rate of all strokes among adults, estimates for 2021: 2.5% (range between 2.2% and 2.9%)
- Death rate for ischemic strokes, 2018-20: 15.3 per 100K people
- Death rate for hemorrhagic strokes, 2018-20: 6.9 per 100K people
- Death rate for ischemic strokes, 2018-20: 15.3 per 100K people
- Death rate for hemorrhagic strokes, 2018-20: 6.9 per 100K people
#4. Cheshire County

Canva
- Age-adjusted rate of all strokes among adults, estimates for 2021: 2.5% (range between 2.1% and 2.8%)
- Death rate for ischemic strokes, 2018-20: 16.2 per 100K people
- Death rate for hemorrhagic strokes, 2018-20: 9.0 per 100K people
- Death rate for ischemic strokes, 2018-20: 16.2 per 100K people
- Death rate for hemorrhagic strokes, 2018-20: 9.0 per 100K people
#3. Belknap County

Catharine Britt // Shutterstock
- Age-adjusted rate of all strokes among adults, estimates for 2021: 2.7% (range between 2.3% and 3.1%)
- Death rate for ischemic strokes, 2018-20: 12.4 per 100K people
- Death rate for hemorrhagic strokes, 2018-20: 6.6 per 100K people
- Death rate for ischemic strokes, 2018-20: 12.4 per 100K people
- Death rate for hemorrhagic strokes, 2018-20: 6.6 per 100K people
#2. Sullivan County
Canva
- Age-adjusted rate of all strokes among adults, estimates for 2021: 2.9% (range between 2.5% and 3.3%)
- Death rate for ischemic strokes, 2018-20: 17.8 per 100K people
- Death rate for hemorrhagic strokes, 2018-20: 7.8 per 100K people
- Death rate for ischemic strokes, 2018-20: 17.8 per 100K people
- Death rate for hemorrhagic strokes, 2018-20: 7.8 per 100K people
You may also like: Best counties to retire to in New Hampshire
This story features data reporting and writing by Emma Rubin and is part of a series utilizing data automation across 49 states.
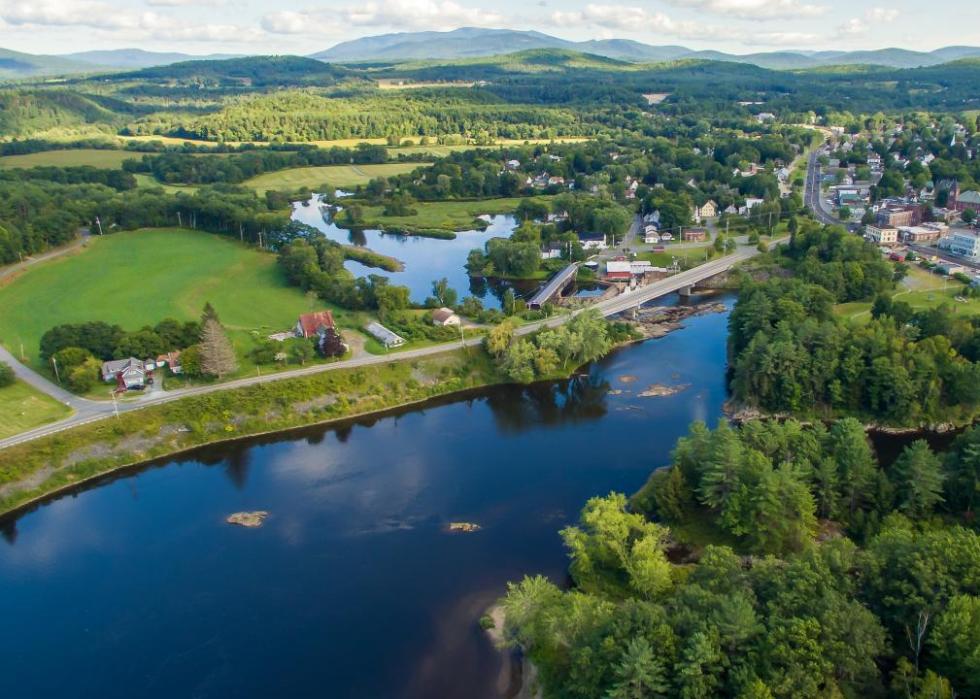
#1. Coos County

Canva