Counties with the most bridges in New Hampshire

- Total bridges: 108 (4.3% of bridges in the state)
- Share of bridges in poor condition: 6.5%

- Total bridges: 133 (5.3% of bridges in the state)
- Share of bridges in poor condition: 9.0%

- Total bridges: 156 (6.2% of bridges in the state)
- Share of bridges in poor condition: 5.8%
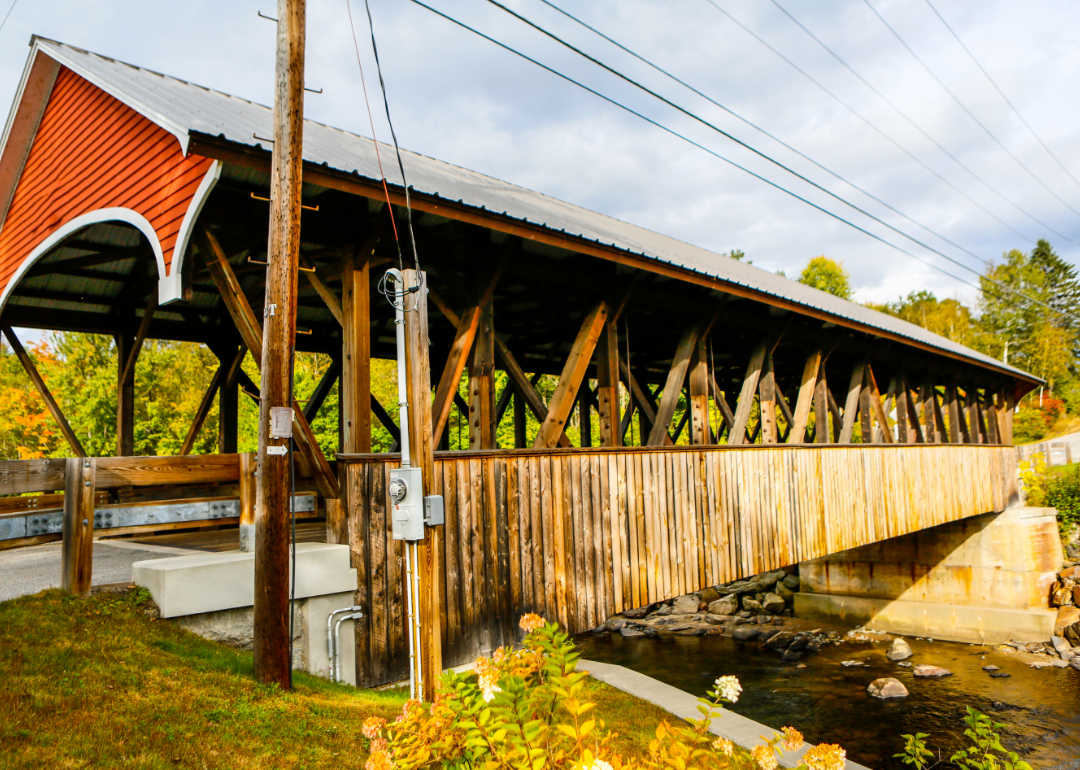
- Total bridges: 186 (7.4% of bridges in the state)
- Share of bridges in poor condition: 7.0%
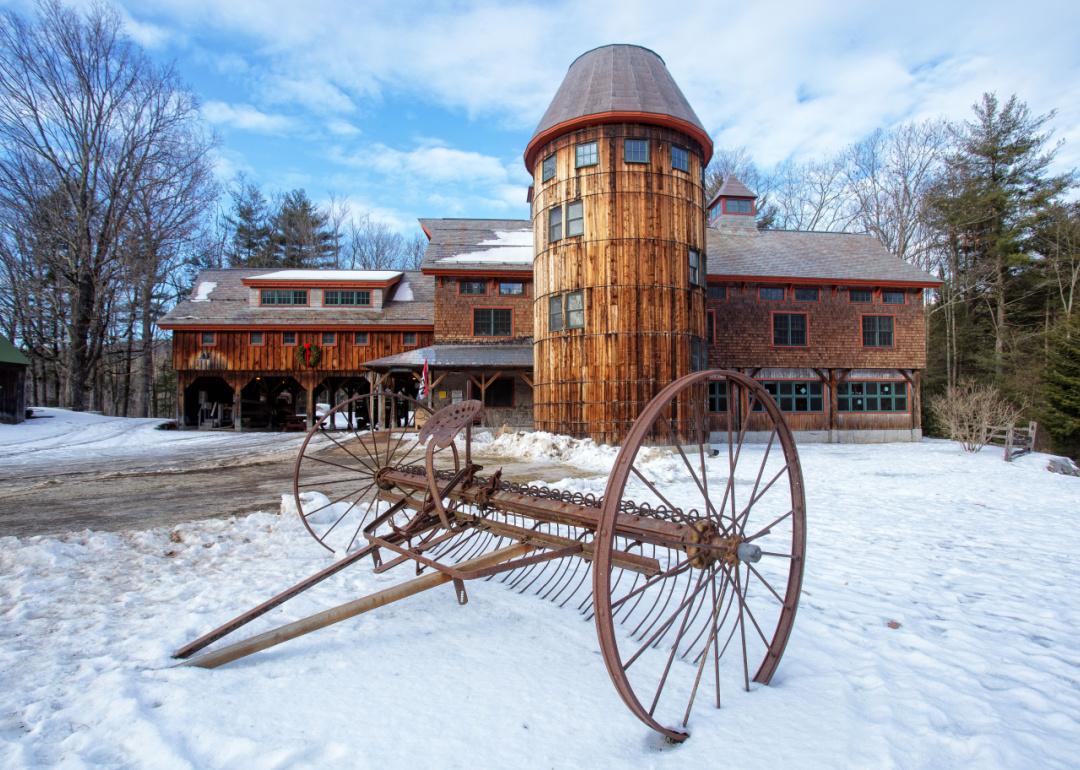
- Total bridges: 189 (7.5% of bridges in the state)
- Share of bridges in poor condition: 11.6%

- Total bridges: 190 (7.6% of bridges in the state)
- Share of bridges in poor condition: 10.0%

- Total bridges: 305 (12.1% of bridges in the state)
- Share of bridges in poor condition: 8.5%

- Total bridges: 325 (12.9% of bridges in the state)
- Share of bridges in poor condition: 9.5%

- Total bridges: 382 (15.2% of bridges in the state)
- Share of bridges in poor condition: 9.9%

- Total bridges: 540 (21.5% of bridges in the state)
- Share of bridges in poor condition: 7.0%
This story features data reporting and writing by Paxtyn Merten, and is part of a series utilizing data automation across 50 states.
