Counties with the highest rates of strokes in New Jersey
FotosForTheFuture // Shutterstock
- Age-adjusted rate of all strokes among adults, estimates for 2021: 2.1% (range between 1.9% and 2.4%)
- Death rate for ischemic strokes, 2018-20: 13.6 per 100K people
- Death rate for hemorrhagic strokes, 2018-20: 8.8 per 100K people
- Death rate for ischemic strokes, 2018-20: 13.6 per 100K people
- Death rate for hemorrhagic strokes, 2018-20: 8.8 per 100K people
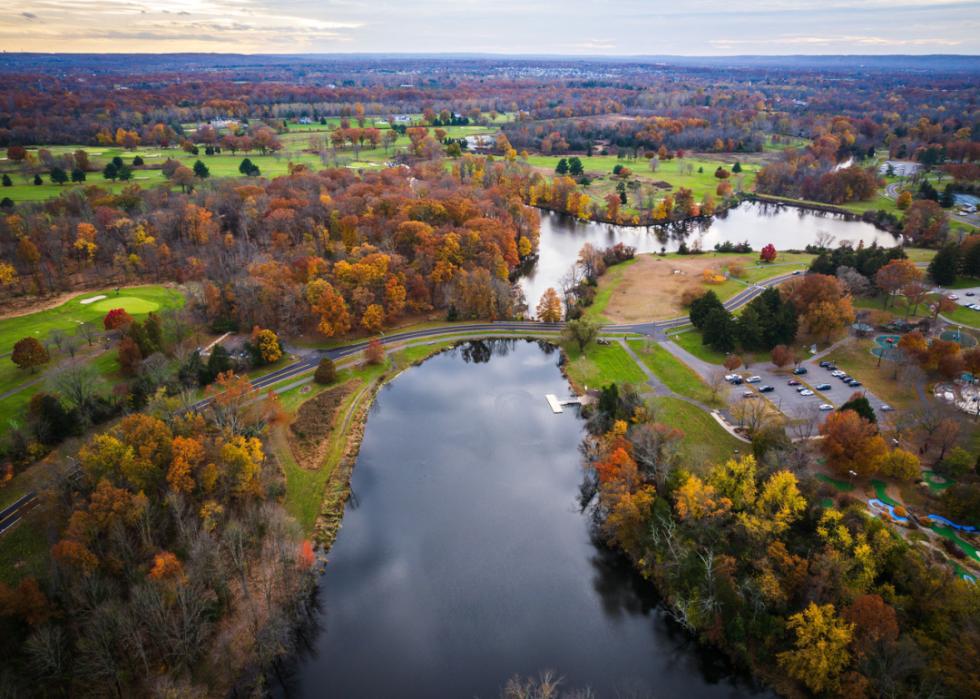
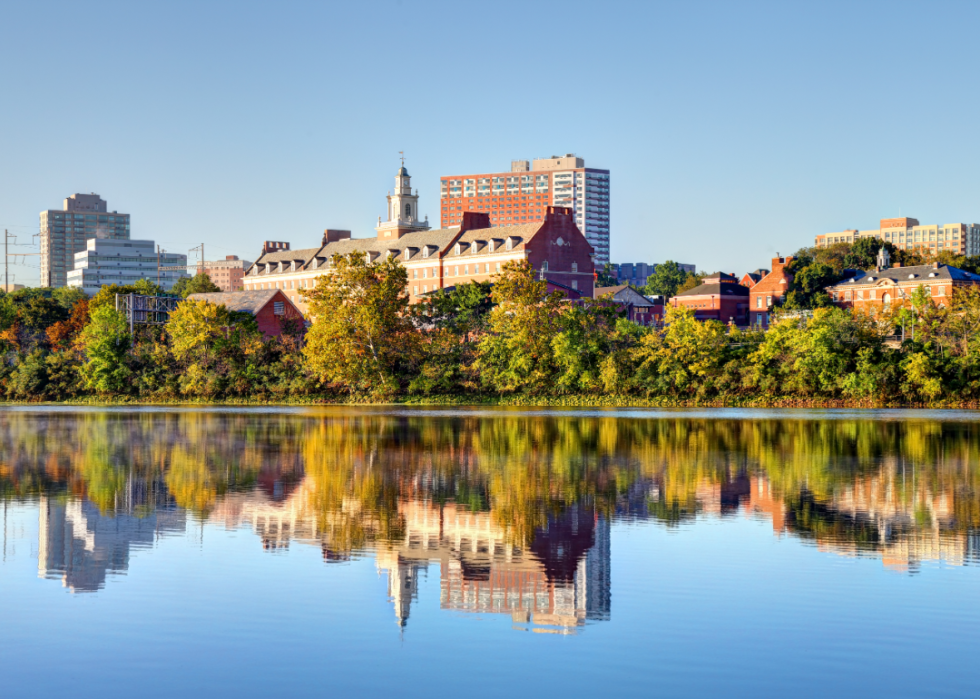
#21. Somerset County

Mihai_Andritoiu // Shutterstock
- Age-adjusted rate of all strokes among adults, estimates for 2021: 2.1% (range between 1.8% and 2.4%)
- Death rate for ischemic strokes, 2018-20: 13.9 per 100K people
- Death rate for hemorrhagic strokes, 2018-20: 9.0 per 100K people
- Death rate for ischemic strokes, 2018-20: 13.9 per 100K people
- Death rate for hemorrhagic strokes, 2018-20: 9.0 per 100K people
#20. Morris County
EQRoy // Shutterstock
- Age-adjusted rate of all strokes among adults, estimates for 2021: 2.1% (range between 1.8% and 2.4%)
- Death rate for ischemic strokes, 2018-20: 14.6 per 100K people
- Death rate for hemorrhagic strokes, 2018-20: 8.2 per 100K people
- Death rate for ischemic strokes, 2018-20: 14.6 per 100K people
- Death rate for hemorrhagic strokes, 2018-20: 8.2 per 100K people
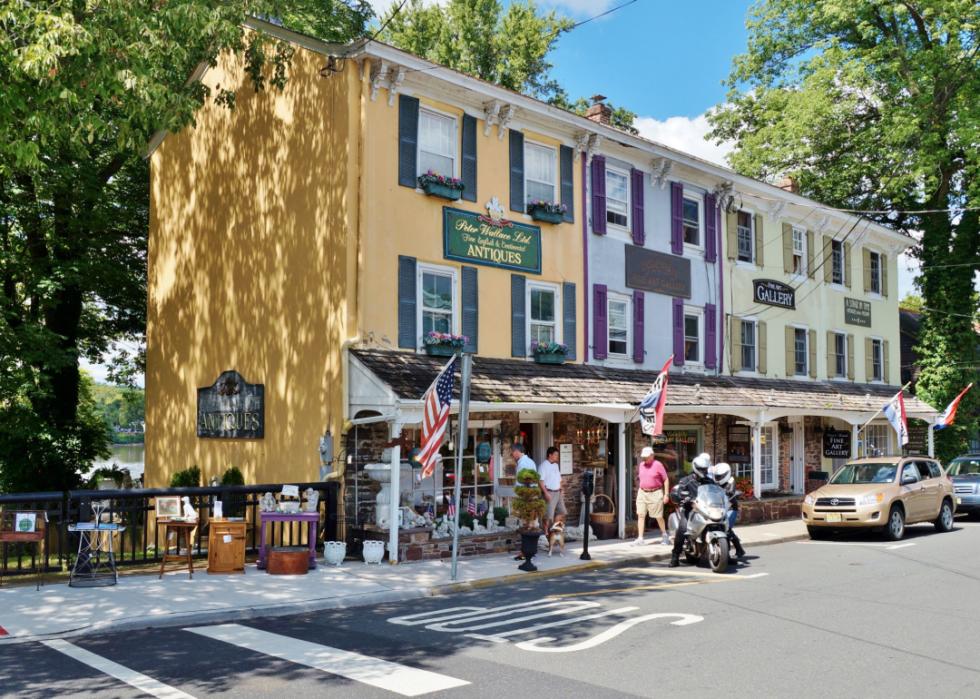
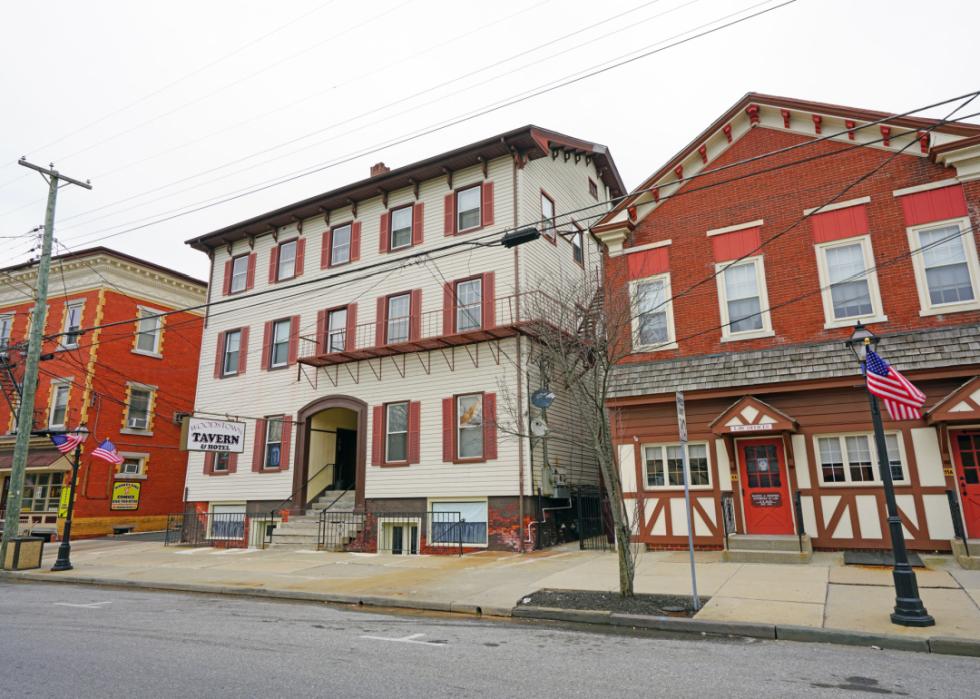
#19. Hunterdon County
Canva
- Age-adjusted rate of all strokes among adults, estimates for 2021: 2.2% (range between 1.9% and 2.5%)
- Death rate for ischemic strokes, 2018-20: 12.2 per 100K people
- Death rate for hemorrhagic strokes, 2018-20: 7.3 per 100K people
- Death rate for ischemic strokes, 2018-20: 12.2 per 100K people
- Death rate for hemorrhagic strokes, 2018-20: 7.3 per 100K people
#18. Bergen County
Andrew F. Kazmierski // Shutterstock
- Age-adjusted rate of all strokes among adults, estimates for 2021: 2.2% (range between 2.0% and 2.6%)
- Death rate for ischemic strokes, 2018-20: 16.1 per 100K people
- Death rate for hemorrhagic strokes, 2018-20: 8.9 per 100K people
- Death rate for ischemic strokes, 2018-20: 16.1 per 100K people
- Death rate for hemorrhagic strokes, 2018-20: 8.9 per 100K people
You may also like: New Jersey is the #1 state with the most COVID-19 worker safety violations
#17. Monmouth County
Linda Harms // Shutterstock
- Age-adjusted rate of all strokes among adults, estimates for 2021: 2.3% (range between 2.0% and 2.6%)
- Death rate for ischemic strokes, 2018-20: 14.0 per 100K people
- Death rate for hemorrhagic strokes, 2018-20: 8.8 per 100K people
- Death rate for ischemic strokes, 2018-20: 14.0 per 100K people
- Death rate for hemorrhagic strokes, 2018-20: 8.8 per 100K people
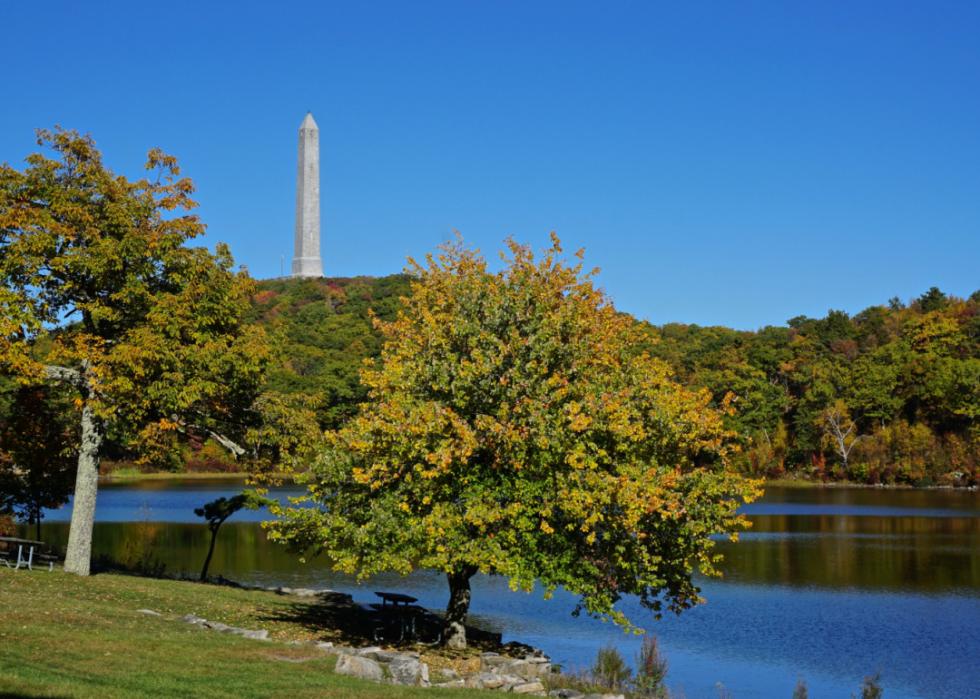
#16. Sussex County
Canva
- Age-adjusted rate of all strokes among adults, estimates for 2021: 2.4% (range between 2.1% and 2.7%)
- Death rate for ischemic strokes, 2018-20: 14.0 per 100K people
- Death rate for hemorrhagic strokes, 2018-20: 8.8 per 100K people
- Death rate for ischemic strokes, 2018-20: 14.0 per 100K people
- Death rate for hemorrhagic strokes, 2018-20: 8.8 per 100K people
#15. Middlesex County
Canva
- Age-adjusted rate of all strokes among adults, estimates for 2021: 2.4% (range between 2.1% and 2.8%)
- Death rate for ischemic strokes, 2018-20: 15.0 per 100K people
- Death rate for hemorrhagic strokes, 2018-20: 8.0 per 100K people
- Death rate for ischemic strokes, 2018-20: 15.0 per 100K people
- Death rate for hemorrhagic strokes, 2018-20: 8.0 per 100K people
#14. Warren County
EQRoy // Shutterstock
- Age-adjusted rate of all strokes among adults, estimates for 2021: 2.5% (range between 2.2% and 2.8%)
- Death rate for ischemic strokes, 2018-20: 18.2 per 100K people
- Death rate for hemorrhagic strokes, 2018-20: 10.7 per 100K people
- Death rate for ischemic strokes, 2018-20: 18.2 per 100K people
- Death rate for hemorrhagic strokes, 2018-20: 10.7 per 100K people
#13. Burlington County
Thomas Kloc // Shutterstock
- Age-adjusted rate of all strokes among adults, estimates for 2021: 2.5% (range between 2.2% and 2.8%)
- Death rate for ischemic strokes, 2018-20: 19.4 per 100K people
- Death rate for hemorrhagic strokes, 2018-20: 10.8 per 100K people
- Death rate for ischemic strokes, 2018-20: 19.4 per 100K people
- Death rate for hemorrhagic strokes, 2018-20: 10.8 per 100K people
You may also like: Counties with the oldest homes in New Jersey
#12. Gloucester County
Jorge Moro // Shutterstock
- Age-adjusted rate of all strokes among adults, estimates for 2021: 2.5% (range between 2.2% and 2.9%)
- Death rate for ischemic strokes, 2018-20: 19.9 per 100K people
- Death rate for hemorrhagic strokes, 2018-20: 9.6 per 100K people
- Death rate for ischemic strokes, 2018-20: 19.9 per 100K people
- Death rate for hemorrhagic strokes, 2018-20: 9.6 per 100K people
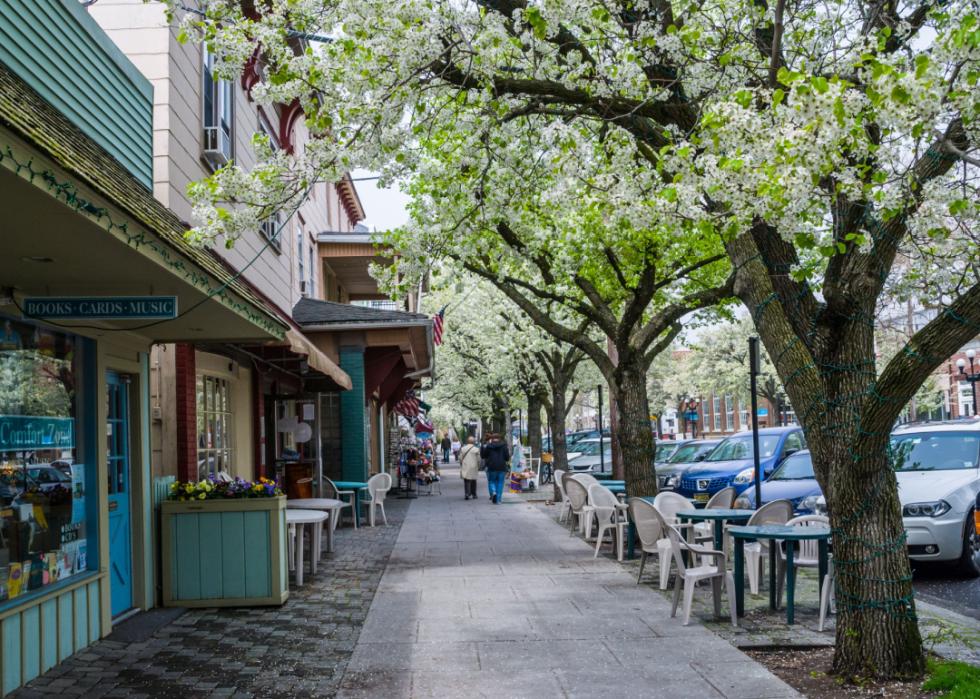
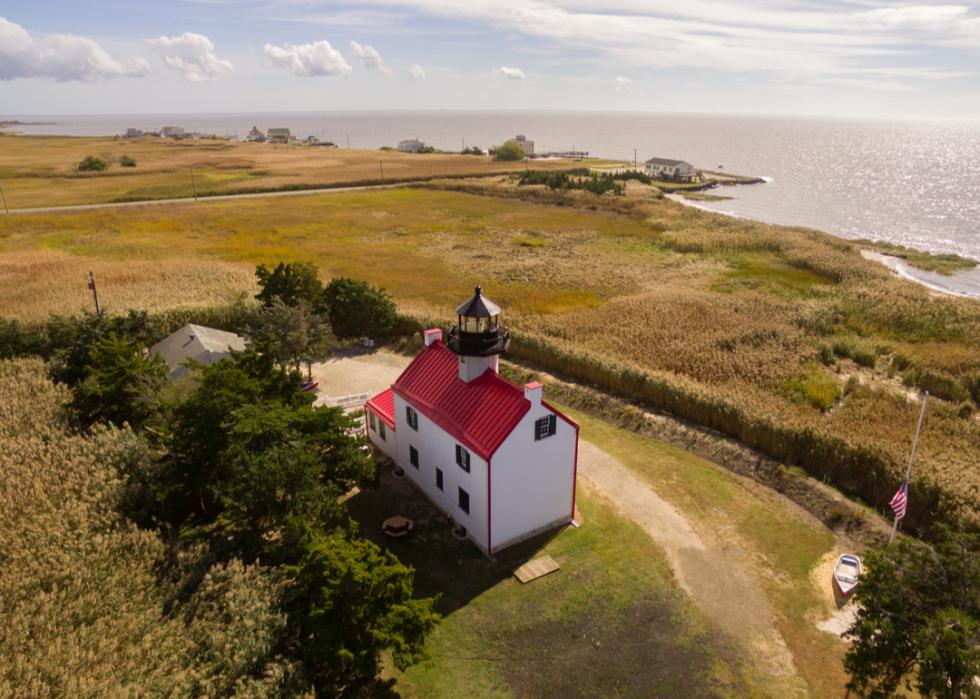
#11. Cape May County

f11 photo // Shutterstock
- Age-adjusted rate of all strokes among adults, estimates for 2021: 2.6% (range between 2.3% and 2.9%)
- Death rate for ischemic strokes, 2018-20: 12.5 per 100K people
- Death rate for hemorrhagic strokes, 2018-20: 9.0 per 100K people
- Death rate for ischemic strokes, 2018-20: 12.5 per 100K people
- Death rate for hemorrhagic strokes, 2018-20: 9.0 per 100K people
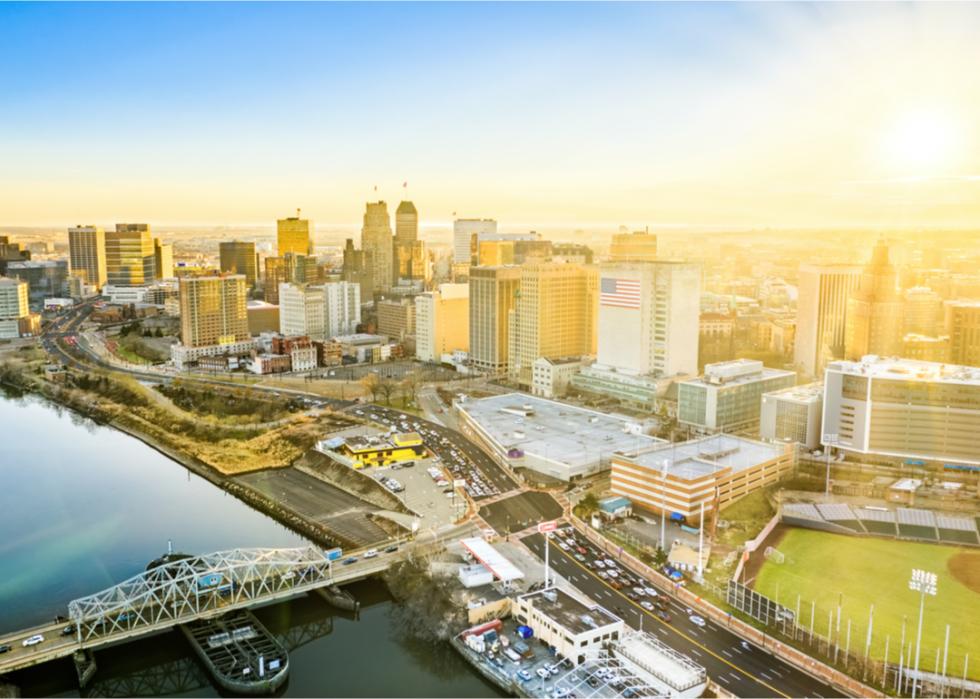
#10. Hudson County
Canva
- Age-adjusted rate of all strokes among adults, estimates for 2021: 2.6% (range between 2.2% and 2.9%)
- Death rate for ischemic strokes, 2018-20: 16.1 per 100K people
- Death rate for hemorrhagic strokes, 2018-20: 8.8 per 100K people
- Death rate for ischemic strokes, 2018-20: 16.1 per 100K people
- Death rate for hemorrhagic strokes, 2018-20: 8.8 per 100K people
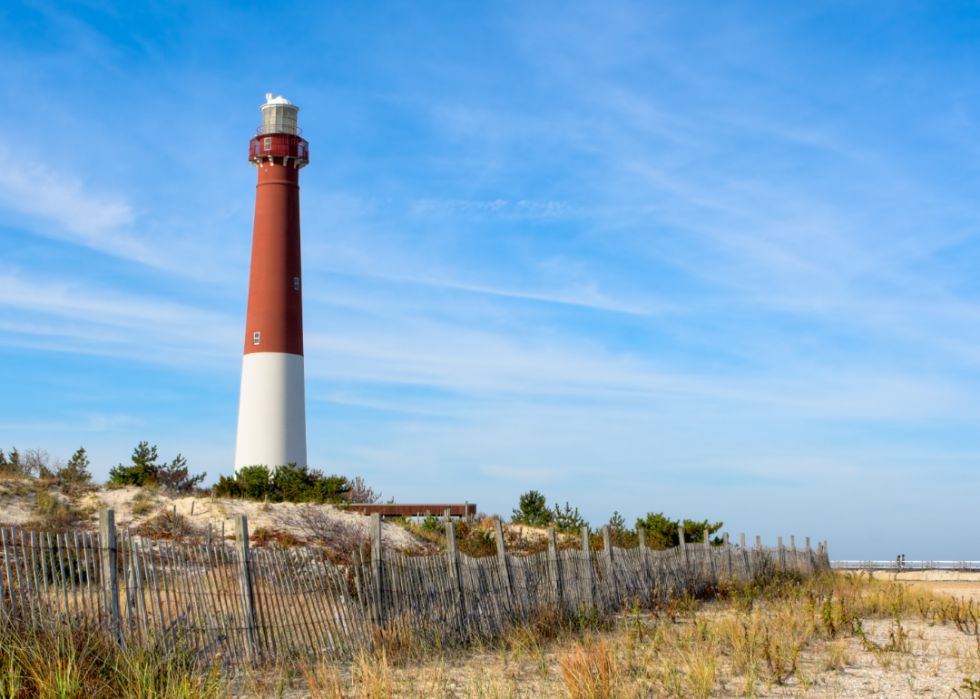
#9. Ocean County
Canva
- Age-adjusted rate of all strokes among adults, estimates for 2021: 2.7% (range between 2.4% and 3.0%)
- Death rate for ischemic strokes, 2018-20: 13.7 per 100K people
- Death rate for hemorrhagic strokes, 2018-20: 9.0 per 100K people
- Death rate for ischemic strokes, 2018-20: 13.7 per 100K people
- Death rate for hemorrhagic strokes, 2018-20: 9.0 per 100K people
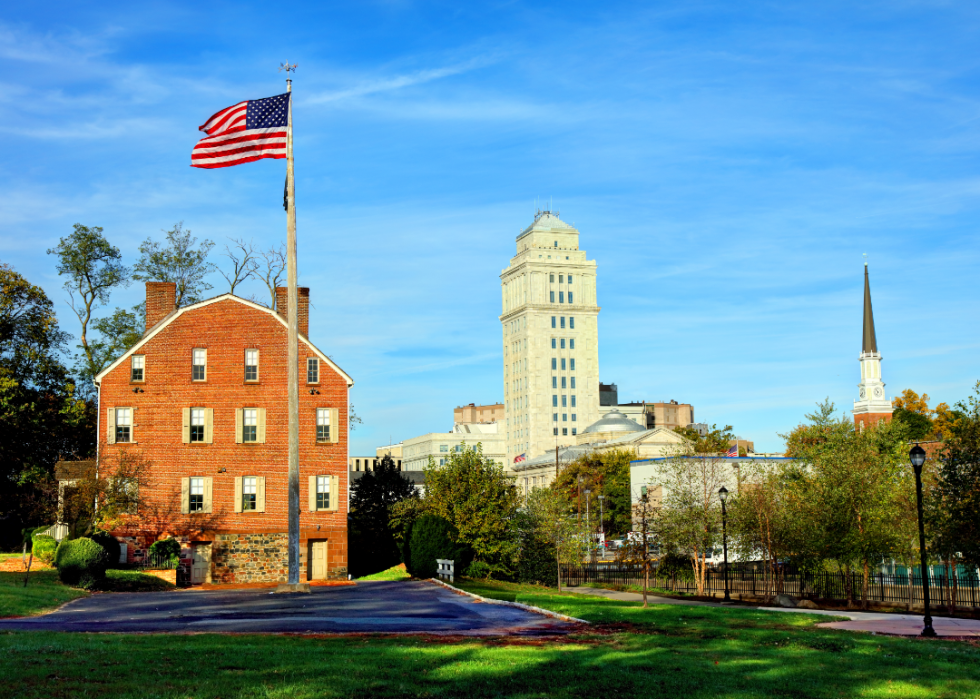
#8. Union County
Paul Brady Photography // Shutterstock
- Age-adjusted rate of all strokes among adults, estimates for 2021: 2.7% (range between 2.3% and 3.0%)
- Death rate for ischemic strokes, 2018-20: 15.4 per 100K people
- Death rate for hemorrhagic strokes, 2018-20: 9.4 per 100K people
- Death rate for ischemic strokes, 2018-20: 15.4 per 100K people
- Death rate for hemorrhagic strokes, 2018-20: 9.4 per 100K people
You may also like: Highest rated IPAs in New Jersey
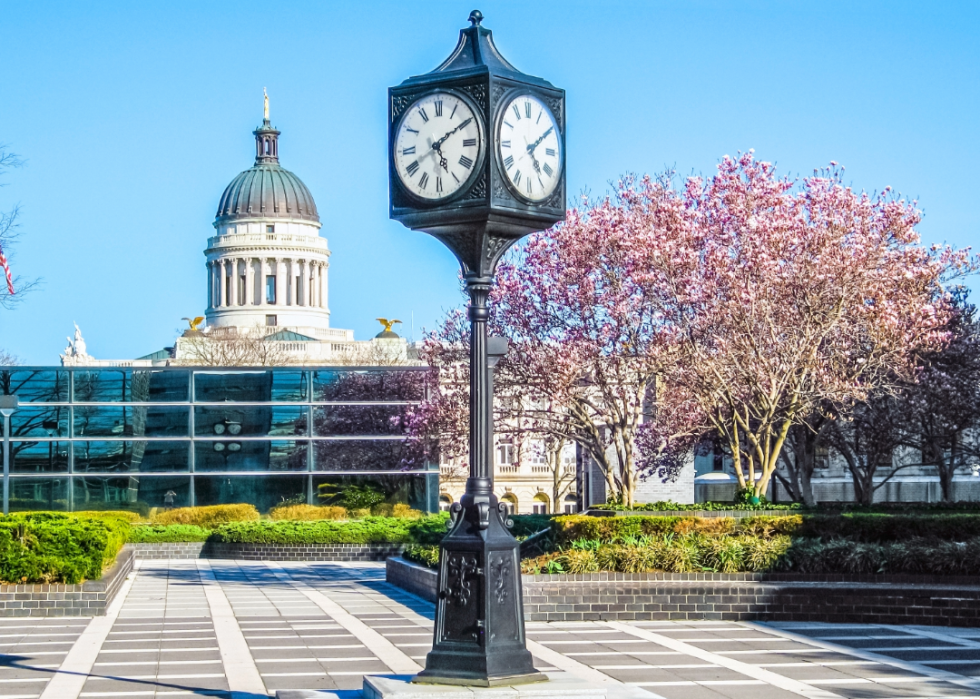
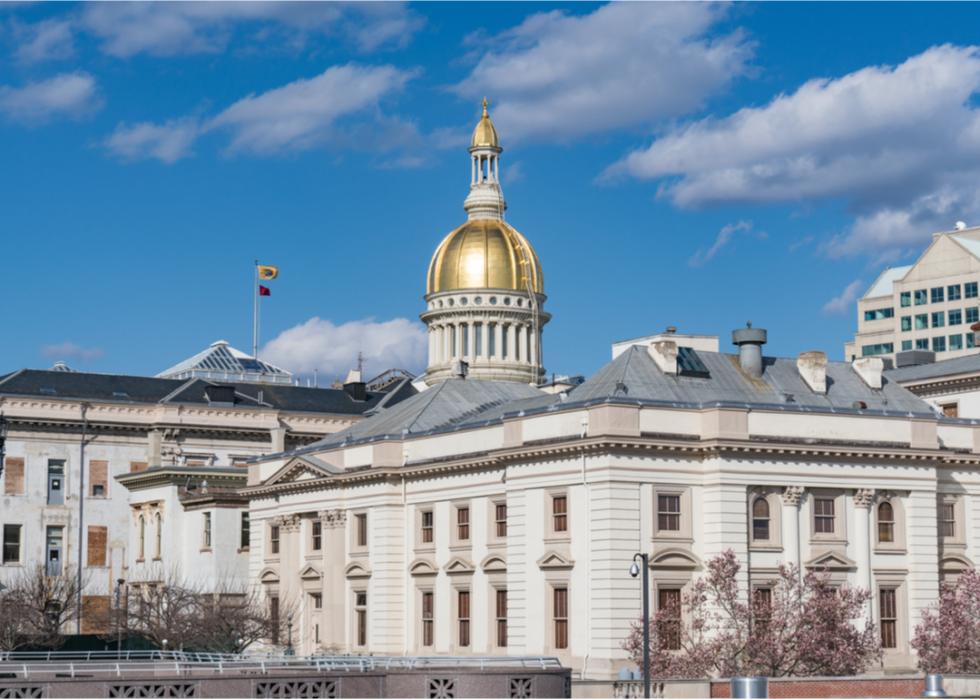
#7. Mercer County
Canva
- Age-adjusted rate of all strokes among adults, estimates for 2021: 2.8% (range between 2.5% and 3.1%)
- Death rate for ischemic strokes, 2018-20: 19.1 per 100K people
- Death rate for hemorrhagic strokes, 2018-20: 11.3 per 100K people
- Death rate for ischemic strokes, 2018-20: 19.1 per 100K people
- Death rate for hemorrhagic strokes, 2018-20: 11.3 per 100K people
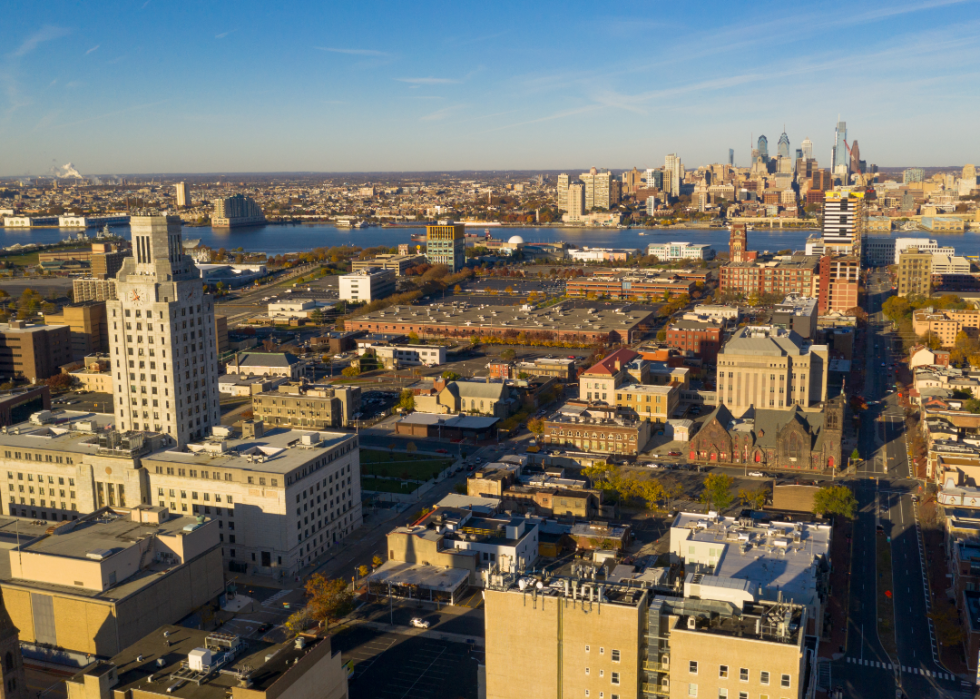
#6. Camden County
Canva
- Age-adjusted rate of all strokes among adults, estimates for 2021: 2.9% (range between 2.6% and 3.2%)
- Death rate for ischemic strokes, 2018-20: 13.7 per 100K people
- Death rate for hemorrhagic strokes, 2018-20: 9.5 per 100K people
- Death rate for ischemic strokes, 2018-20: 13.7 per 100K people
- Death rate for hemorrhagic strokes, 2018-20: 9.5 per 100K people
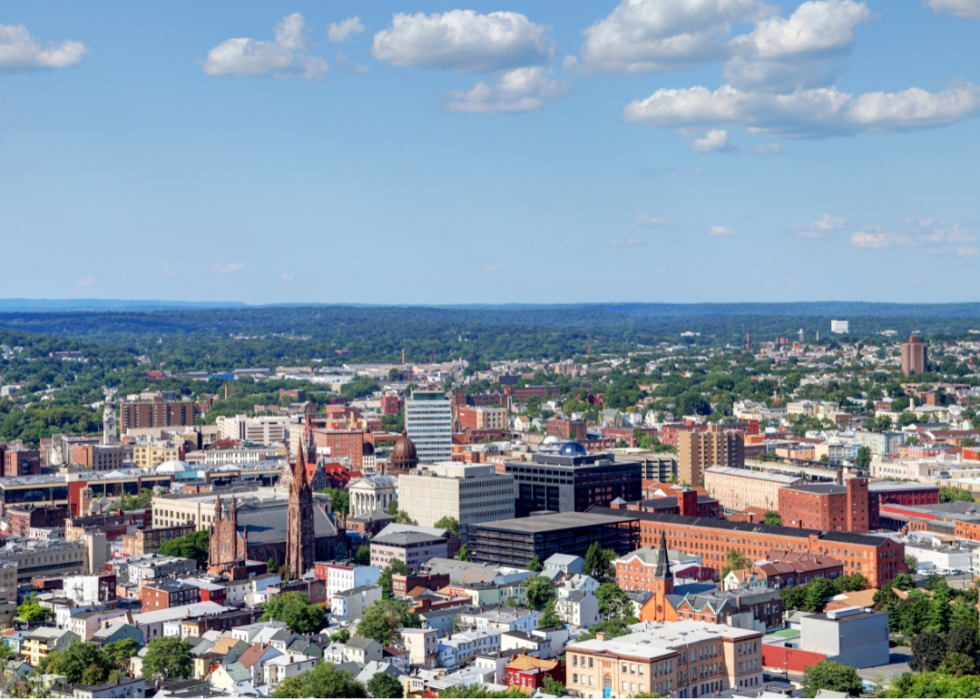
#5. Passaic County
MSPhotographic // Shutterstock
- Age-adjusted rate of all strokes among adults, estimates for 2021: 2.9% (range between 2.6% and 3.3%)
- Death rate for ischemic strokes, 2018-20: 17.0 per 100K people
- Death rate for hemorrhagic strokes, 2018-20: 9.5 per 100K people
- Death rate for ischemic strokes, 2018-20: 17.0 per 100K people
- Death rate for hemorrhagic strokes, 2018-20: 9.5 per 100K people
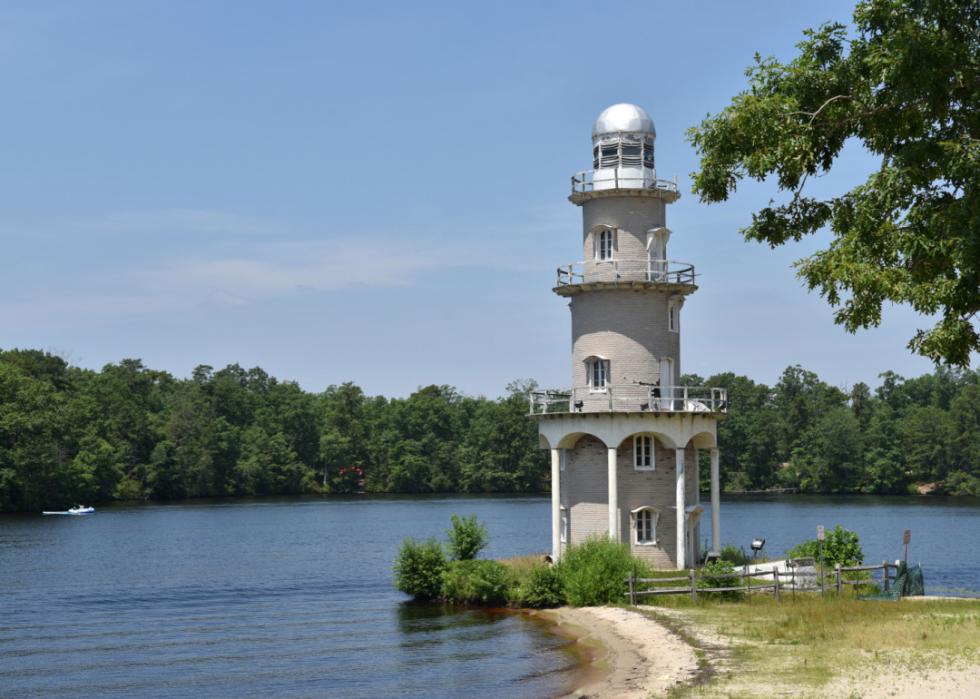
#4. Atlantic County
EQRoy // Shutterstock
- Age-adjusted rate of all strokes among adults, estimates for 2021: 2.9% (range between 2.6% and 3.3%)
- Death rate for ischemic strokes, 2018-20: 20.3 per 100K people
- Death rate for hemorrhagic strokes, 2018-20: 11.2 per 100K people
- Death rate for ischemic strokes, 2018-20: 20.3 per 100K people
- Death rate for hemorrhagic strokes, 2018-20: 11.2 per 100K people
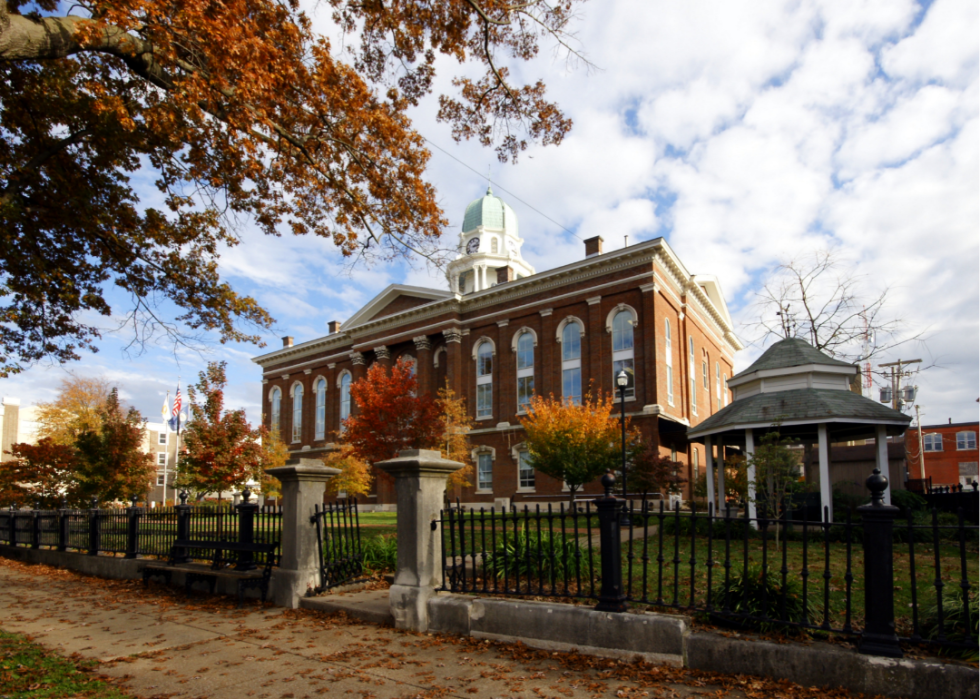
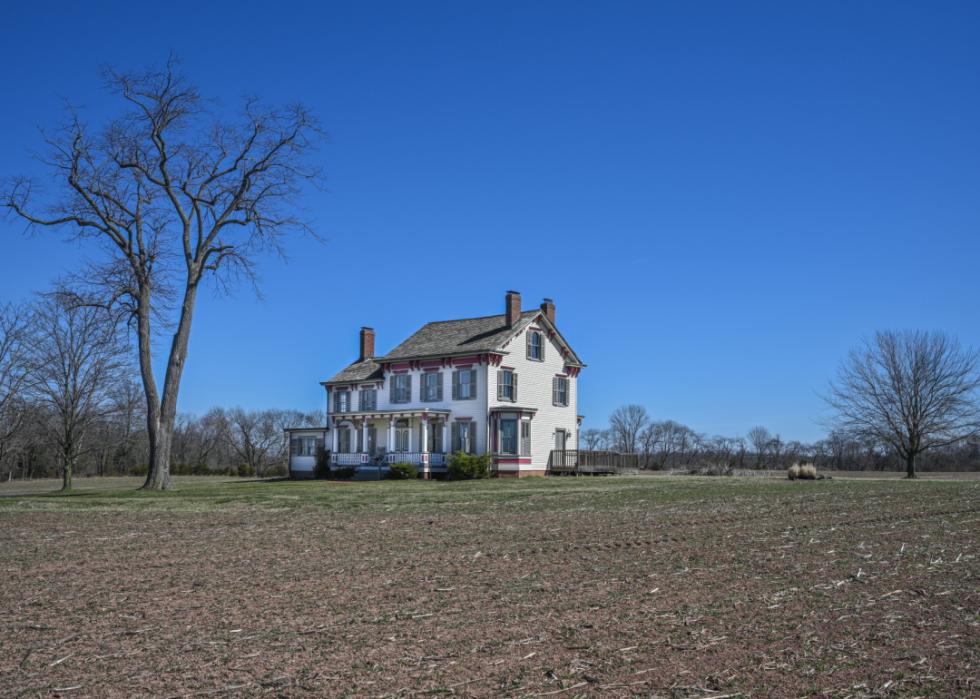
#3. Salem County
Mihai_Andritoiu // Shutterstock
- Age-adjusted rate of all strokes among adults, estimates for 2021: 3.2% (range between 2.8% and 3.5%)
- Death rate for ischemic strokes, 2018-20: 14.2 per 100K people
- Death rate for hemorrhagic strokes, 2018-20: 9.3 per 100K people
- Death rate for ischemic strokes, 2018-20: 14.2 per 100K people
- Death rate for hemorrhagic strokes, 2018-20: 9.3 per 100K people
You may also like: Most popular boy names in the 60s in New Jersey
#2. Essex County
Khairil Azhar Junos // Shutterstock
- Age-adjusted rate of all strokes among adults, estimates for 2021: 3.4% (range between 3.0% and 3.8%)
- Death rate for ischemic strokes, 2018-20: 20.2 per 100K people
- Death rate for hemorrhagic strokes, 2018-20: 12.0 per 100K people
- Death rate for ischemic strokes, 2018-20: 20.2 per 100K people
- Death rate for hemorrhagic strokes, 2018-20: 12.0 per 100K people
This story features data reporting and writing by Emma Rubin and is part of a series utilizing data automation across 49 states.
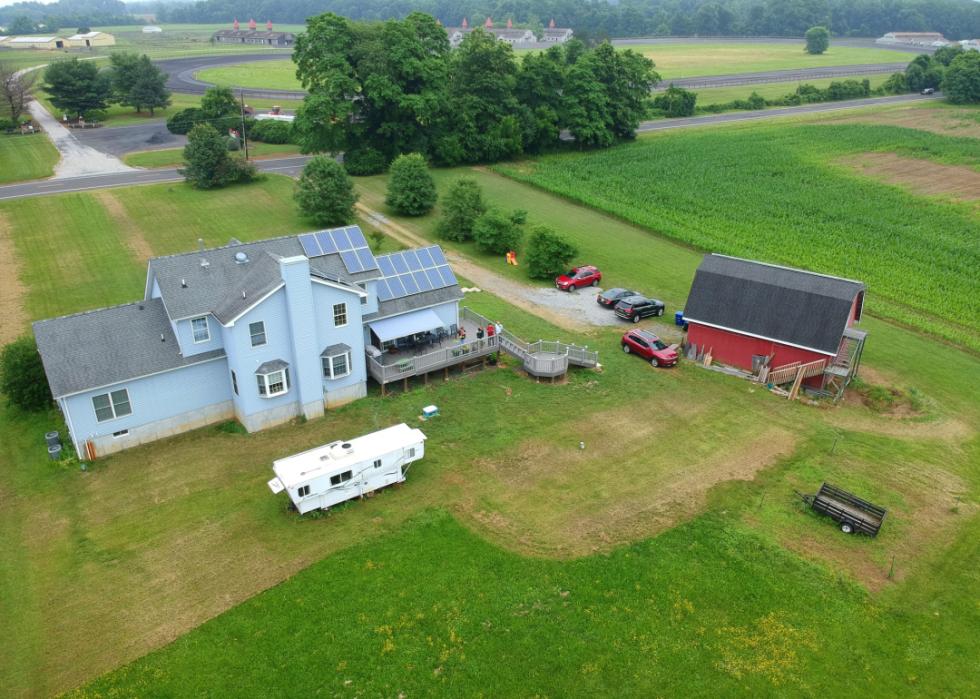
#1. Cumberland County

Canva