Cities with the fastest-growing home prices in the Ocean City metro area
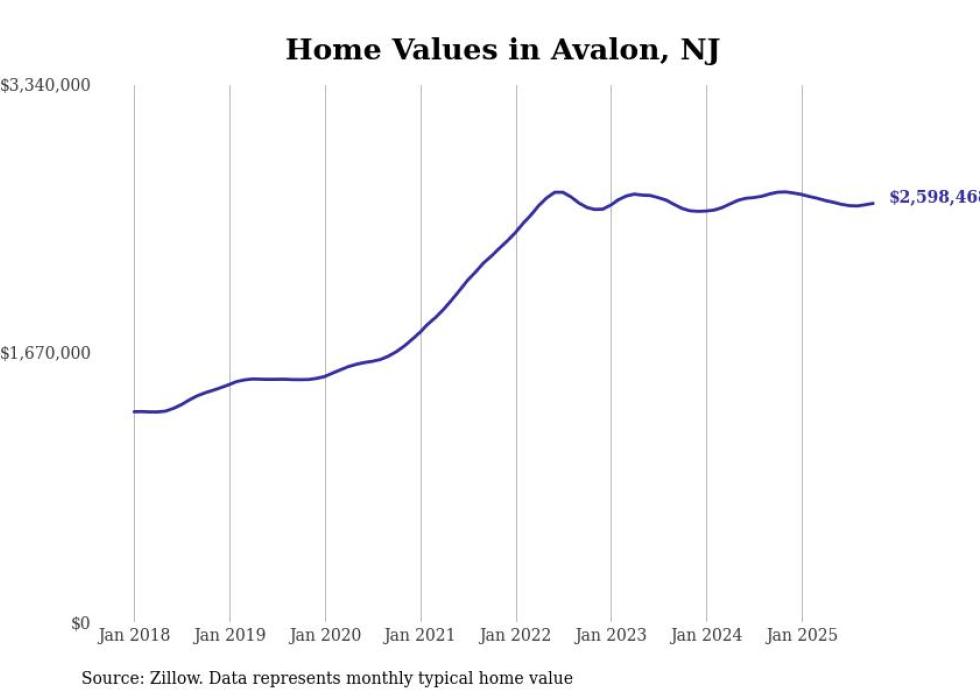
- 1-year price change: -$69,145 (-2.6%)
- 5-year price change: +$920,687 (+54.9%)
- Typical home value: $2,598,468 (#1 most expensive city in metro)
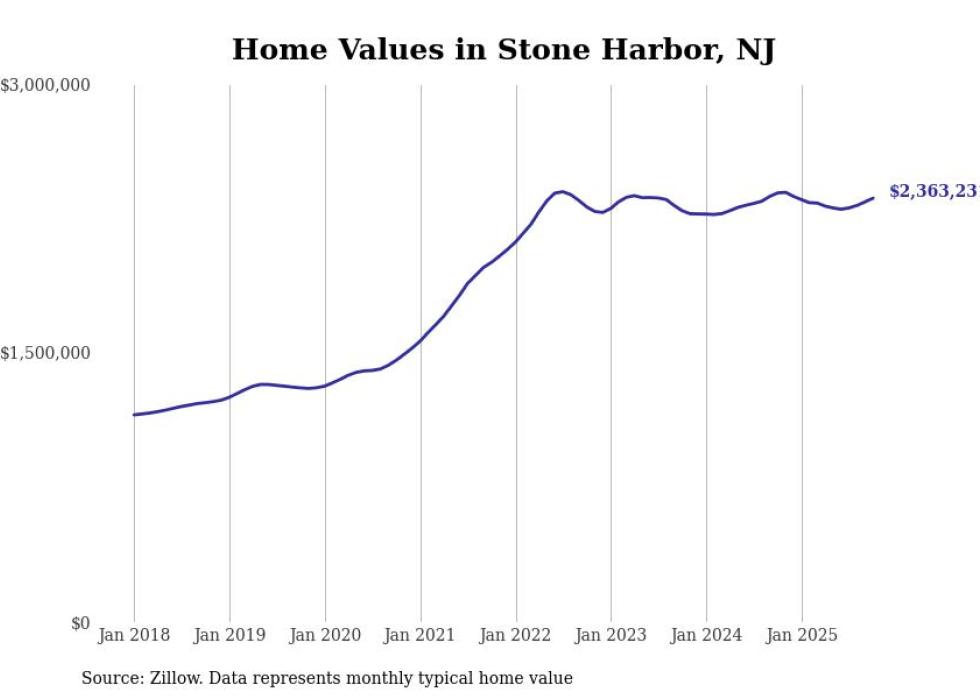
- 1-year price change: -$29,042 (-1.2%)
- 5-year price change: +$903,419 (+61.9%)
- Typical home value: $2,363,231 (#2 most expensive city in metro)
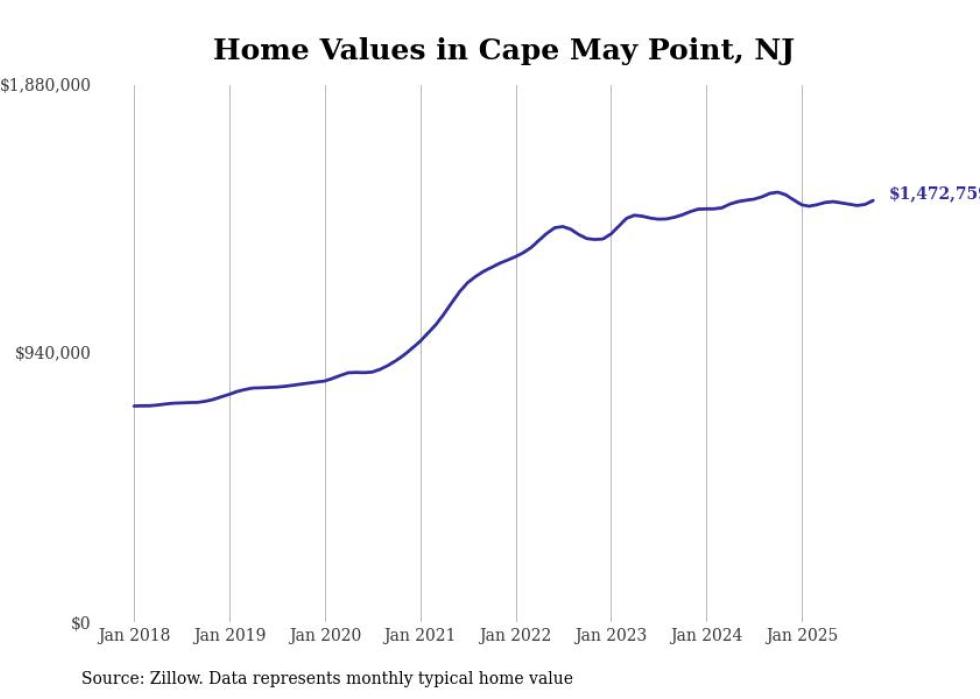
- 1-year price change: -$28,781 (-1.9%)
- 5-year price change: +$558,746 (+61.1%)
- Typical home value: $1,472,759 (#4 most expensive city in metro)
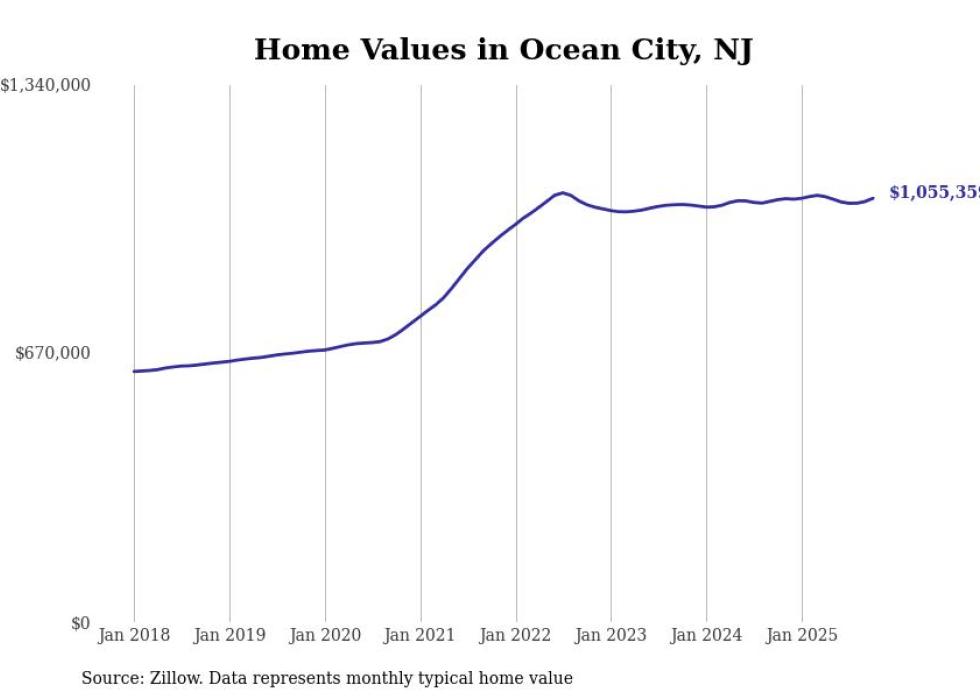
- 1-year price change: +$3,684 (+0.4%)
- 5-year price change: +$338,853 (+47.3%)
- Typical home value: $1,055,359 (#6 most expensive city in metro)
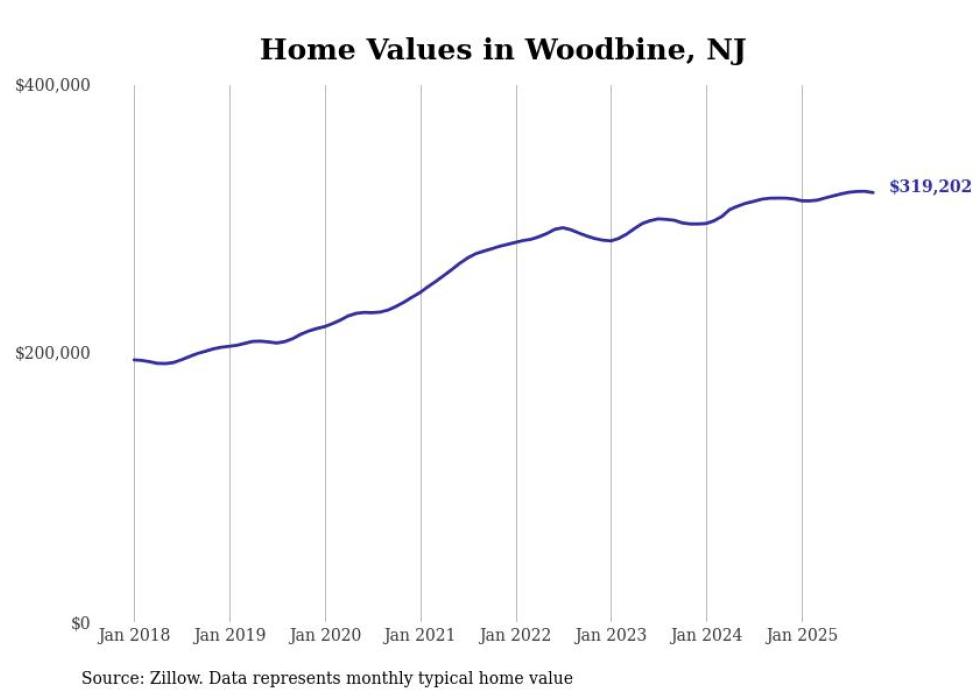
- 1-year price change: +$4,094 (+1.3%)
- 5-year price change: +$84,512 (+36.0%)
- Typical home value: $319,202 (#14 most expensive city in metro)
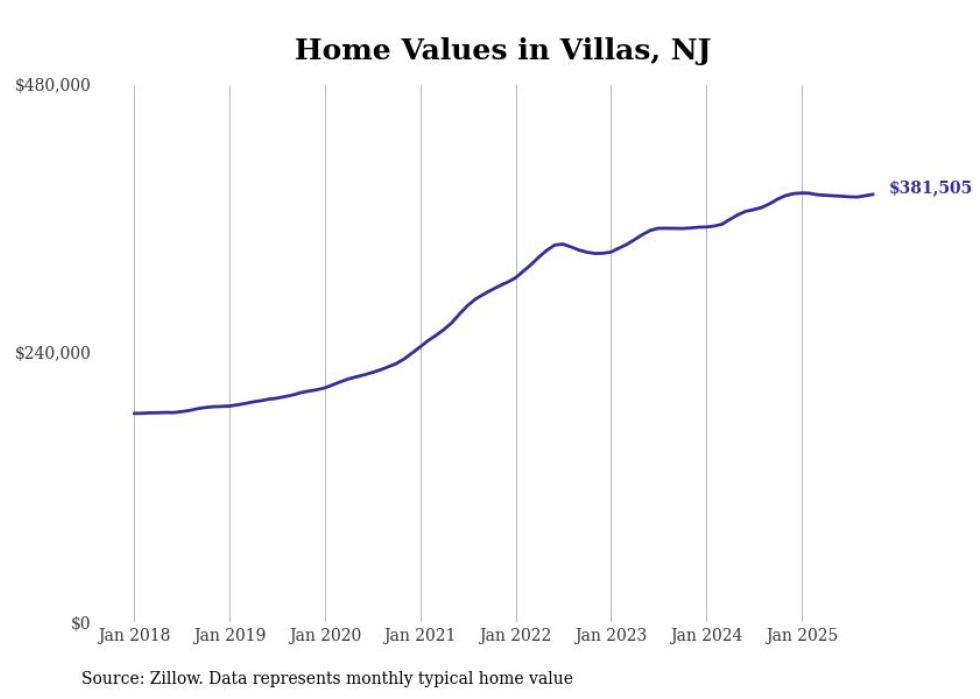
- 1-year price change: +$4,218 (+1.1%)
- 5-year price change: +$150,961 (+65.5%)
- Typical home value: $381,505 (#13 most expensive city in metro)
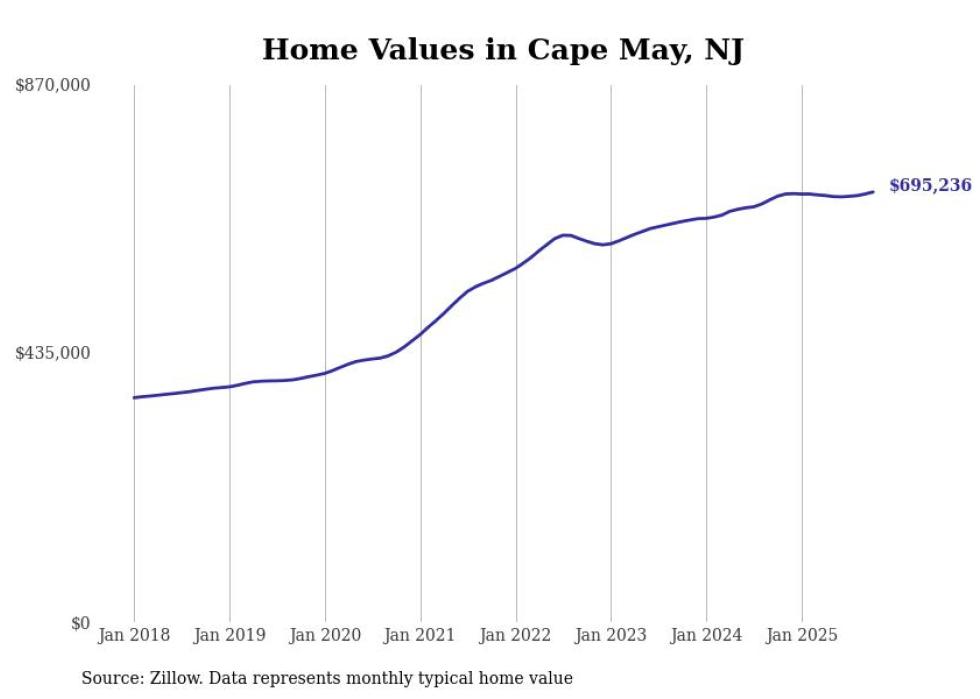
- 1-year price change: +$6,592 (+1.0%)
- 5-year price change: +$258,811 (+59.3%)
- Typical home value: $695,236 (#7 most expensive city in metro)
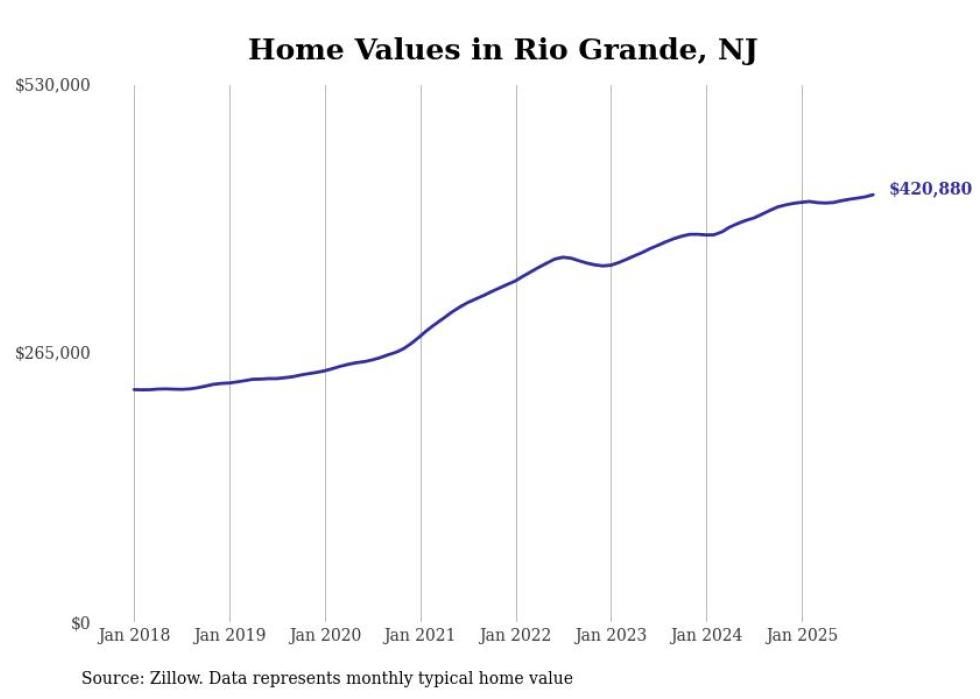
- 1-year price change: +$12,048 (+2.9%)
- 5-year price change: +$155,070 (+58.3%)
- Typical home value: $420,880 (#12 most expensive city in metro)
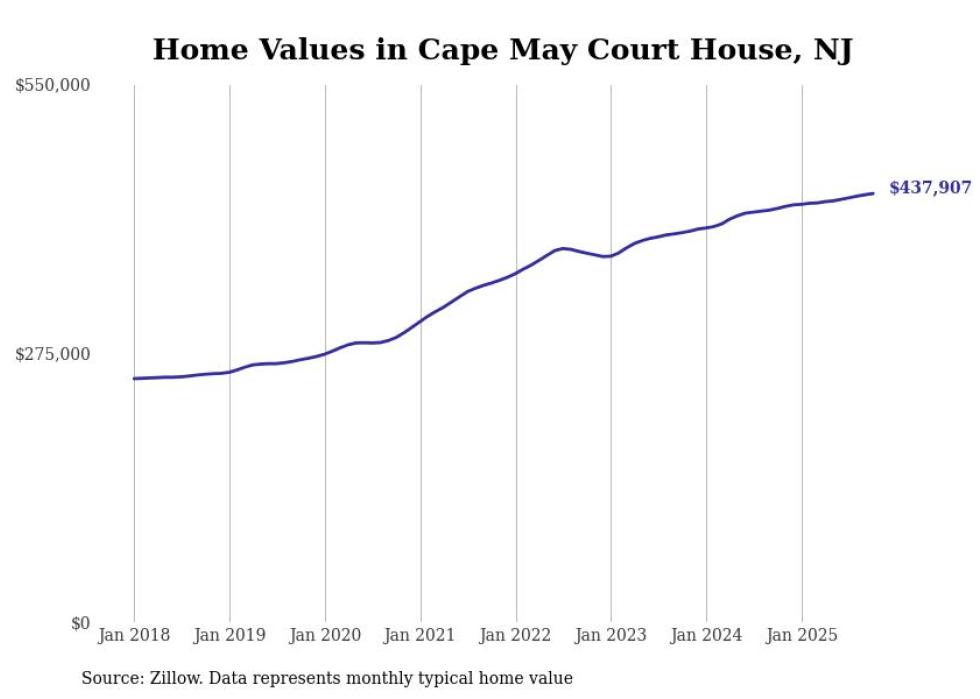
- 1-year price change: +$15,089 (+3.6%)
- 5-year price change: +$146,972 (+50.5%)
- Typical home value: $437,907 (#11 most expensive city in metro)
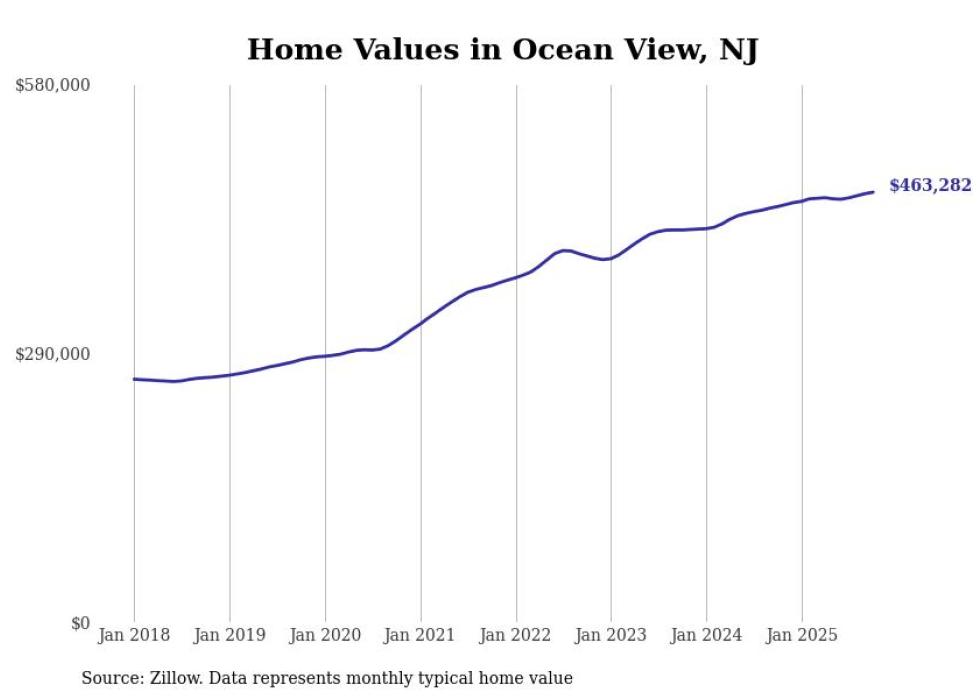
- 1-year price change: +$15,437 (+3.4%)
- 5-year price change: +$159,920 (+52.7%)
- Typical home value: $463,282 (#10 most expensive city in metro)
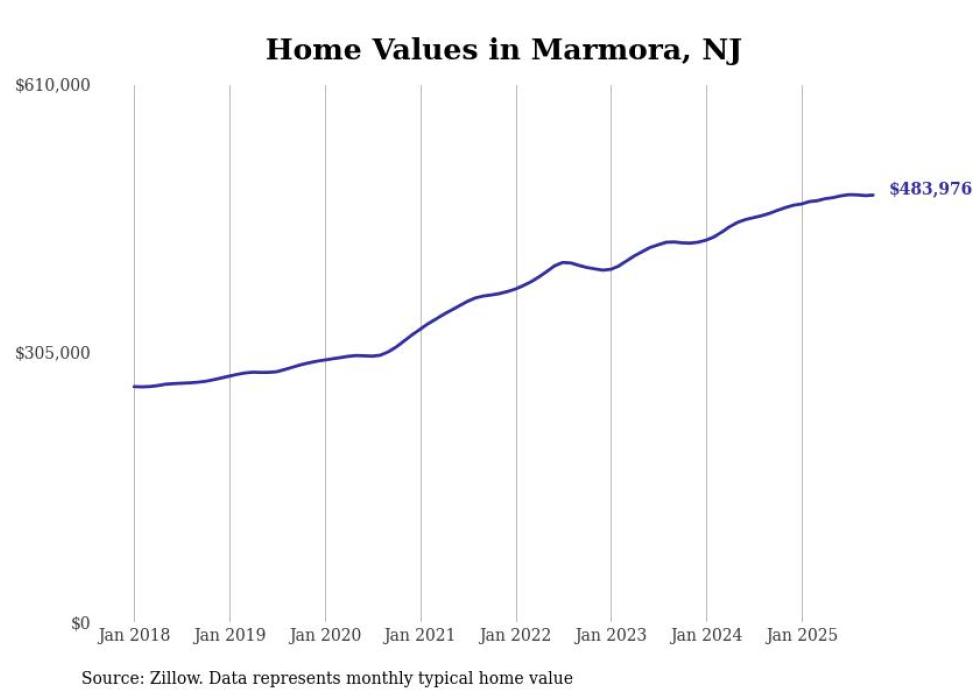
- 1-year price change: +$17,151 (+3.7%)
- 5-year price change: +$172,125 (+55.2%)
- Typical home value: $483,976 (#9 most expensive city in metro)

- 1-year price change: +$26,839 (+1.9%)
- 5-year price change: +$523,272 (+57.6%)
- Typical home value: $1,432,256 (#5 most expensive city in metro)
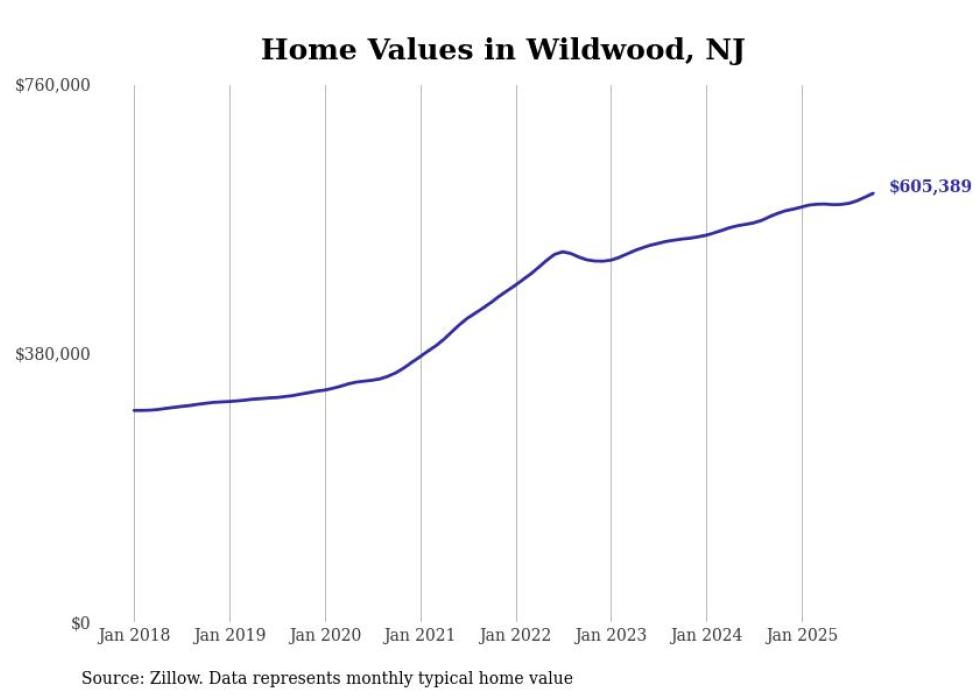
- 1-year price change: +$28,164 (+4.9%)
- 5-year price change: +$253,030 (+71.8%)
- Typical home value: $605,389 (#8 most expensive city in metro)
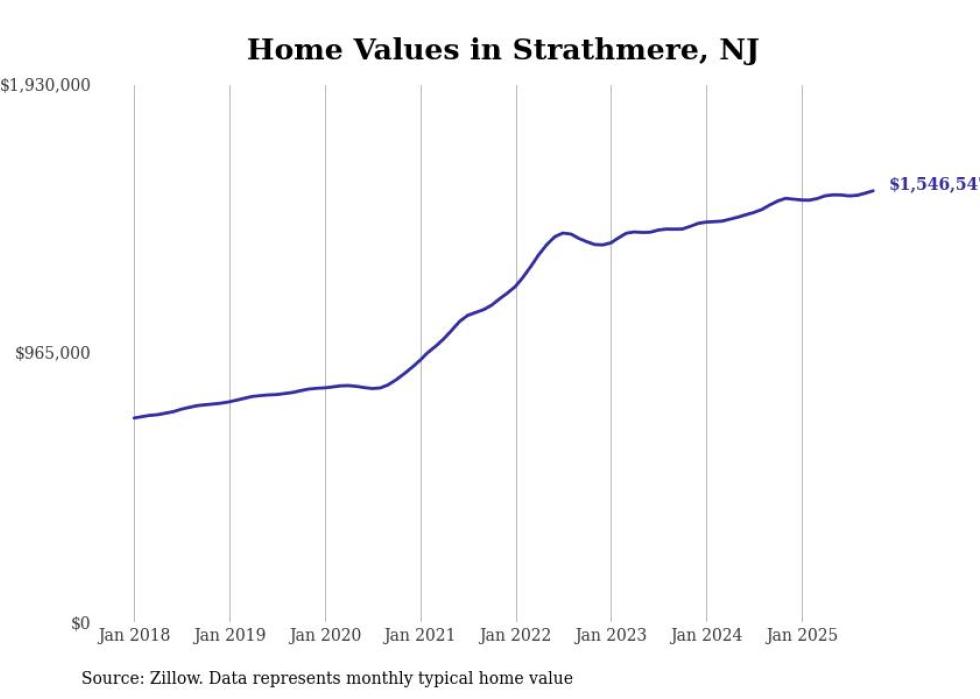
- 1-year price change: +$36,483 (+2.4%)
- 5-year price change: +$677,235 (+77.9%)
- Typical home value: $1,546,547 (#3 most expensive city in metro)