Counties with the most homes selling under list price in New York

- Average price difference: 0.51% below list
-- Median list price: $498,000
-- Median sale price: $400,000
- Total homes sold: 166
-- Share that sold above list: 33.7%

- Average price difference: 0.64% below list
-- Median list price: $799,000
-- Median sale price: $703,500
- Total homes sold: 702
-- Share that sold above list: 39.2%

- Average price difference: 0.86% below list
-- Median list price: $444,499
-- Median sale price: $395,000
- Total homes sold: 195
-- Share that sold above list: 30.8%

- Average price difference: 0.91% below list
-- Median list price: $710,000
-- Median sale price: $625,000
- Total homes sold: 154
-- Share that sold above list: 42.9%

- Average price difference: 0.92% below list
-- Median list price: $249,900
-- Median sale price: $250,000
- Total homes sold: 117
-- Share that sold above list: 43.6%

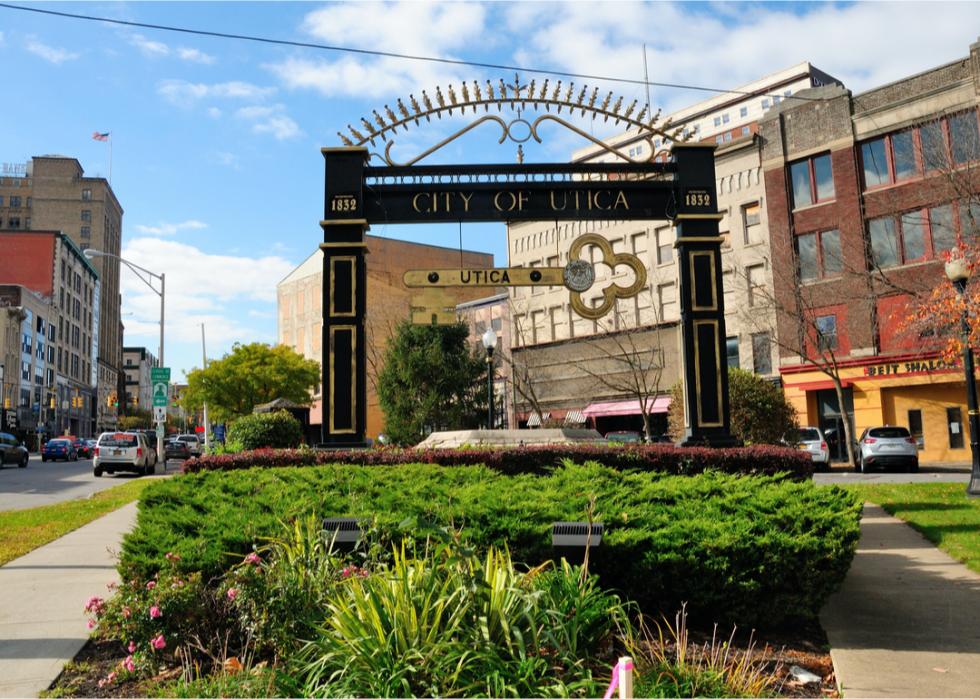
- Average price difference: 1.66% below list
-- Median list price: $169,900
-- Median sale price: $167,000
- Total homes sold: 123
-- Share that sold above list: 38.2%

- Average price difference: 1.72% below list
-- Median list price: $475,000
-- Median sale price: $402,500
- Total homes sold: 130
-- Share that sold above list: 26.2%
- Average price difference: 2.51% below list
-- Median list price: $219,900
-- Median sale price: $173,900
- Total homes sold: 107
-- Share that sold above list: 28.0%
This story features data reporting and writing by Elena Cox and is part of a series utilizing data automation across 28 states.