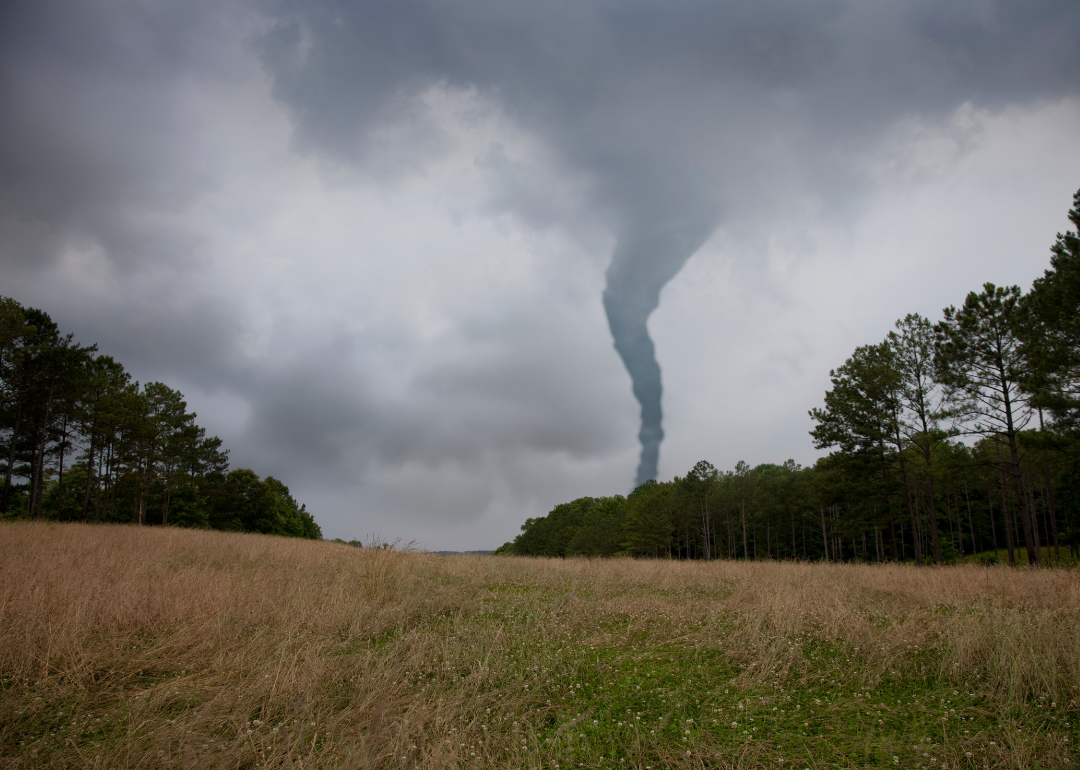
Counties with the most tornadoes in New York
Stacker
Canva
- Tornadoes since 2000: 5 (0.38 per 100 square miles)
- #2,005 nationally
- Tornadoes this year, as of May 31: 0
- #2,005 nationally
- Tornadoes this year, as of May 31: 0
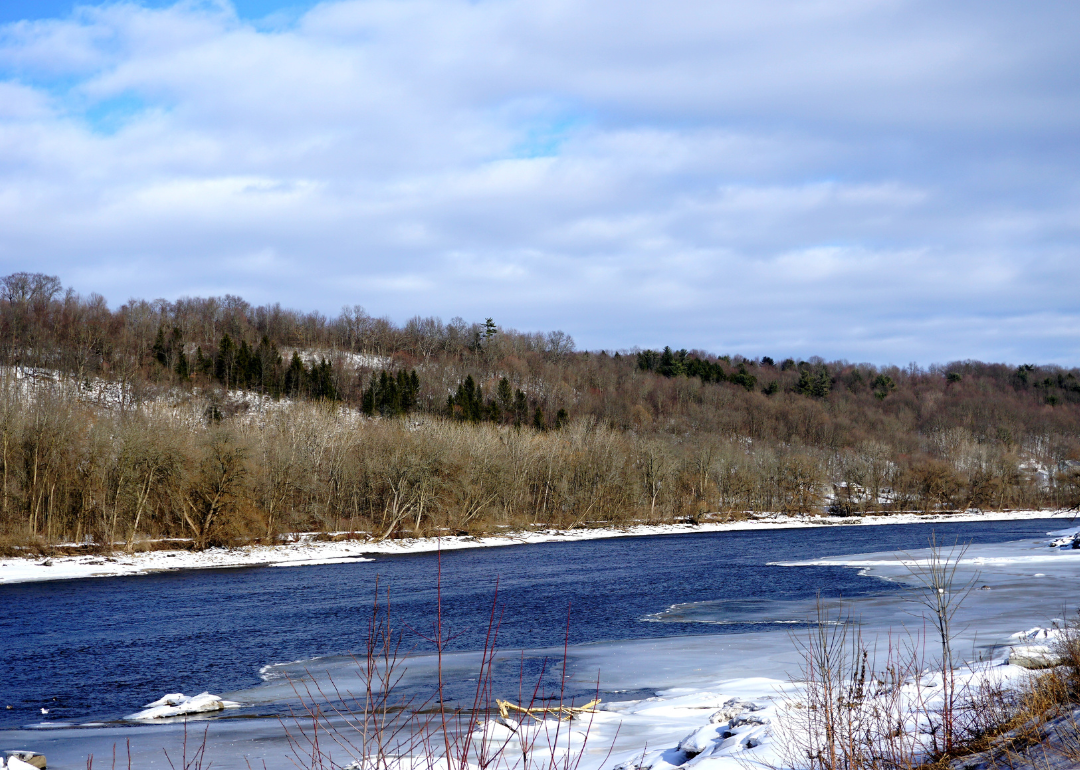
#15. Cattaraugus County
Joe Trentacosti // Shutterstock
- Tornadoes since 2000: 7 (0.50 per 100 square miles)
- #1,974 nationally
- Tornadoes this year, as of May 31: 0
- #1,974 nationally
- Tornadoes this year, as of May 31: 0
#14. Steuben County

Canva
- Tornadoes since 2000: 5 (0.62 per 100 square miles)
- #1,939 nationally
- Tornadoes this year, as of May 31: 0
- #1,939 nationally
- Tornadoes this year, as of May 31: 0
#13. Orange County

PhotoItaliaStudio // Shutterstock
- Tornadoes since 2000: 5 (0.62 per 100 square miles)
- #1,938 nationally
- Tornadoes this year, as of May 31: 0
- #1,938 nationally
- Tornadoes this year, as of May 31: 0
#12. Saratoga County

Canva
- Tornadoes since 2000: 7 (0.67 per 100 square miles)
- #1,926 nationally
- Tornadoes this year, as of May 31: 0
- #1,926 nationally
- Tornadoes this year, as of May 31: 0
#11. Erie County
Paige Petrie // Shutterstock
- Tornadoes since 2000: 7 (0.68 per 100 square miles)
- #1,923 nationally
- Tornadoes this year, as of May 31: 0
- #1,923 nationally
- Tornadoes this year, as of May 31: 0
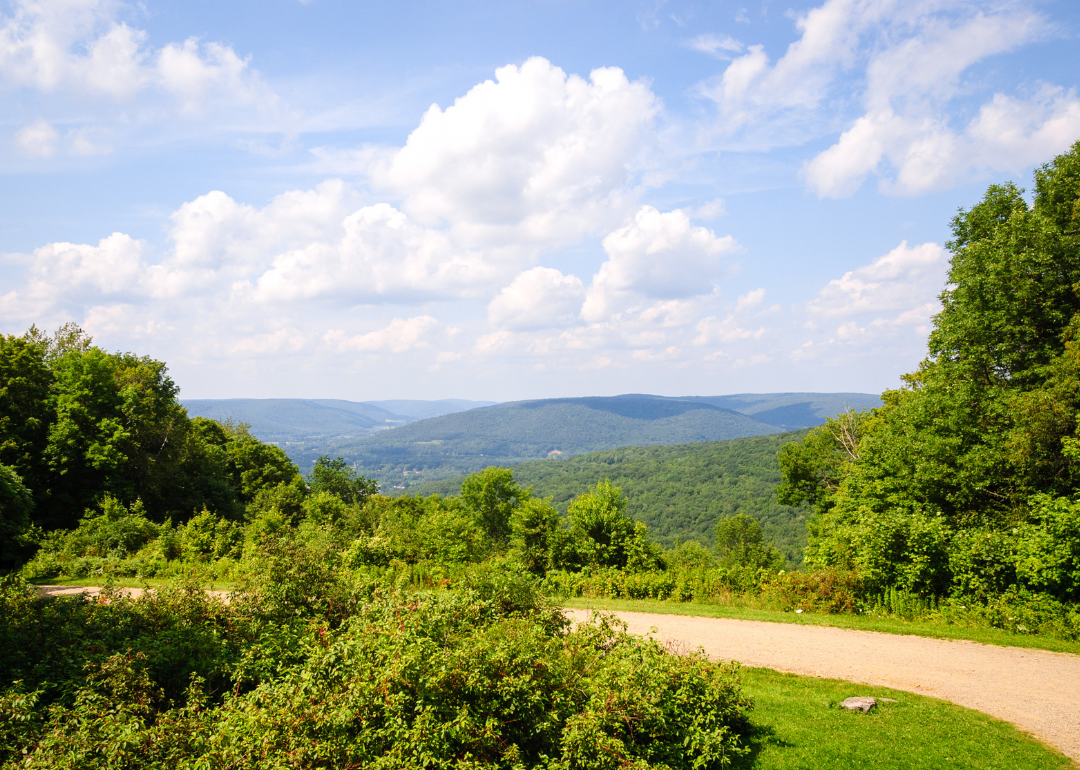
#10. Allegany County

Canva
- Tornadoes since 2000: 6 (0.85 per 100 square miles)
- #1,849 nationally
- Tornadoes this year, as of May 31: 0
- #1,849 nationally
- Tornadoes this year, as of May 31: 0
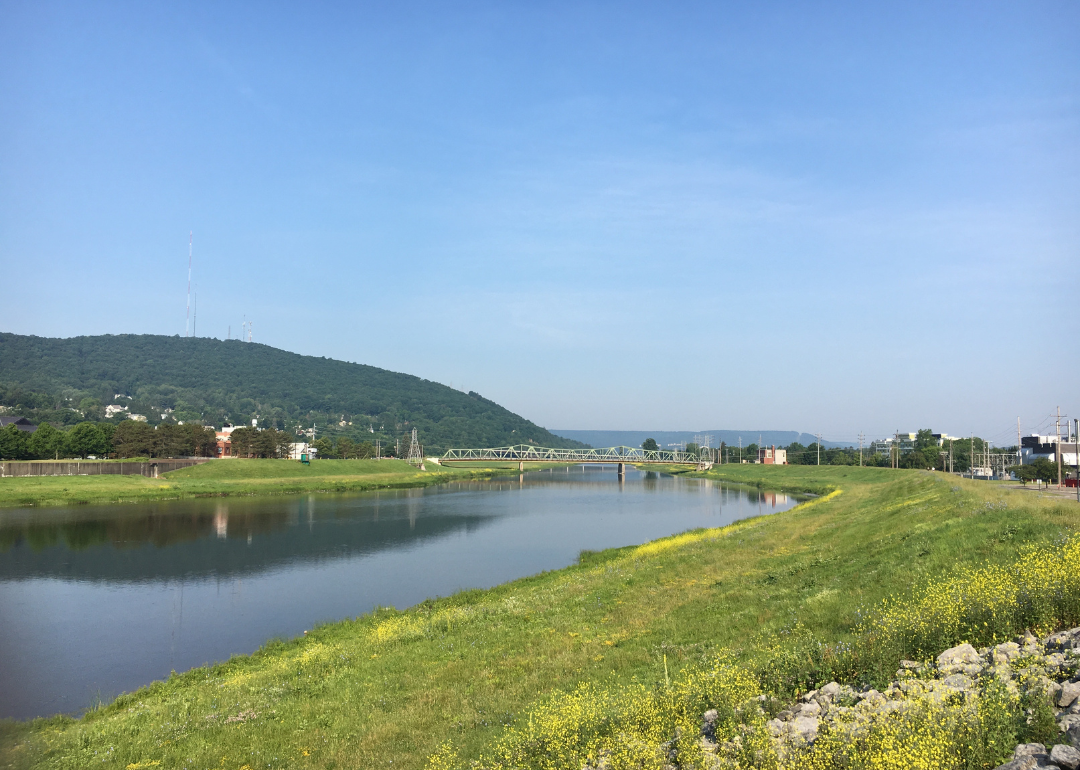
#9. Broome County

Sean McDonald // Shutterstock
- Tornadoes since 2000: 8 (0.90 per 100 square miles)
- #1,829 nationally
- Tornadoes this year, as of May 31: 0
- #1,829 nationally
- Tornadoes this year, as of May 31: 0
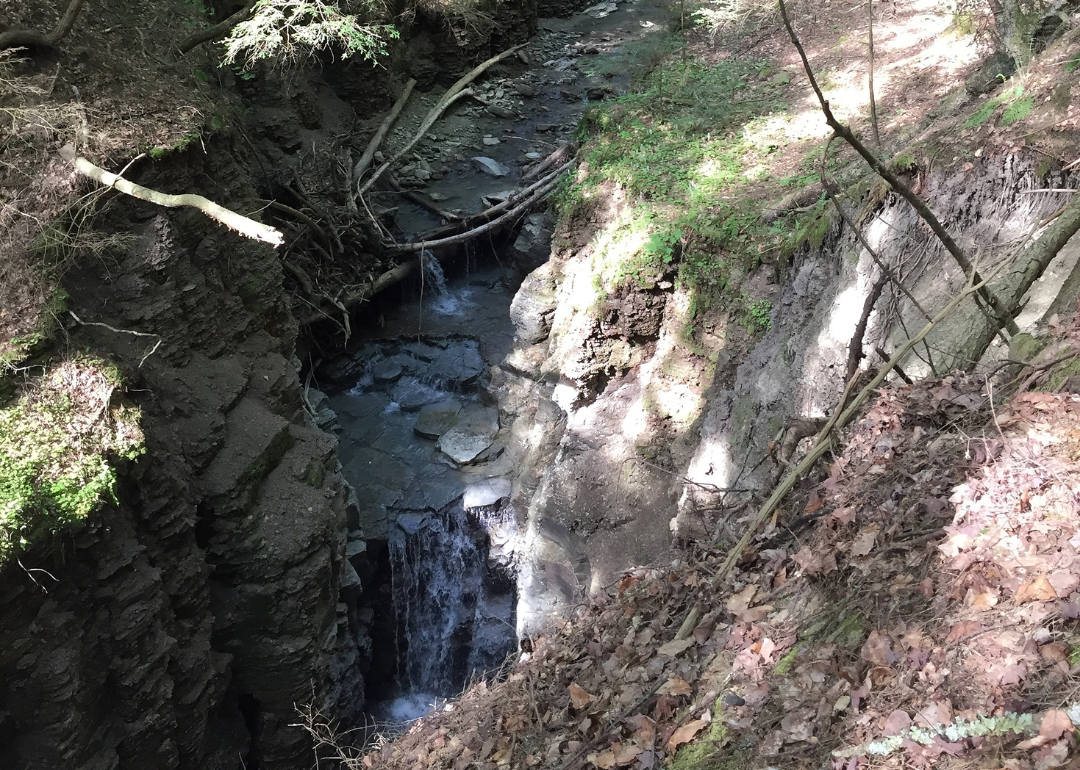
#8. Chenango County
Felix Lipov // Shutterstock
- Tornadoes since 2000: 6 (0.93 per 100 square miles)
- #1,810 nationally
- Tornadoes this year, as of May 31: 0
- #1,810 nationally
- Tornadoes this year, as of May 31: 0
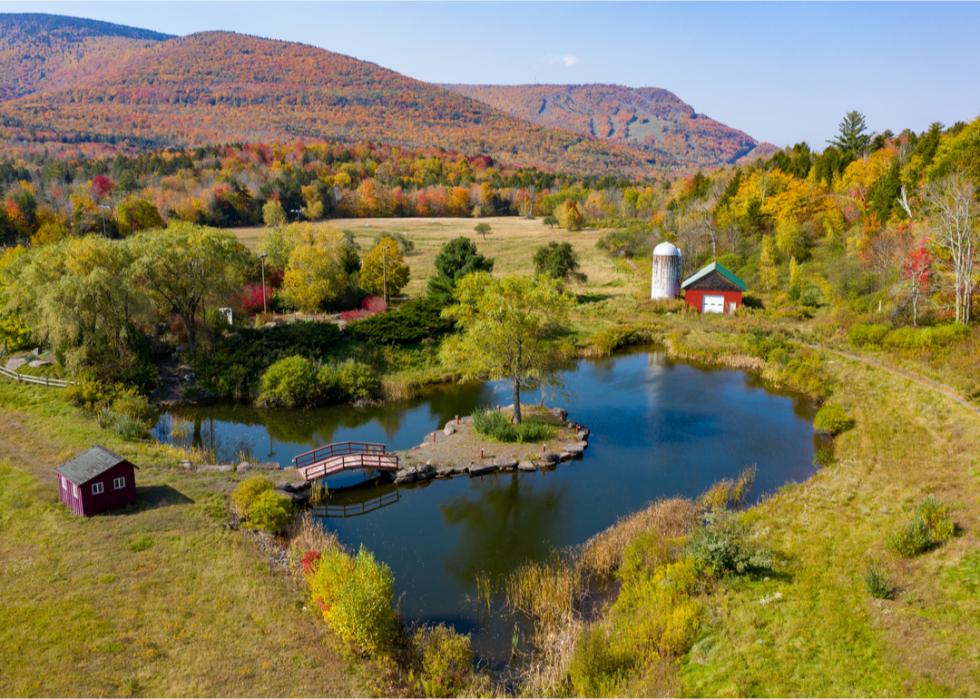
#7. Greene County

Nina Alizada // Shutterstock
- Tornadoes since 2000: 12 (0.99 per 100 square miles)
- #1,783 nationally
- Tornadoes this year, as of May 31: 0
- #1,783 nationally
- Tornadoes this year, as of May 31: 0
#6. Oneida County

Canva
- Tornadoes since 2000: 7 (1.10 per 100 square miles)
- #1,715 nationally
- Tornadoes this year, as of May 31: 0
- #1,715 nationally
- Tornadoes this year, as of May 31: 0
#5. Columbia County

Canva
- Tornadoes since 2000: 5 (1.23 per 100 square miles)
- #1,617 nationally
- Tornadoes this year, as of May 31: 0
- #1,617 nationally
- Tornadoes this year, as of May 31: 0
#4. Chemung County

Colin D. Young // Shutterstock
- Tornadoes since 2000: 10 (1.26 per 100 square miles)
- #1,583 nationally
- Tornadoes this year, as of May 31: 0
- #1,583 nationally
- Tornadoes this year, as of May 31: 0
#3. Dutchess County

Canva
- Tornadoes since 2000: 17 (1.86 per 100 square miles)
- #1,154 nationally
- Tornadoes this year, as of May 31: 0
- #1,154 nationally
- Tornadoes this year, as of May 31: 0
#2. Suffolk County
Canva
- Tornadoes since 2000: 8 (1.98 per 100 square miles)
- #1,072 nationally
- Tornadoes this year, as of May 31: 0
- #1,072 nationally
- Tornadoes this year, as of May 31: 0
#1. Montgomery County
Canva