Counties with the most homes selling under list price in North Carolina

- Average price difference: 0.21% below list
-- Median list price: $449,000
-- Median sale price: $409,000
- Total homes sold: 356
-- Share that sold above list: 35.7%

- Average price difference: 0.24% below list
-- Median list price: $488,250
-- Median sale price: $476,000
- Total homes sold: 1,346
-- Share that sold above list: 29.1%

- Average price difference: 0.39% below list
-- Median list price: $448,000
-- Median sale price: $425,250
- Total homes sold: 1,396
-- Share that sold above list: 30.2%
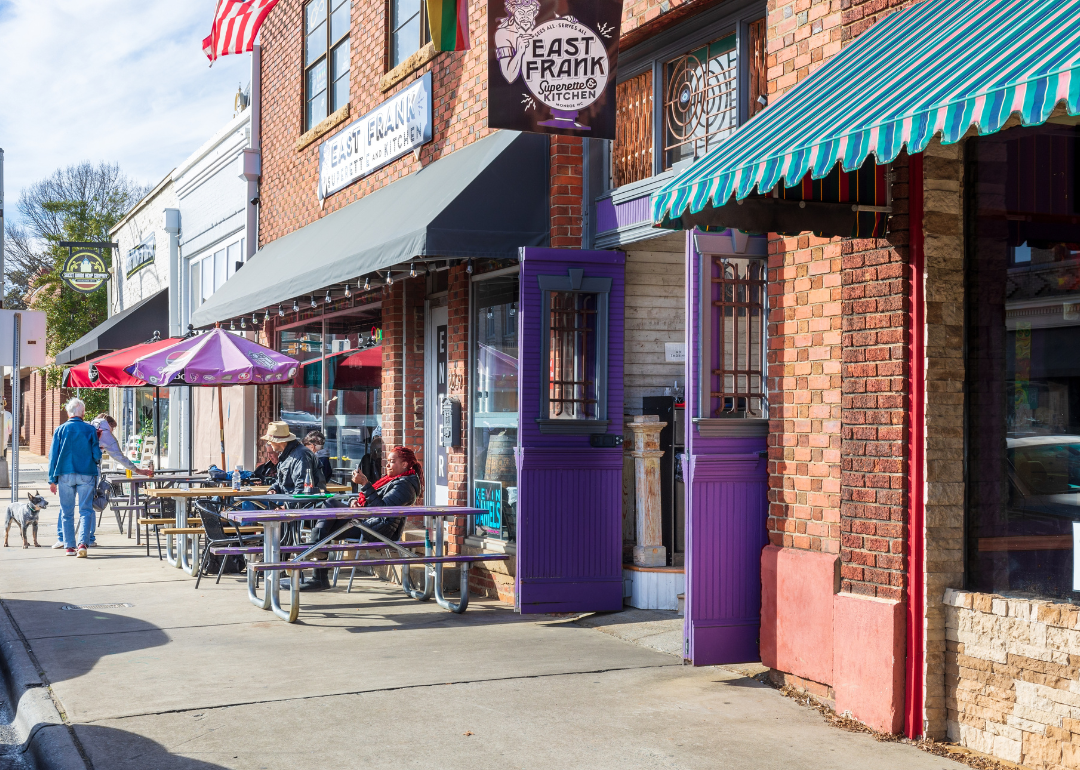
- Average price difference: 0.47% below list
-- Median list price: $469,900
-- Median sale price: $434,759
- Total homes sold: 286
-- Share that sold above list: 27.6%
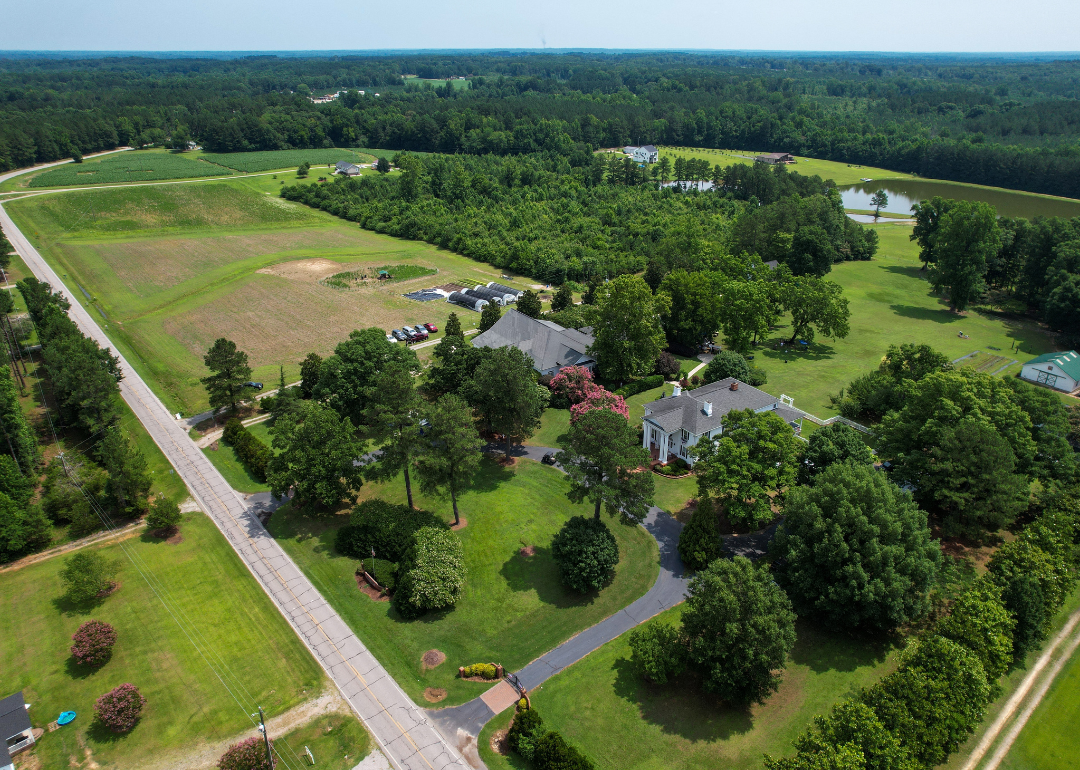
- Average price difference: 0.60% below list
-- Median list price: $401,764
-- Median sale price: $380,000
- Total homes sold: 119
-- Share that sold above list: 22.7%

- Average price difference: 0.61% below list
-- Median list price: $268,990
-- Median sale price: $264,815
- Total homes sold: 186
-- Share that sold above list: 26.9%

- Average price difference: 0.69% below list
-- Median list price: $462,450
-- Median sale price: $399,000
- Total homes sold: 141
-- Share that sold above list: 22.0%
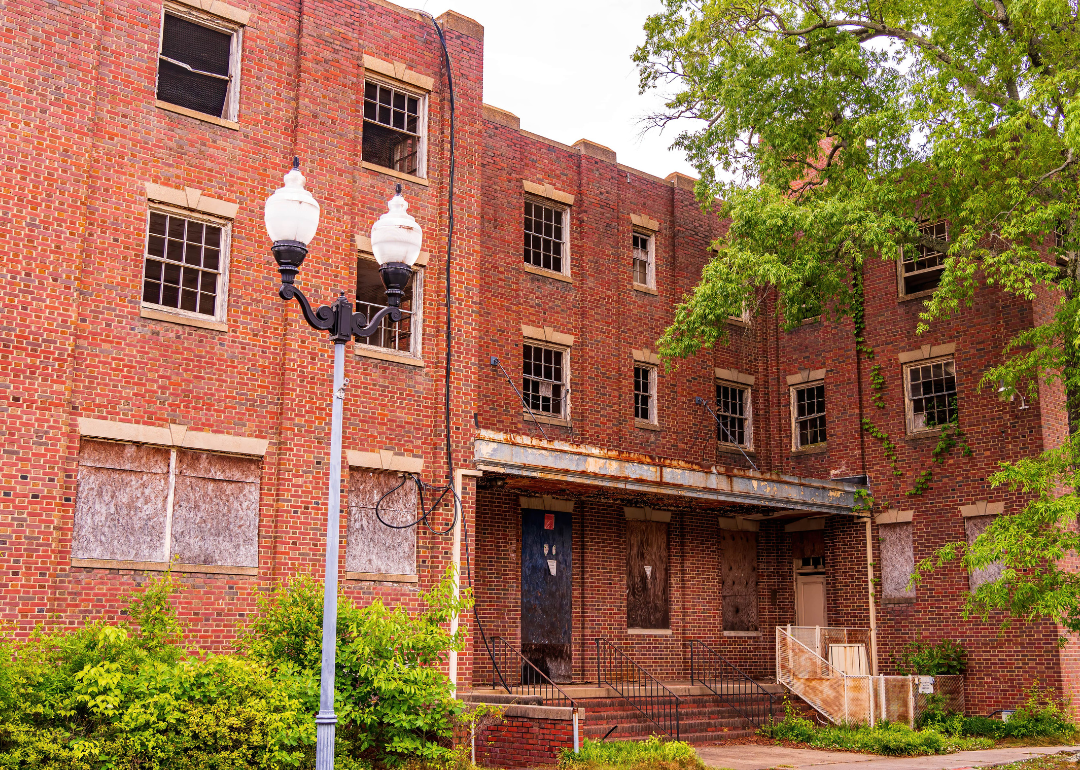
- Average price difference: 0.96% below list
-- Median list price: $368,999
-- Median sale price: $360,000
- Total homes sold: 347
-- Share that sold above list: 16.7%
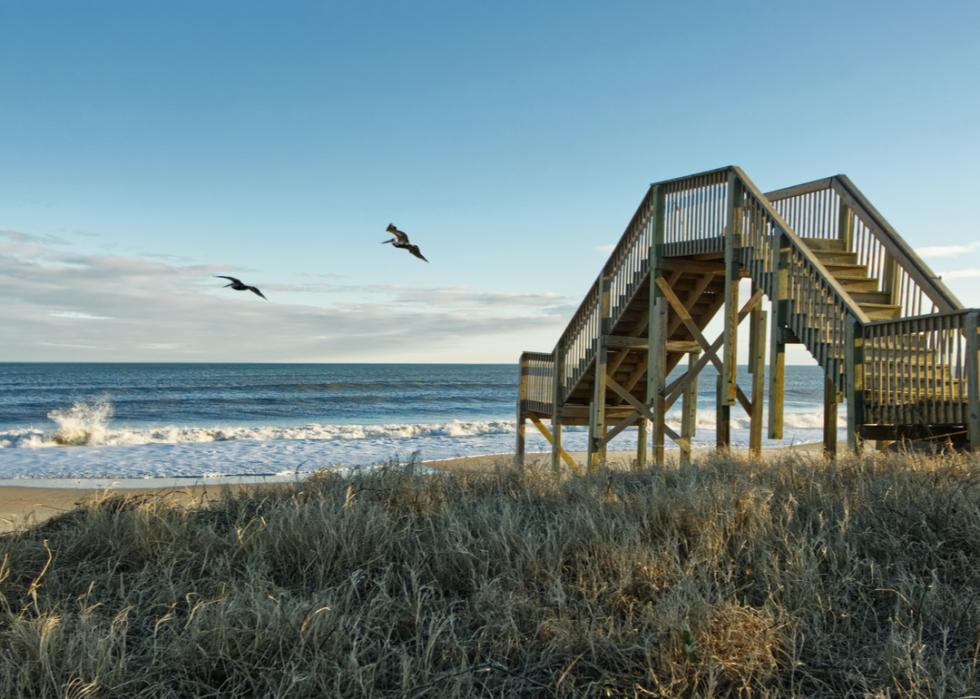
- Average price difference: 0.97% below list
-- Median list price: $311,000
-- Median sale price: $280,000
- Total homes sold: 382
-- Share that sold above list: 21.2%
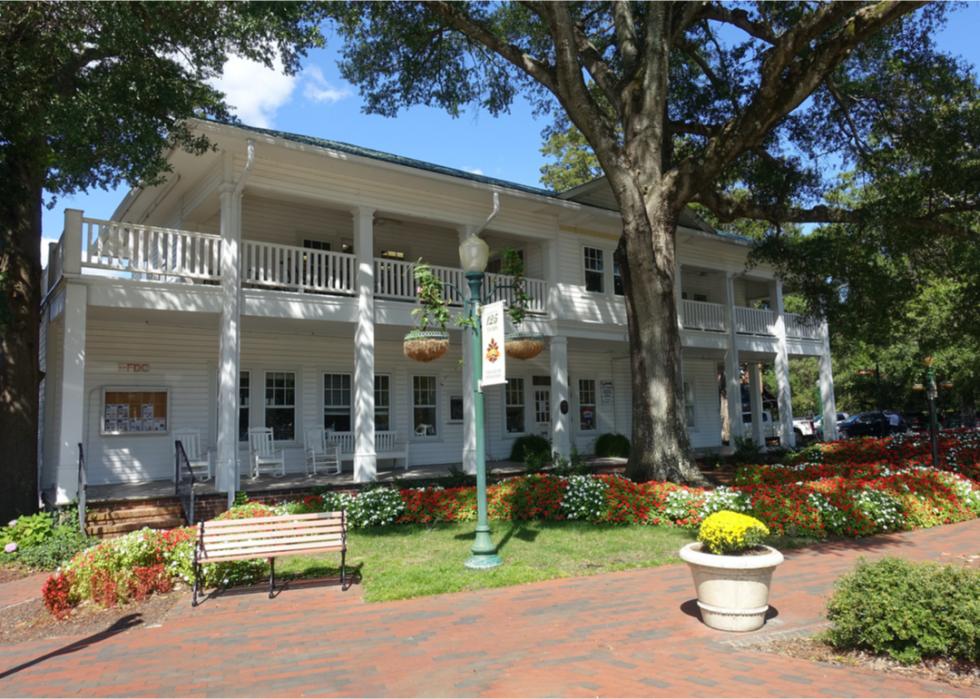
- Average price difference: 0.98% below list
-- Median list price: $439,900
-- Median sale price: $455,000
- Total homes sold: 195
-- Share that sold above list: 22.1%

- Average price difference: 1.03% below list
-- Median list price: $299,900
-- Median sale price: $306,000
- Total homes sold: 364
-- Share that sold above list: 28.8%
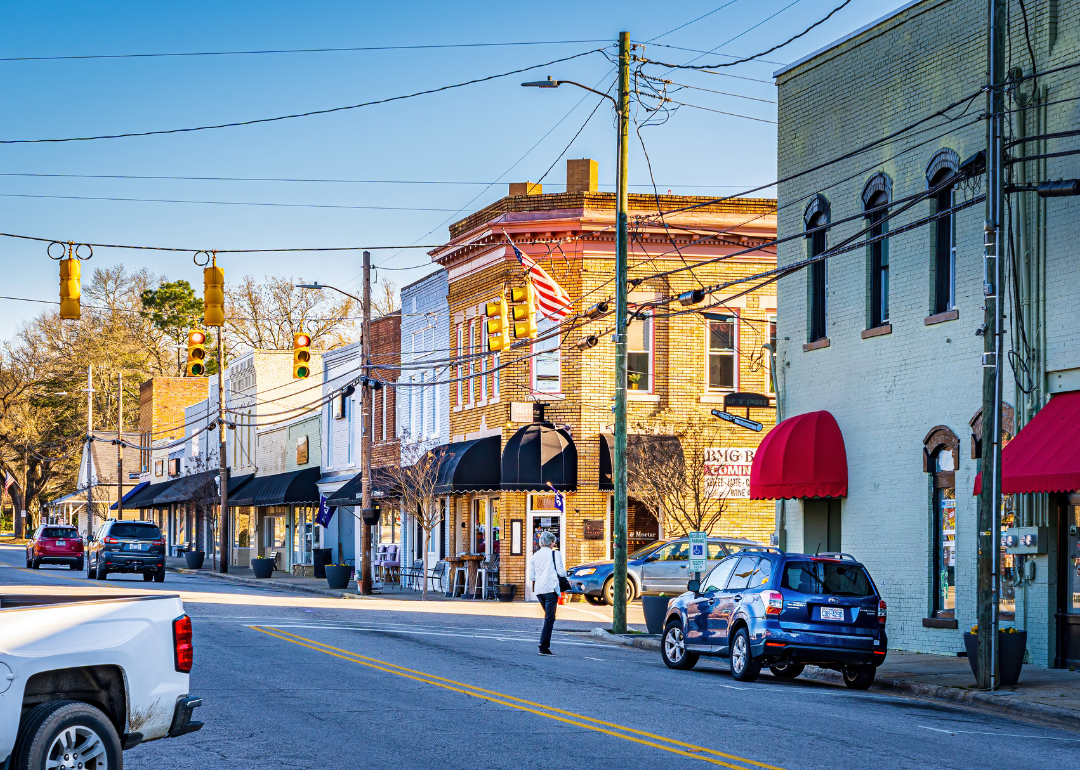
- Average price difference: 1.14% below list
-- Median list price: $334,995
-- Median sale price: $325,000
- Total homes sold: 241
-- Share that sold above list: 22.0%

- Average price difference: 1.22% below list
-- Median list price: $325,500
-- Median sale price: $329,000
- Total homes sold: 212
-- Share that sold above list: 18.9%
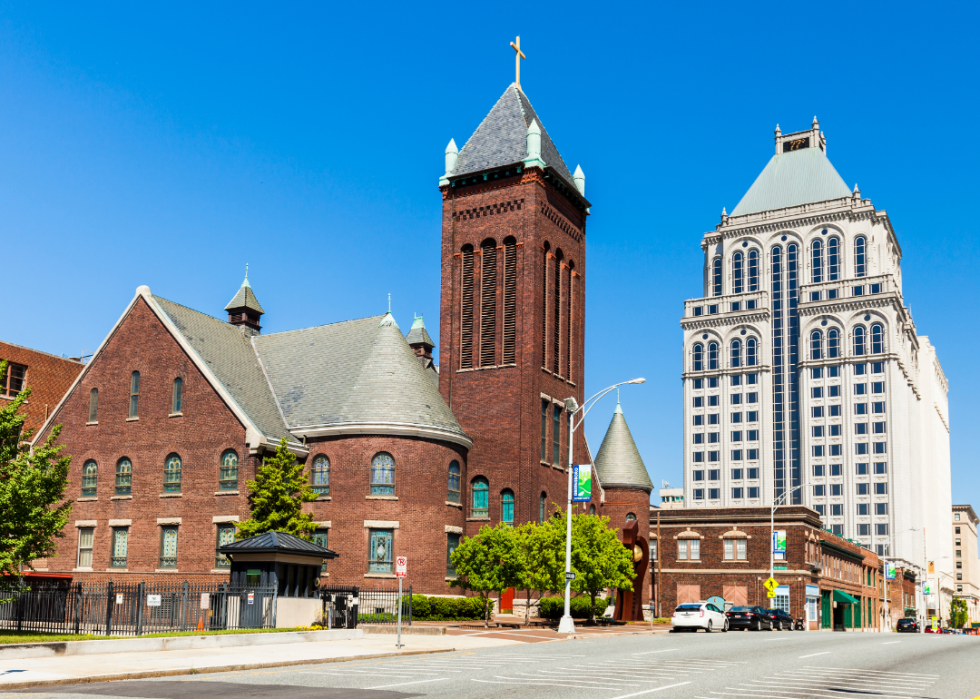
- Average price difference: 1.22% below list
-- Median list price: $323,900
-- Median sale price: $297,900
- Total homes sold: 558
-- Share that sold above list: 28.1%
- Average price difference: 1.45% below list
-- Median list price: $315,000
-- Median sale price: $300,000
- Total homes sold: 149
-- Share that sold above list: 22.1%

- Average price difference: 1.48% below list
-- Median list price: $375,000
-- Median sale price: $385,000
- Total homes sold: 253
-- Share that sold above list: 24.9%

- Average price difference: 1.55% below list
-- Median list price: $469,535
-- Median sale price: $425,000
- Total homes sold: 139
-- Share that sold above list: 20.1%
- Average price difference: 1.67% below list
-- Median list price: $239,900
-- Median sale price: $240,000
- Total homes sold: 417
-- Share that sold above list: 28.5%

- Average price difference: 1.84% below list
-- Median list price: $550,000
-- Median sale price: $460,000
- Total homes sold: 283
-- Share that sold above list: 22.6%

- Average price difference: 1.88% below list
-- Median list price: $436,450
-- Median sale price: $410,500
- Total homes sold: 114
-- Share that sold above list: 26.3%
- Average price difference: 1.88% below list
-- Median list price: $392,480
-- Median sale price: $369,397
- Total homes sold: 544
-- Share that sold above list: 13.2%

- Average price difference: 1.91% below list
-- Median list price: $305,000
-- Median sale price: $277,500
- Total homes sold: 123
-- Share that sold above list: 22.0%

- Average price difference: 1.96% below list
-- Median list price: $331,450
-- Median sale price: $317,500
- Total homes sold: 305
-- Share that sold above list: 20.7%

- Average price difference: 1.99% below list
-- Median list price: $259,900
-- Median sale price: $249,900
- Total homes sold: 115
-- Share that sold above list: 24.3%
- Average price difference: 2.06% below list
-- Median list price: $288,995
-- Median sale price: $286,995
- Total homes sold: 230
-- Share that sold above list: 20.4%
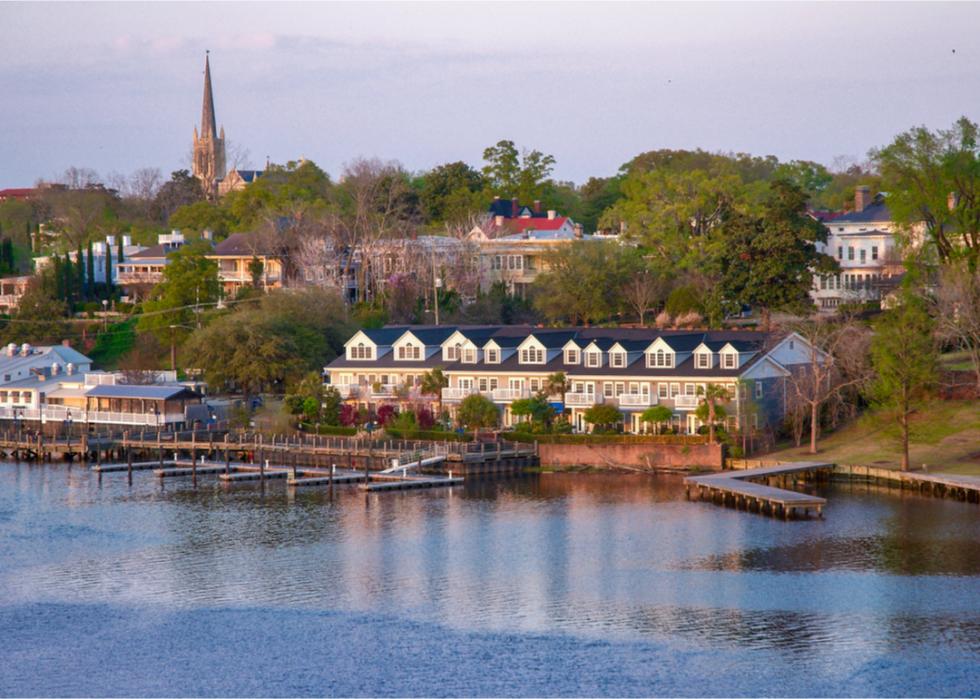
- Average price difference: 2.11% below list
-- Median list price: $489,000
-- Median sale price: $410,000
- Total homes sold: 359
-- Share that sold above list: 20.6%
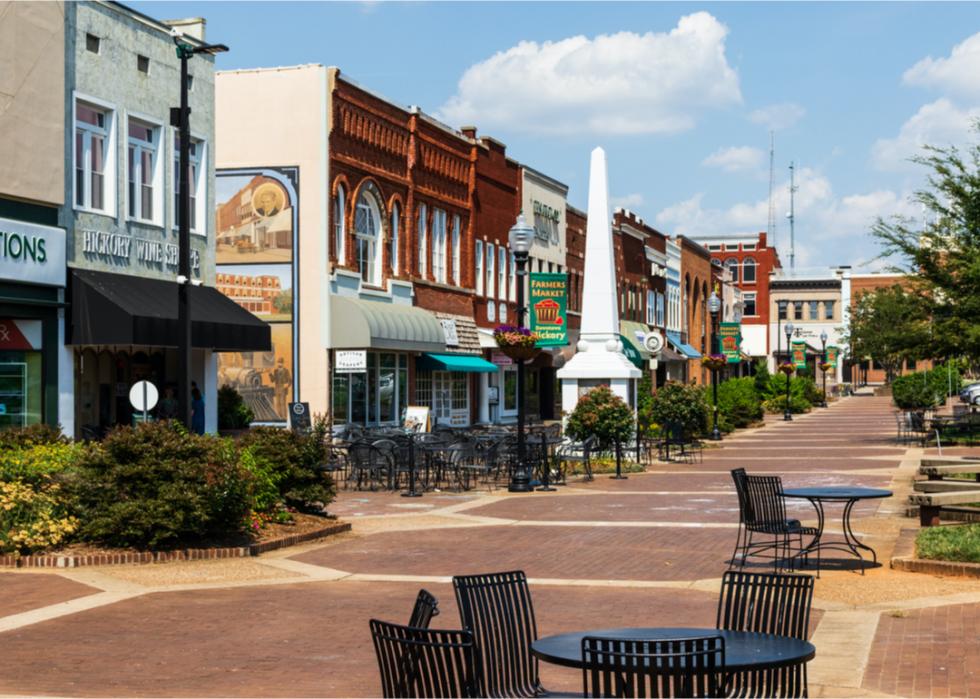
- Average price difference: 2.15% below list
-- Median list price: $348,950
-- Median sale price: $316,999
- Total homes sold: 176
-- Share that sold above list: 24.4%

- Average price difference: 2.20% below list
-- Median list price: $649,000
-- Median sale price: $564,950
- Total homes sold: 112
-- Share that sold above list: 16.1%

- Average price difference: 2.22% below list
-- Median list price: $417,000
-- Median sale price: $389,000
- Total homes sold: 291
-- Share that sold above list: 14.8%
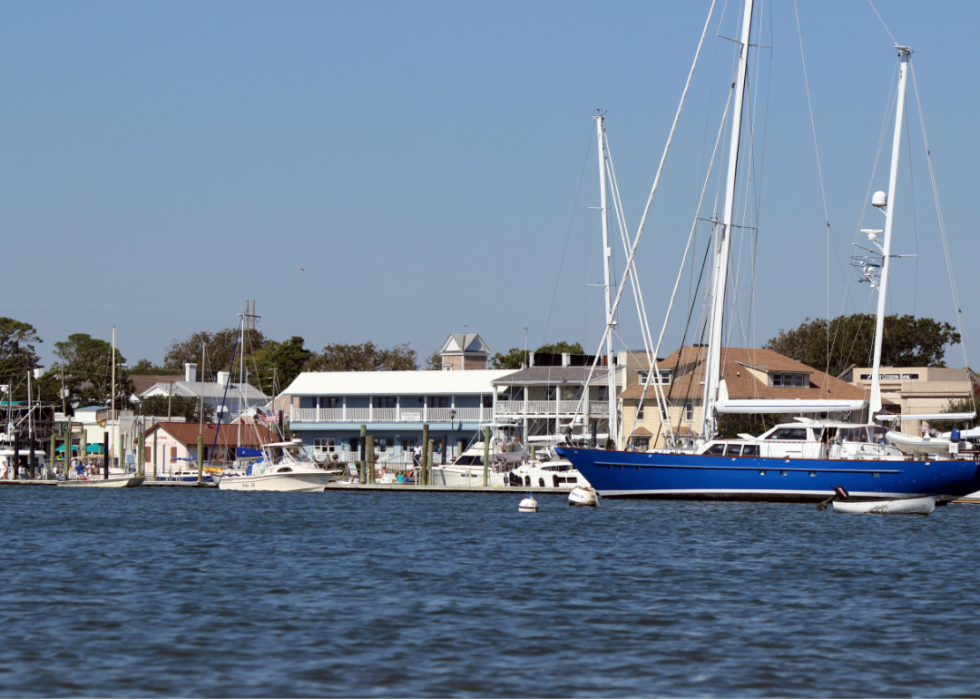
- Average price difference: 2.53% below list
-- Median list price: $517,000
-- Median sale price: $485,500
- Total homes sold: 112
-- Share that sold above list: 20.5%
This story features data reporting and writing by Elena Cox and is part of a series utilizing data automation across 28 states.
