Counties with the most tornadoes in North Carolina
Stacker
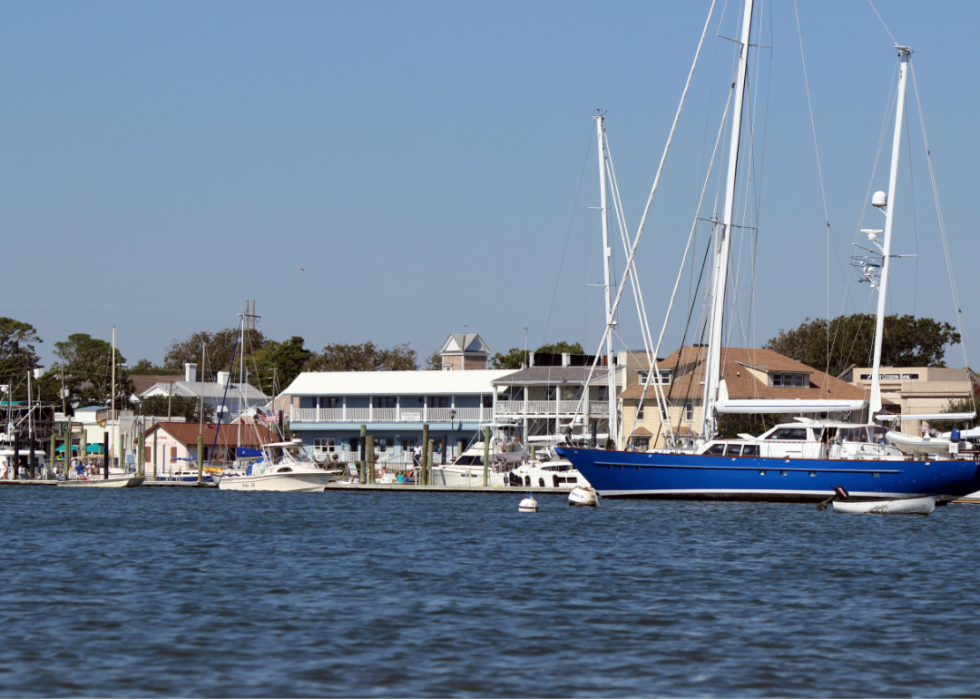
David Louis Econopouly // Shutterstock
- Tornadoes since 2000: 5 (1.18 per 100 square miles)
- #1,658 nationally
- Tornadoes this year, as of May 31: 0
- #1,658 nationally
- Tornadoes this year, as of May 31: 0
#50. Alamance County

Canva
- Tornadoes since 2000: 7 (1.22 per 100 square miles)
- #1,628 nationally
- Tornadoes this year, as of May 31: 0
- #1,628 nationally
- Tornadoes this year, as of May 31: 0
#49. Iredell County

Nolichuckyjake // Shutterstock
- Tornadoes since 2000: 7 (1.24 per 100 square miles)
- #1,603 nationally
- Tornadoes this year, as of May 31: 0
- #1,603 nationally
- Tornadoes this year, as of May 31: 0
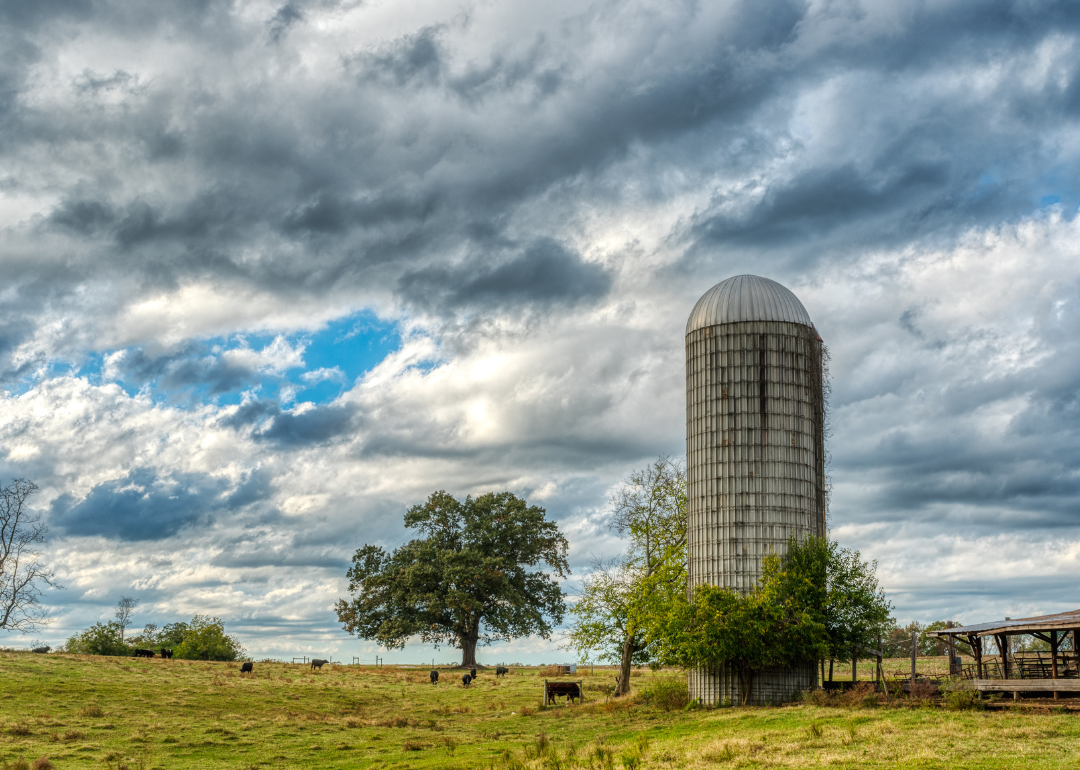
#48. Rutherford County

Chansak Joe // Shutterstock
- Tornadoes since 2000: 11 (1.26 per 100 square miles)
- #1,580 nationally
- Tornadoes this year, as of May 31: 0
- #1,580 nationally
- Tornadoes this year, as of May 31: 0
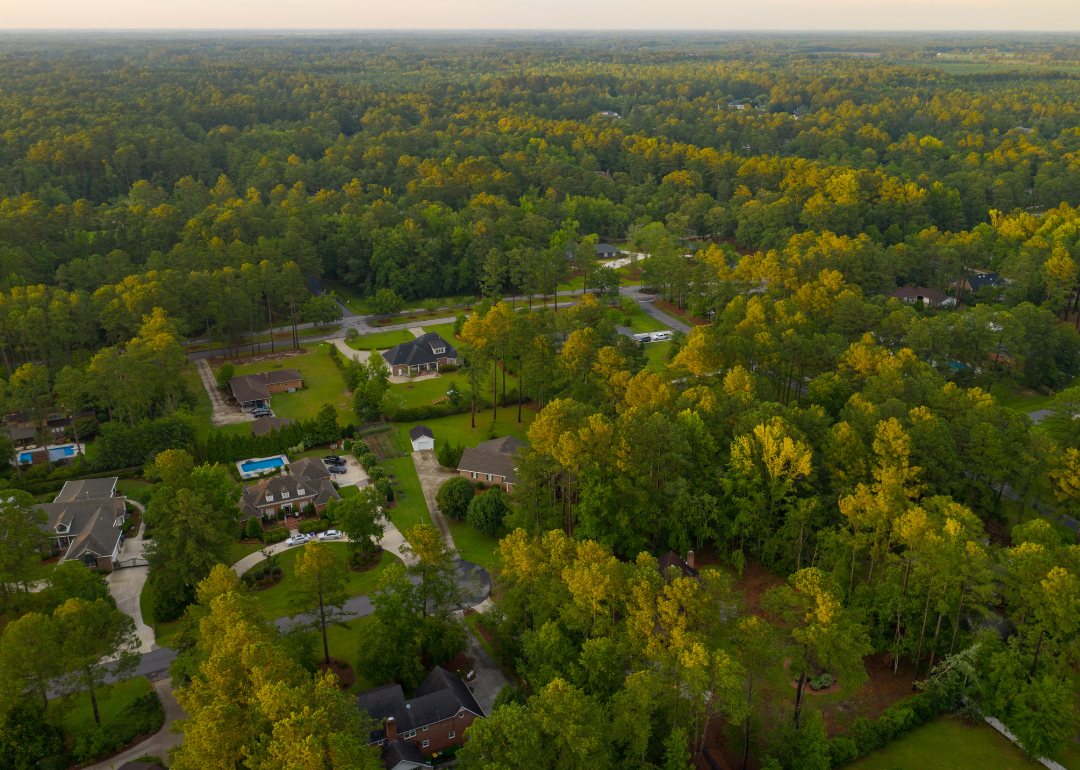
#47. Bladen County
Isaiah N Lilly // Shutterstock
- Tornadoes since 2000: 5 (1.27 per 100 square miles)
- #1,574 nationally
- Tornadoes this year, as of May 31: 0
- #1,574 nationally
- Tornadoes this year, as of May 31: 0
#46. Stanly County

Canva
- Tornadoes since 2000: 7 (1.27 per 100 square miles)
- #1,573 nationally
- Tornadoes this year, as of May 31: 0
- #1,573 nationally
- Tornadoes this year, as of May 31: 0
#45. Davidson County
Canva
- Tornadoes since 2000: 5 (1.28 per 100 square miles)
- #1,565 nationally
- Tornadoes this year, as of May 31: 0
- #1,565 nationally
- Tornadoes this year, as of May 31: 0
#44. Hoke County

Canva
- Tornadoes since 2000: 12 (1.44 per 100 square miles)
- #1,456 nationally
- Tornadoes this year, as of May 31: 0
- #1,456 nationally
- Tornadoes this year, as of May 31: 0
#43. Wake County
mzglass96 // Shutterstock
- Tornadoes since 2000: 5 (1.49 per 100 square miles)
- #1,422 nationally
- Tornadoes this year, as of May 31: 0
- #1,422 nationally
- Tornadoes this year, as of May 31: 0
#42. Yadkin County

Nolichuckyjake // Shutterstock
- Tornadoes since 2000: 6 (1.50 per 100 square miles)
- #1,412 nationally
- Tornadoes this year, as of May 31: 0
- #1,412 nationally
- Tornadoes this year, as of May 31: 0
#41. Catawba County

digidreamgrafix // Shutterstock
- Tornadoes since 2000: 8 (1.53 per 100 square miles)
- #1,401 nationally
- Tornadoes this year, as of May 31: 0
- #1,401 nationally
- Tornadoes this year, as of May 31: 0
#40. Mecklenburg County

Scott Alan Ritchie // Shutterstock
- Tornadoes since 2000: 6 (1.53 per 100 square miles)
- #1,400 nationally
- Tornadoes this year, as of May 31: 0
- #1,400 nationally
- Tornadoes this year, as of May 31: 0
#39. Person County

Canva
- Tornadoes since 2000: 8 (1.58 per 100 square miles)
- #1,374 nationally
- Tornadoes this year, as of May 31: 0
- #1,374 nationally
- Tornadoes this year, as of May 31: 0
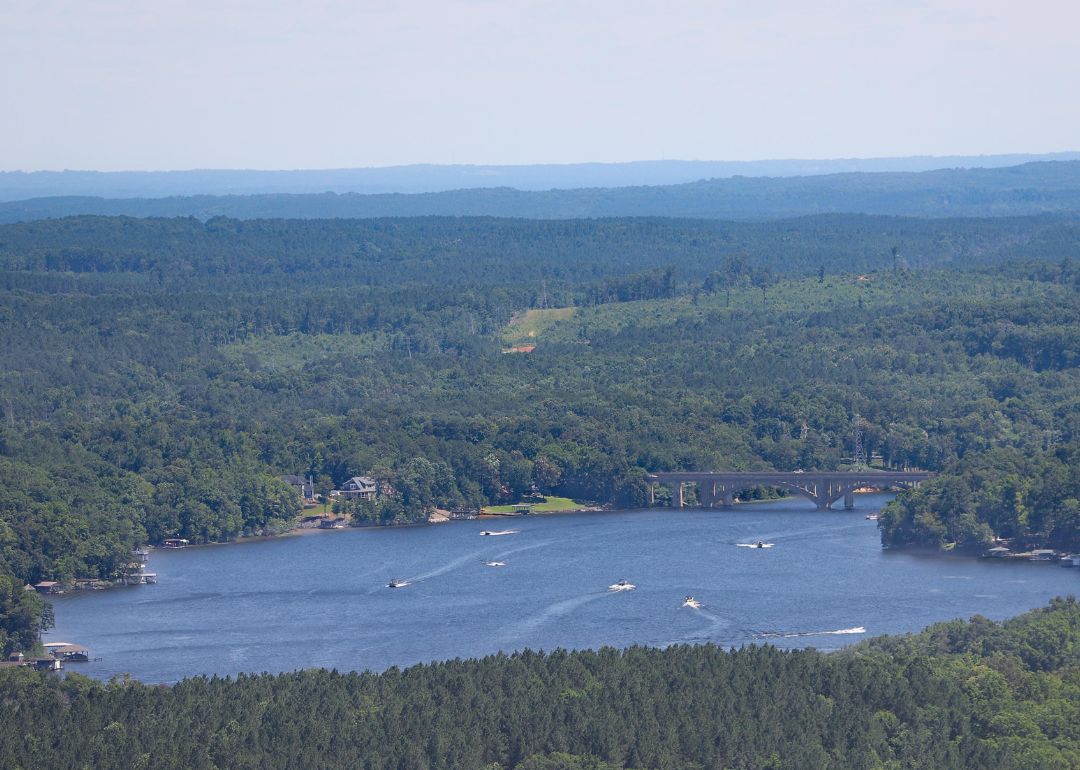
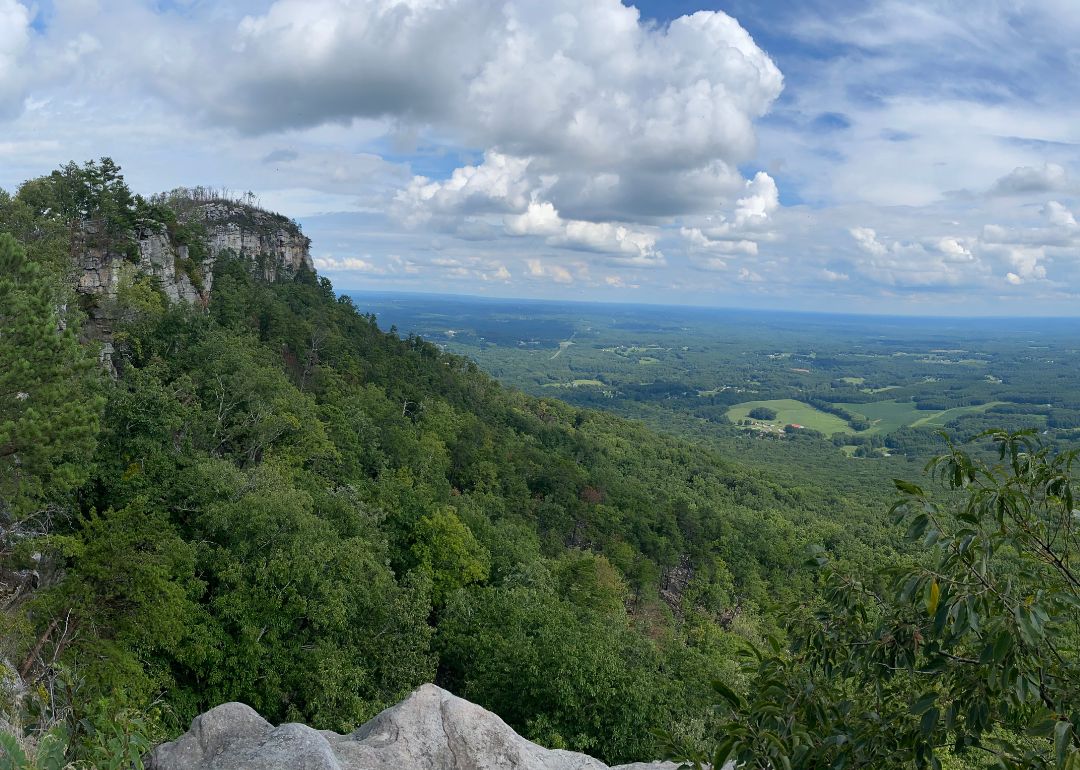
#38. Burke County

D Guest Smith // Shutterstock
- Tornadoes since 2000: 6 (1.72 per 100 square miles)
- #1,262 nationally
- Tornadoes this year, as of May 31: 0
- #1,262 nationally
- Tornadoes this year, as of May 31: 0
#37. Washington County

Sean Pavone // Shutterstock
- Tornadoes since 2000: 5 (1.75 per 100 square miles)
- #1,247 nationally
- Tornadoes this year, as of May 31: 0
- #1,247 nationally
- Tornadoes this year, as of May 31: 0
#36. Durham County

Bryan Pollard // Shutterstock
- Tornadoes since 2000: 7 (1.76 per 100 square miles)
- #1,241 nationally
- Tornadoes this year, as of May 31: 0
- #1,241 nationally
- Tornadoes this year, as of May 31: 0
#35. Orange County

Giulia Carletti // Shutterstock
- Tornadoes since 2000: 10 (1.81 per 100 square miles)
- #1,200 nationally
- Tornadoes this year, as of May 31: 0
- #1,200 nationally
- Tornadoes this year, as of May 31: 0
#34. Wayne County

Canva
- Tornadoes since 2000: 15 (1.84 per 100 square miles)
- #1,173 nationally
- Tornadoes this year, as of May 31: 1
- #1,173 nationally
- Tornadoes this year, as of May 31: 1
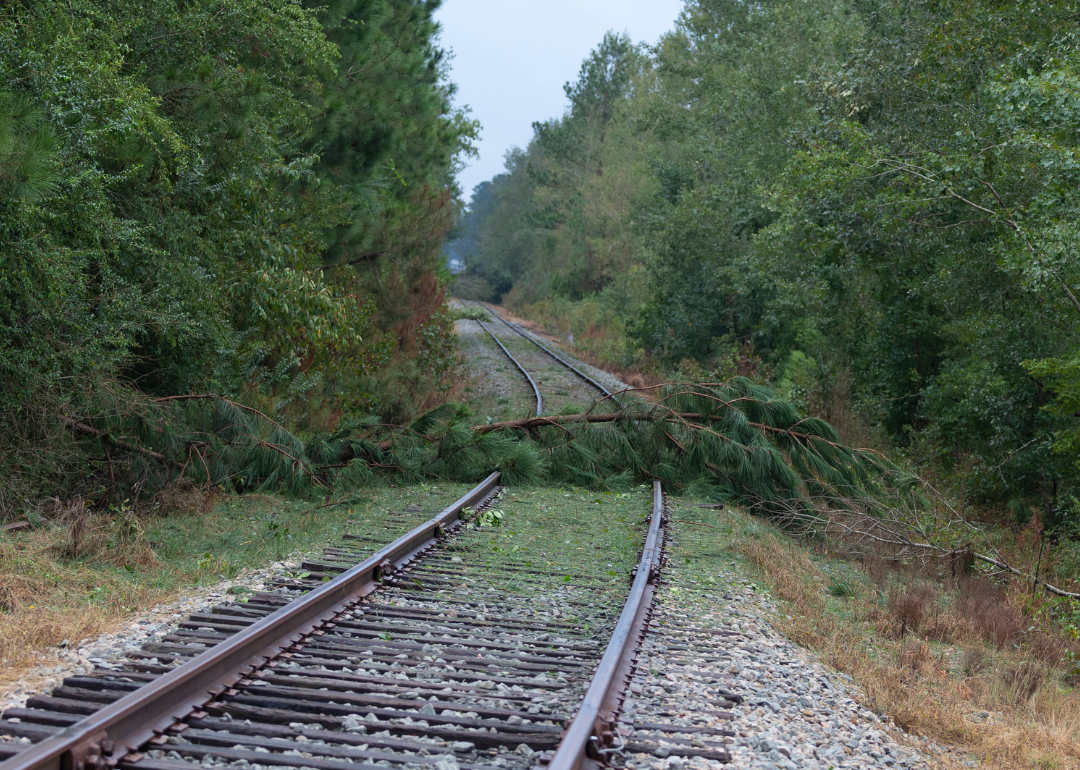
#33. Duplin County

Wileydoc // Shutterstock
- Tornadoes since 2000: 11 (1.85 per 100 square miles)
- #1,163 nationally
- Tornadoes this year, as of May 31: 0
- #1,163 nationally
- Tornadoes this year, as of May 31: 0
#32. Harnett County

Nolichuckyjake // Shutterstock
- Tornadoes since 2000: 5 (1.89 per 100 square miles)
- #1,130 nationally
- Tornadoes this year, as of May 31: 0
- #1,130 nationally
- Tornadoes this year, as of May 31: 0
#31. Davie County
Canva
- Tornadoes since 2000: 18 (1.90 per 100 square miles)
- #1,127 nationally
- Tornadoes this year, as of May 31: 0
- #1,127 nationally
- Tornadoes this year, as of May 31: 0
#30. Robeson County
StacieStauffSmith Photos // Shutterstock
- Tornadoes since 2000: 18 (1.92 per 100 square miles)
- #1,118 nationally
- Tornadoes this year, as of May 31: 0
- #1,118 nationally
- Tornadoes this year, as of May 31: 0
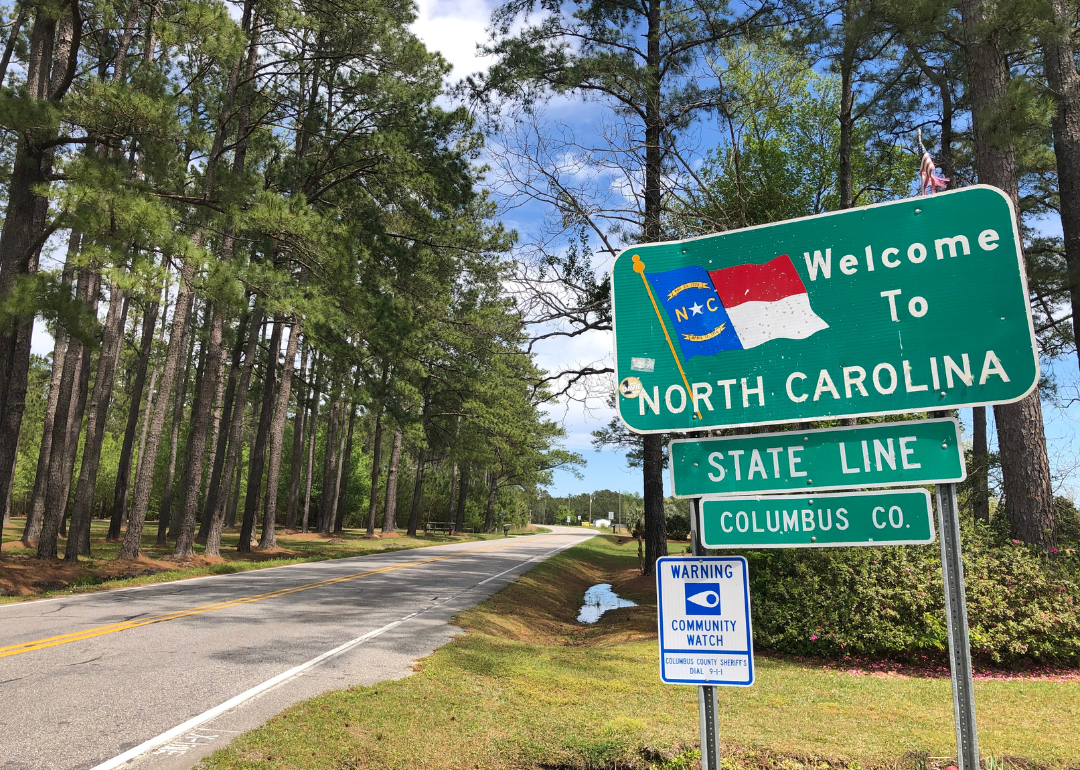
#29. Columbus County

Canva
- Tornadoes since 2000: 7 (1.94 per 100 square miles)
- #1,107 nationally
- Tornadoes this year, as of May 31: 0
- #1,107 nationally
- Tornadoes this year, as of May 31: 0
#28. Cabarrus County

tjewell041810 // Shutterstock
- Tornadoes since 2000: 8 (2.00 per 100 square miles)
- #1,062 nationally
- Tornadoes this year, as of May 31: 0
- #1,062 nationally
- Tornadoes this year, as of May 31: 0
#27. Lenoir County
SevenMaps // Shutterstock
- Tornadoes since 2000: 14 (2.00 per 100 square miles)
- #1,056 nationally
- Tornadoes this year, as of May 31: 0
- #1,056 nationally
- Tornadoes this year, as of May 31: 0
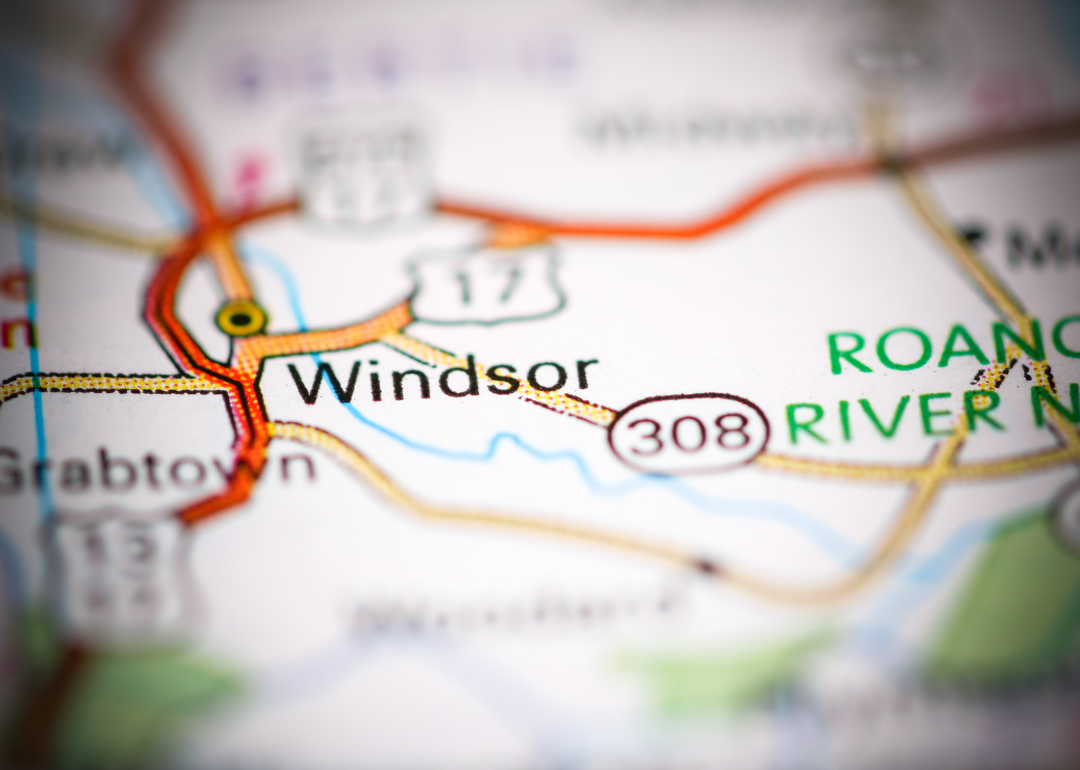
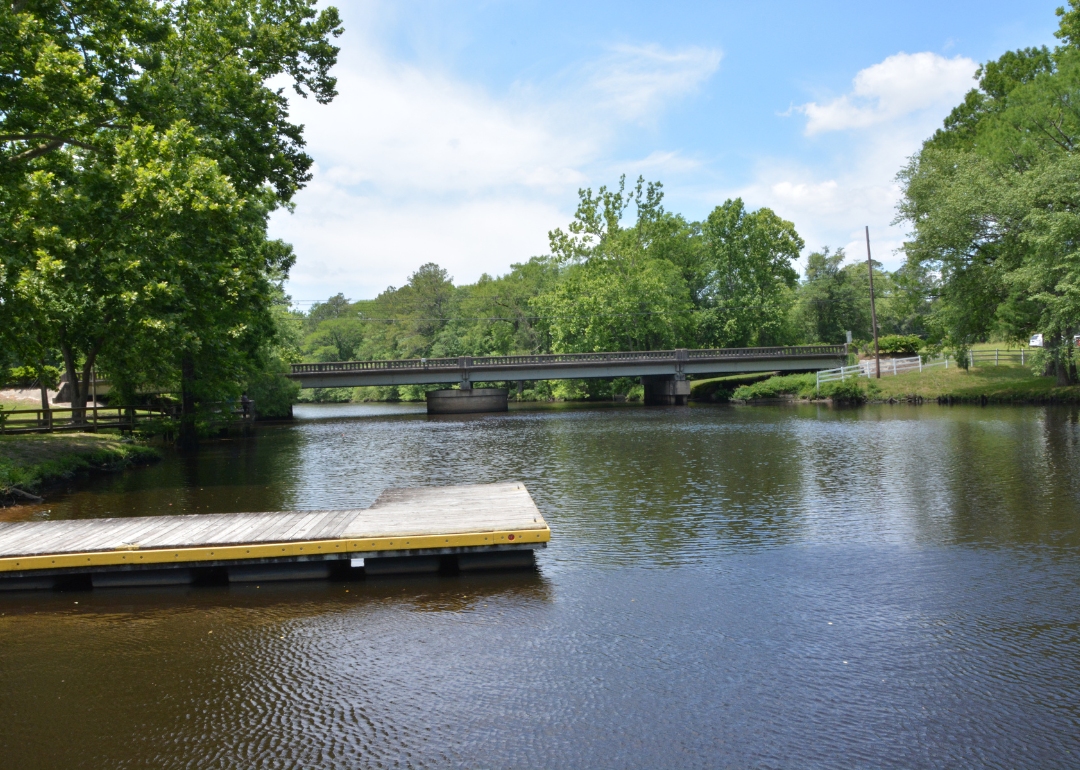
#26. Bertie County
Canva
- Tornadoes since 2000: 7 (2.08 per 100 square miles)
- #1,001 nationally
- Tornadoes this year, as of May 31: 0
- #1,001 nationally
- Tornadoes this year, as of May 31: 0
#25. Pamlico County
aceshot1 // Shutterstock
- Tornadoes since 2000: 6 (2.29 per 100 square miles)
- #860 nationally
- Tornadoes this year, as of May 31: 0
- #860 nationally
- Tornadoes this year, as of May 31: 0
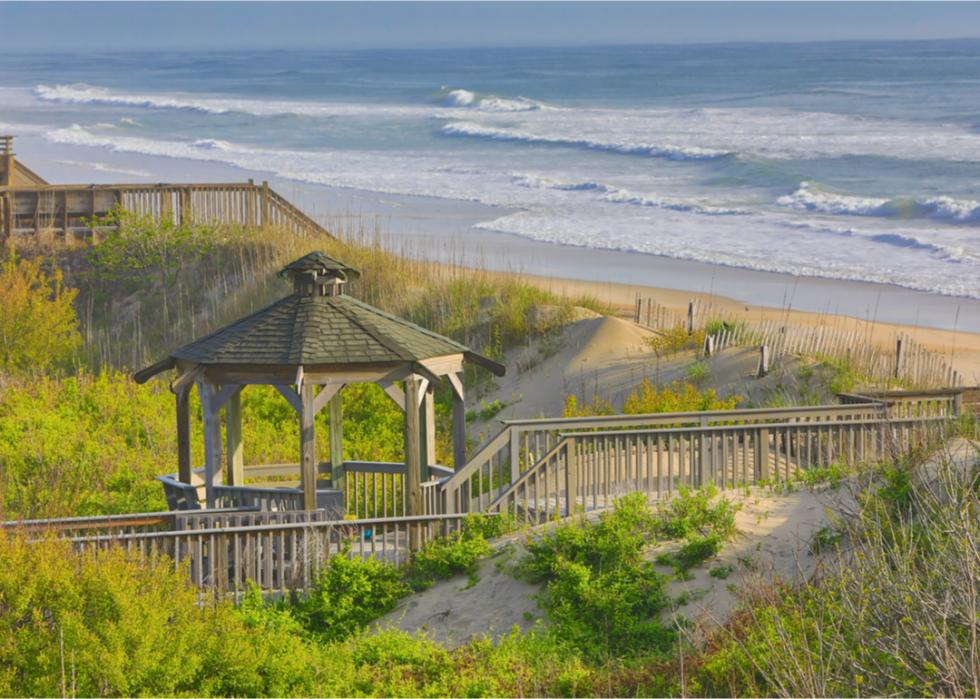
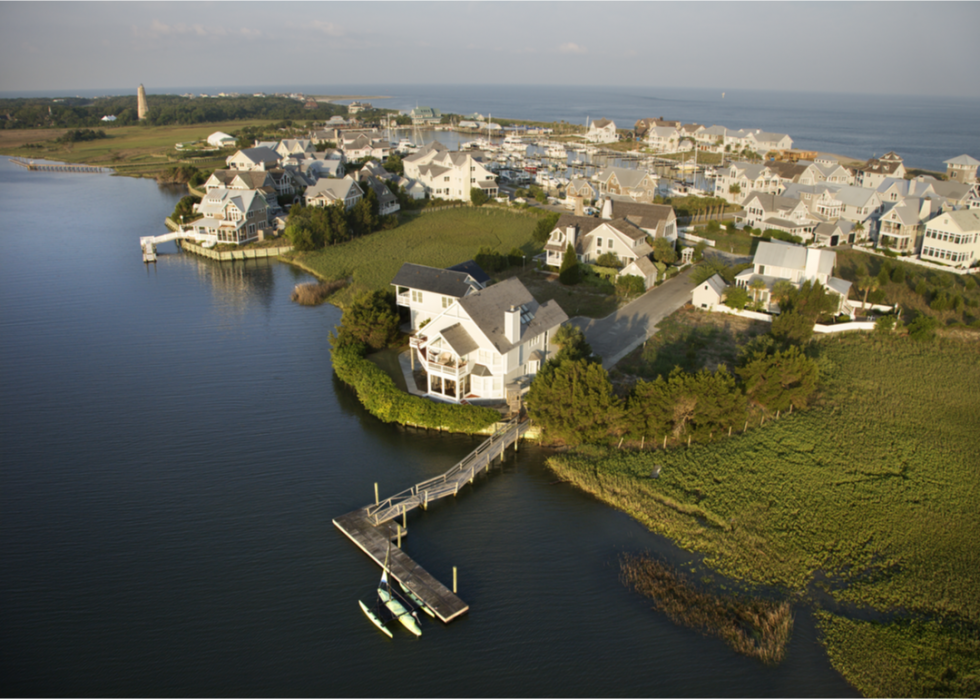
#24. Currituck County

P W L Photography // Shutterstock
- Tornadoes since 2000: 9 (2.31 per 100 square miles)
- #850 nationally
- Tornadoes this year, as of May 31: 0
- #850 nationally
- Tornadoes this year, as of May 31: 0
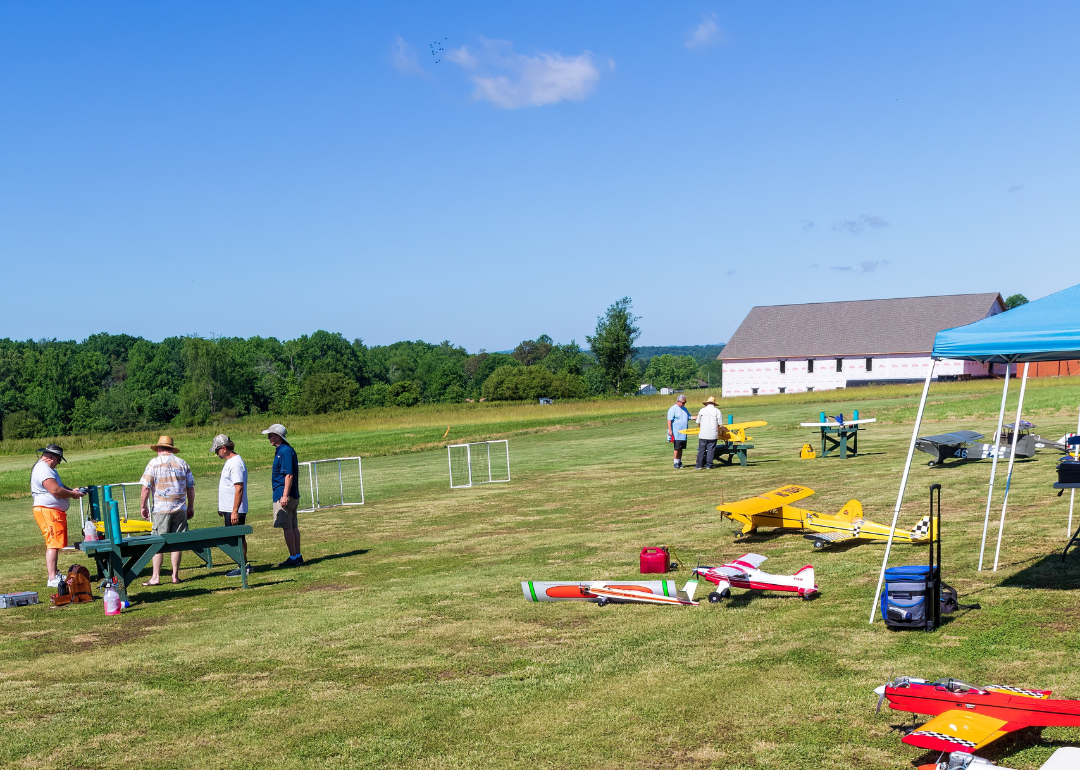
#23. Tyrrell County

Wileydoc / Shutterstock
- Tornadoes since 2000: 19 (2.40 per 100 square miles)
- #786 nationally
- Tornadoes this year, as of May 31: 0
- #786 nationally
- Tornadoes this year, as of May 31: 0
#22. Johnston County

D Guest Smith // Shutterstock
- Tornadoes since 2000: 6 (2.43 per 100 square miles)
- #767 nationally
- Tornadoes this year, as of May 31: 0
- #767 nationally
- Tornadoes this year, as of May 31: 0
#21. Perquimans County
Canva
- Tornadoes since 2000: 12 (2.55 per 100 square miles)
- #704 nationally
- Tornadoes this year, as of May 31: 2
- #704 nationally
- Tornadoes this year, as of May 31: 2
#20. Jones County

Nikola Spasic Photography // Shutterstock
- Tornadoes since 2000: 17 (2.61 per 100 square miles)
- #679 nationally
- Tornadoes this year, as of May 31: 0
- #679 nationally
- Tornadoes this year, as of May 31: 0
#19. Pitt County
Anya Douglas // Shutterstock
- Tornadoes since 2000: 21 (2.75 per 100 square miles)
- #609 nationally
- Tornadoes this year, as of May 31: 1
- #609 nationally
- Tornadoes this year, as of May 31: 1
#18. Onslow County

D Guest Smith // Shutterstock
- Tornadoes since 2000: 13 (2.82 per 100 square miles)
- #580 nationally
- Tornadoes this year, as of May 31: 0
- #580 nationally
- Tornadoes this year, as of May 31: 0
#17. Martin County

Canva
- Tornadoes since 2000: 20 (2.82 per 100 square miles)
- #578 nationally
- Tornadoes this year, as of May 31: 0
- #578 nationally
- Tornadoes this year, as of May 31: 0
#16. Craven County
SevenMaps // Shutterstock
- Tornadoes since 2000: 10 (2.83 per 100 square miles)
- #575 nationally
- Tornadoes this year, as of May 31: 0
- #575 nationally
- Tornadoes this year, as of May 31: 0
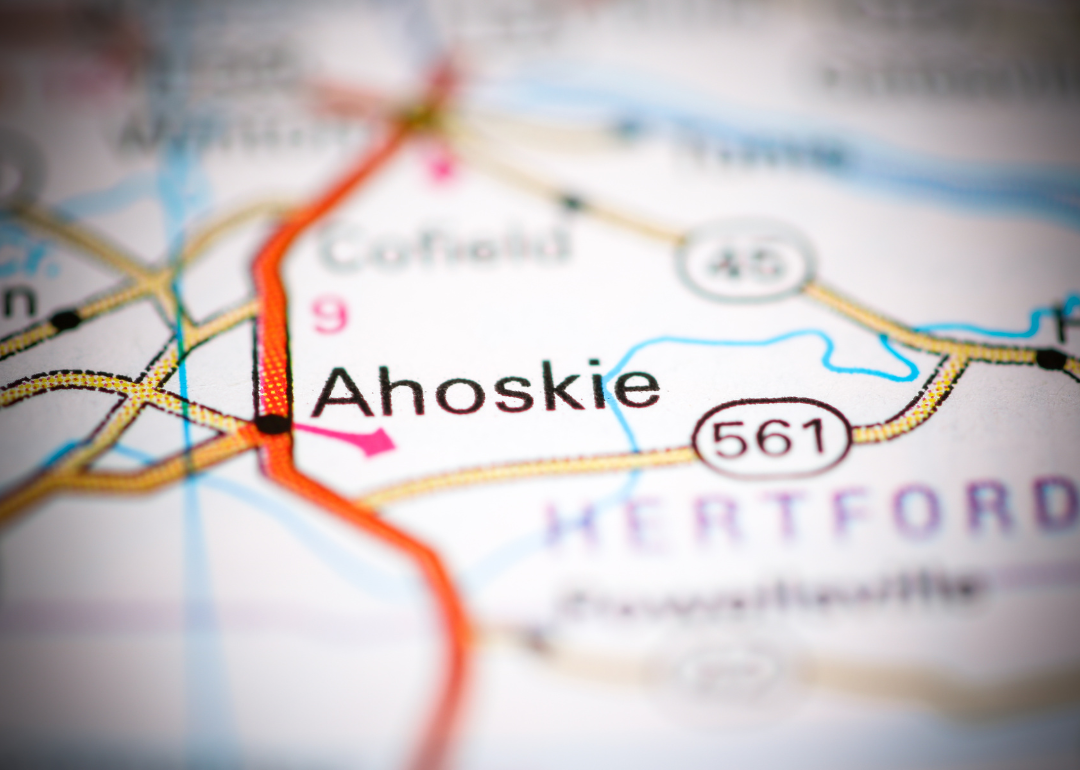
#15. Hertford County
iofoto // Shutterstock
- Tornadoes since 2000: 24 (2.83 per 100 square miles)
- #574 nationally
- Tornadoes this year, as of May 31: 0
- #574 nationally
- Tornadoes this year, as of May 31: 0
#14. Brunswick County

MarkVanDykePhotography // Shutterstock
- Tornadoes since 2000: 11 (2.87 per 100 square miles)
- #562 nationally
- Tornadoes this year, as of May 31: 0
- #562 nationally
- Tornadoes this year, as of May 31: 0
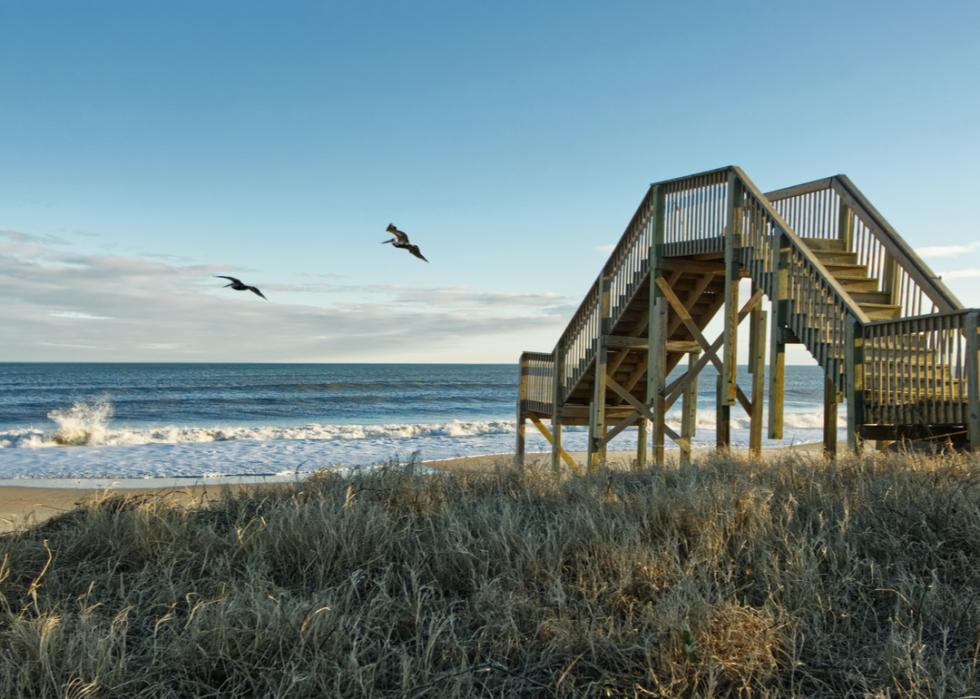
#13. Dare County

David Byron Keener // Shutterstock
- Tornadoes since 2000: 24 (2.90 per 100 square miles)
- #544 nationally
- Tornadoes this year, as of May 31: 1
- #544 nationally
- Tornadoes this year, as of May 31: 1
#12. Beaufort County
Nolichuckyjake // Shutterstock
- Tornadoes since 2000: 8 (3.08 per 100 square miles)
- #470 nationally
- Tornadoes this year, as of May 31: 0
- #470 nationally
- Tornadoes this year, as of May 31: 0
#11. Alexander County

Canva
- Tornadoes since 2000: 27 (3.10 per 100 square miles)
- #459 nationally
- Tornadoes this year, as of May 31: 0
- #459 nationally
- Tornadoes this year, as of May 31: 0
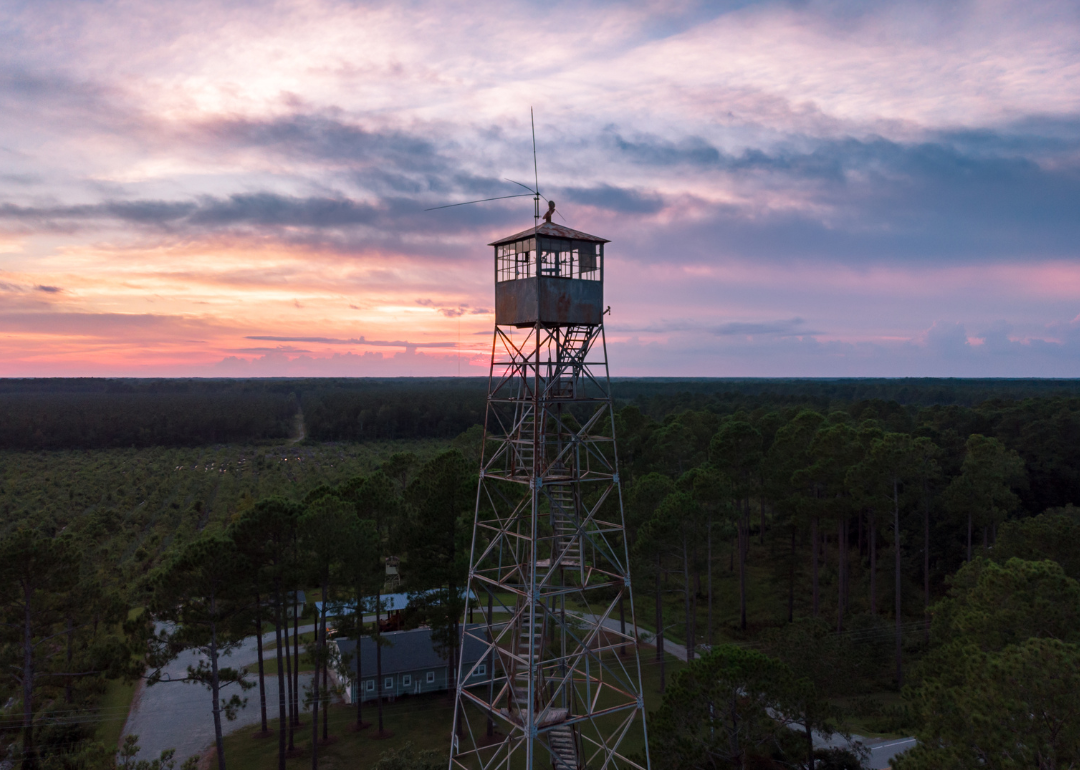
#10. Pender County

Canva
- Tornadoes since 2000: 12 (3.37 per 100 square miles)
- #360 nationally
- Tornadoes this year, as of May 31: 1
- #360 nationally
- Tornadoes this year, as of May 31: 1
#9. Gaston County

Canva
- Tornadoes since 2000: 8 (3.53 per 100 square miles)
- #318 nationally
- Tornadoes this year, as of May 31: 0
- #318 nationally
- Tornadoes this year, as of May 31: 0
#8. Pasquotank County

Wileydoc // Shutterstock
- Tornadoes since 2000: 13 (3.53 per 100 square miles)
- #317 nationally
- Tornadoes this year, as of May 31: 0
- #317 nationally
- Tornadoes this year, as of May 31: 0
#7. Wilson County
Canva
- Tornadoes since 2000: 17 (3.66 per 100 square miles)
- #291 nationally
- Tornadoes this year, as of May 31: 0
- #291 nationally
- Tornadoes this year, as of May 31: 0
#6. Cleveland County
SevenMaps // Shutterstock
- Tornadoes since 2000: 10 (3.76 per 100 square miles)
- #274 nationally
- Tornadoes this year, as of May 31: 0
- #274 nationally
- Tornadoes this year, as of May 31: 0
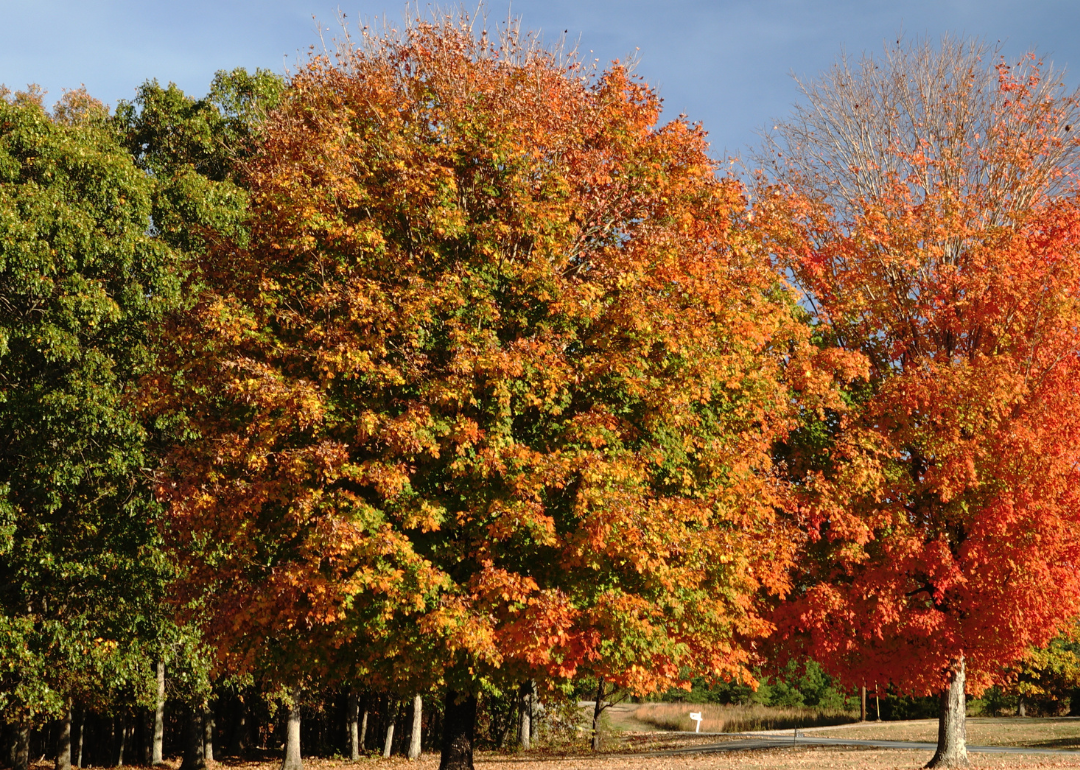
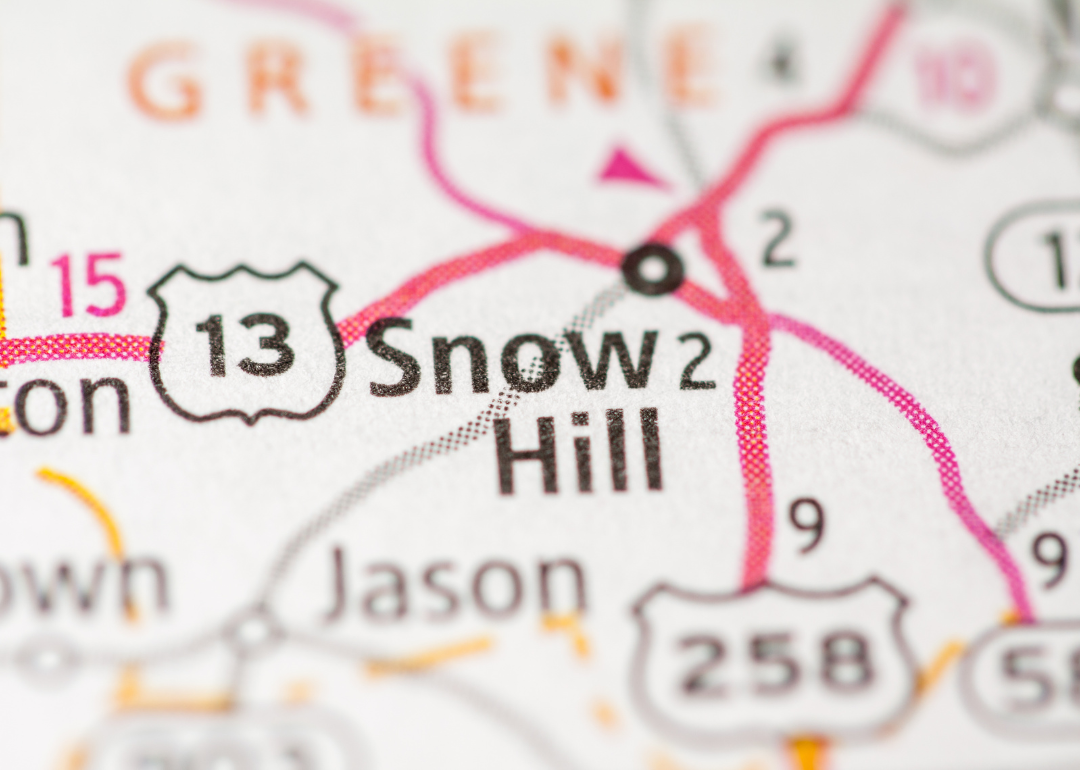
#5. Greene County

Canva
- Tornadoes since 2000: 7 (4.06 per 100 square miles)
- #223 nationally
- Tornadoes this year, as of May 31: 0
- #223 nationally
- Tornadoes this year, as of May 31: 0
#4. Chowan County

Nolichuckyjake // Shutterstock
- Tornadoes since 2000: 14 (4.70 per 100 square miles)
- #128 nationally
- Tornadoes this year, as of May 31: 0
- #128 nationally
- Tornadoes this year, as of May 31: 0
#3. Lincoln County

PatGallery // Shutterstock
- Tornadoes since 2000: 17 (8.88 per 100 square miles)
- #10 nationally
- Tornadoes this year, as of May 31: 0
- #10 nationally
- Tornadoes this year, as of May 31: 0
#2. New Hanover County
Canva
- Tornadoes since 2000: 49 (9.68 per 100 square miles)
- #4 nationally
- Tornadoes this year, as of May 31: 0
- #4 nationally
- Tornadoes this year, as of May 31: 0
#1. Carteret County
Canva