Counties with the most bridges in dire need of repair in North Dakota

- Bridges in poor condition: 11.1% (5 of 45 bridges)
- Square meters of bridges in poor condition: 4.0% (355 of 8,918 square meters of bridges)
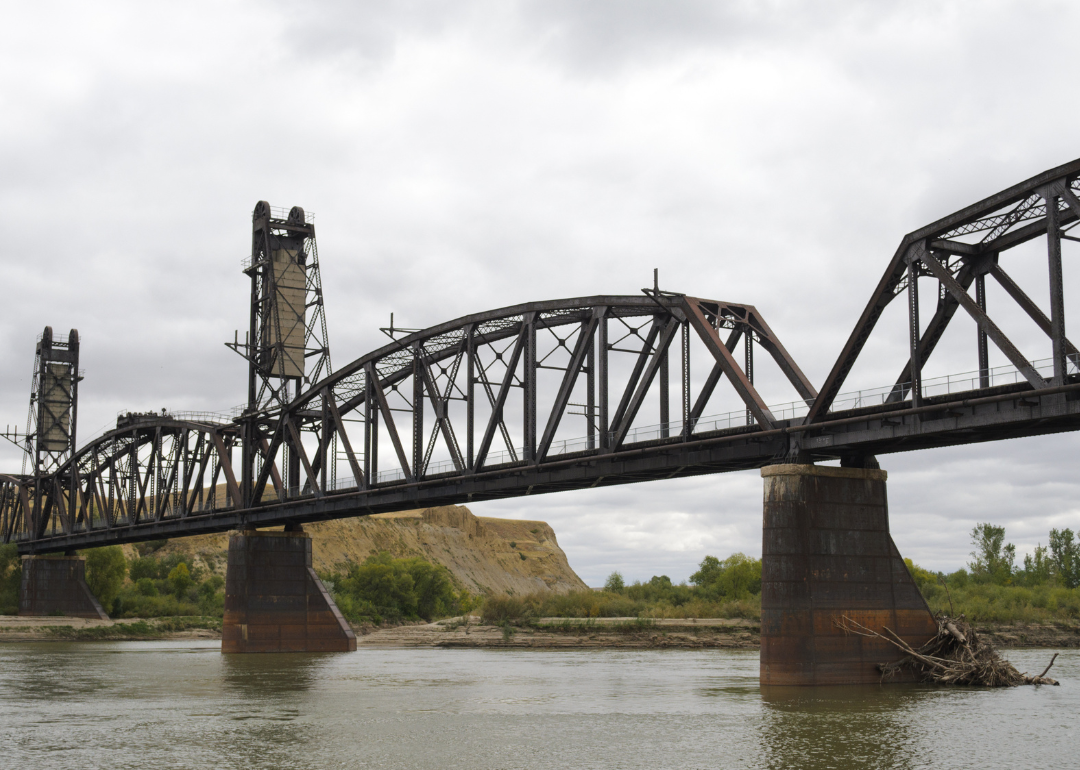
- Bridges in poor condition: 11.1% (3 of 27 bridges)
- Square meters of bridges in poor condition: 6.7% (484 of 7,189 square meters of bridges)

- Bridges in poor condition: 11.4% (4 of 35 bridges)
- Square meters of bridges in poor condition: 5.8% (730 of 12,503 square meters of bridges)

- Bridges in poor condition: 11.7% (23 of 196 bridges)
- Square meters of bridges in poor condition: 4.4% (2,954 of 67,257 square meters of bridges)
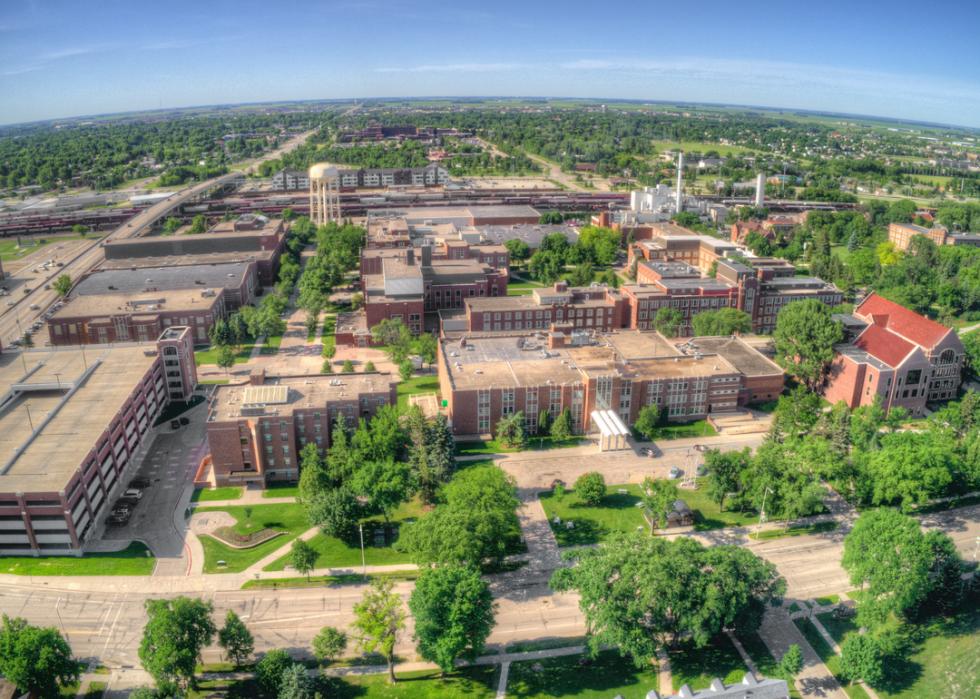
- Bridges in poor condition: 12.2% (42 of 345 bridges)
- Square meters of bridges in poor condition: 19.1% (17,755 of 93,002 square meters of bridges)
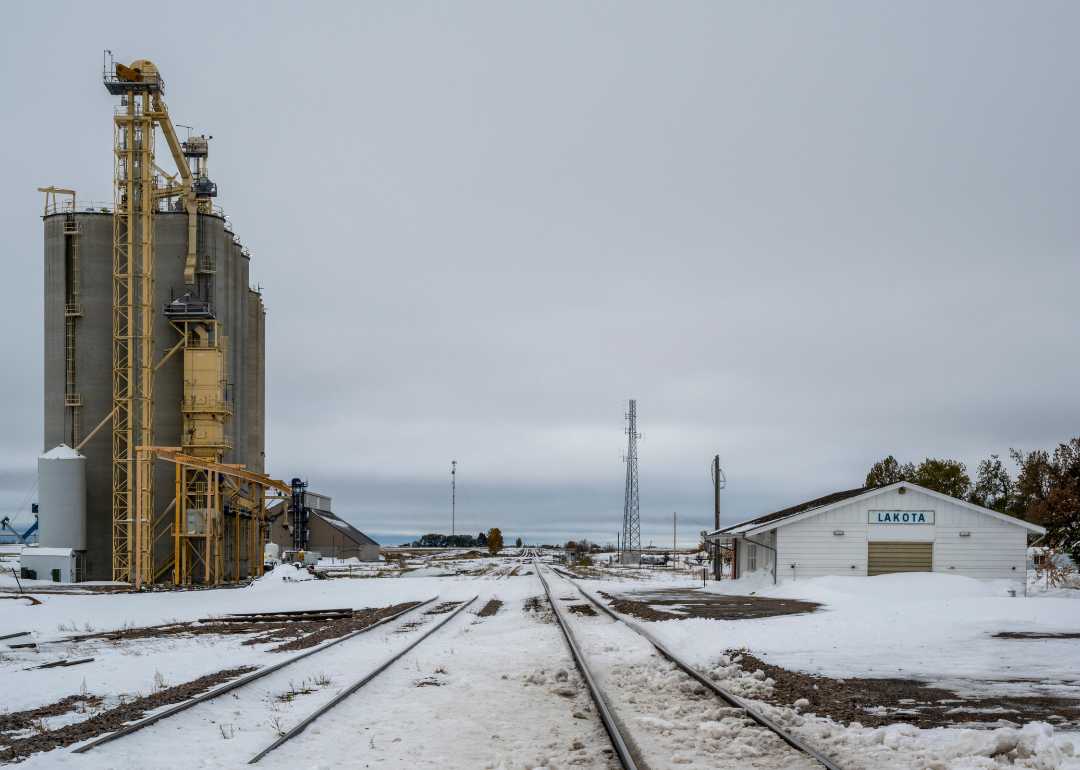
- Bridges in poor condition: 13.0% (3 of 23 bridges)
- Square meters of bridges in poor condition: 5.0% (367 of 7,338 square meters of bridges)

- Bridges in poor condition: 13.7% (21 of 153 bridges)
- Square meters of bridges in poor condition: 9.7% (5,237 of 53,806 square meters of bridges)
- Bridges in poor condition: 13.8% (4 of 29 bridges)
- Square meters of bridges in poor condition: 11.1% (223 of 2,017 square meters of bridges)
- Bridges in poor condition: 15.0% (6 of 40 bridges)
- Square meters of bridges in poor condition: 14.2% (1,341 of 9,415 square meters of bridges)
- Bridges in poor condition: 15.4% (2 of 13 bridges)
- Square meters of bridges in poor condition: 5.5% (108 of 1,956 square meters of bridges)

- Bridges in poor condition: 18.0% (37 of 205 bridges)
- Square meters of bridges in poor condition: 6.2% (4,182 of 67,253 square meters of bridges)
- Bridges in poor condition: 19.0% (49 of 258 bridges)
- Square meters of bridges in poor condition: 12.4% (6,540 of 52,900 square meters of bridges)
- Bridges in poor condition: 19.0% (19 of 100 bridges)
- Square meters of bridges in poor condition: 4.9% (1,271 of 25,788 square meters of bridges)

- Bridges in poor condition: 19.1% (13 of 68 bridges)
- Square meters of bridges in poor condition: 15.3% (1,733 of 11,320 square meters of bridges)
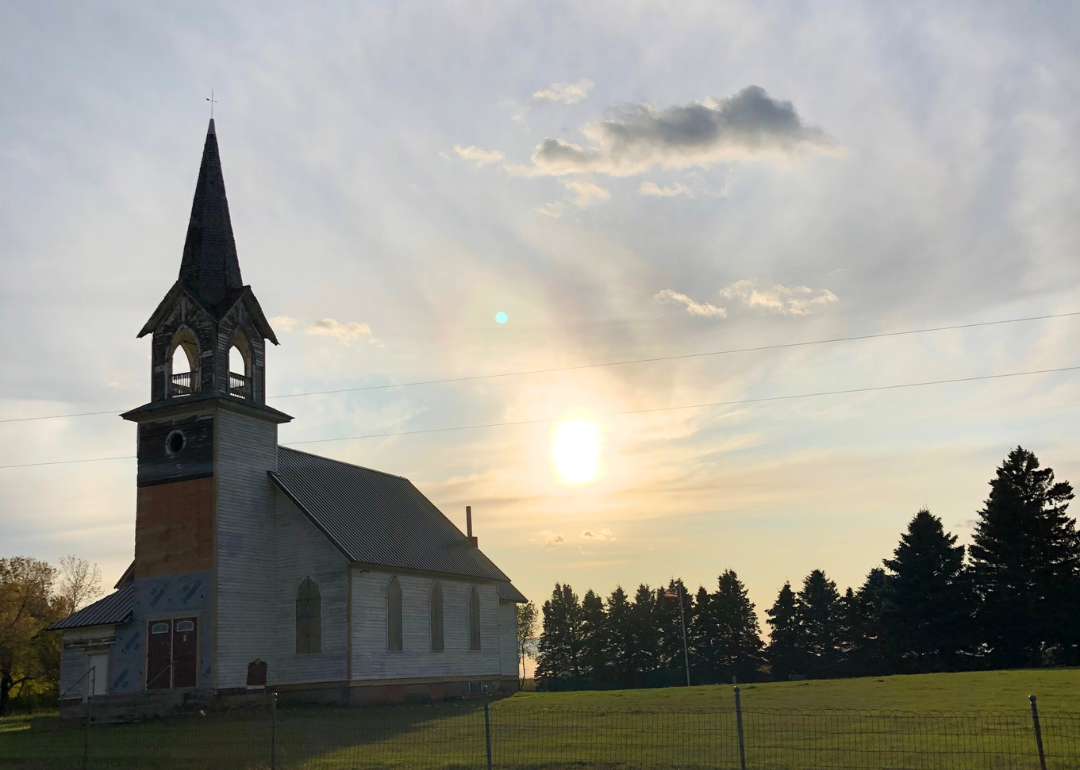
- Bridges in poor condition: 20.0% (1 of 5 bridges)
- Square meters of bridges in poor condition: 6.3% (59 of 940 square meters of bridges)
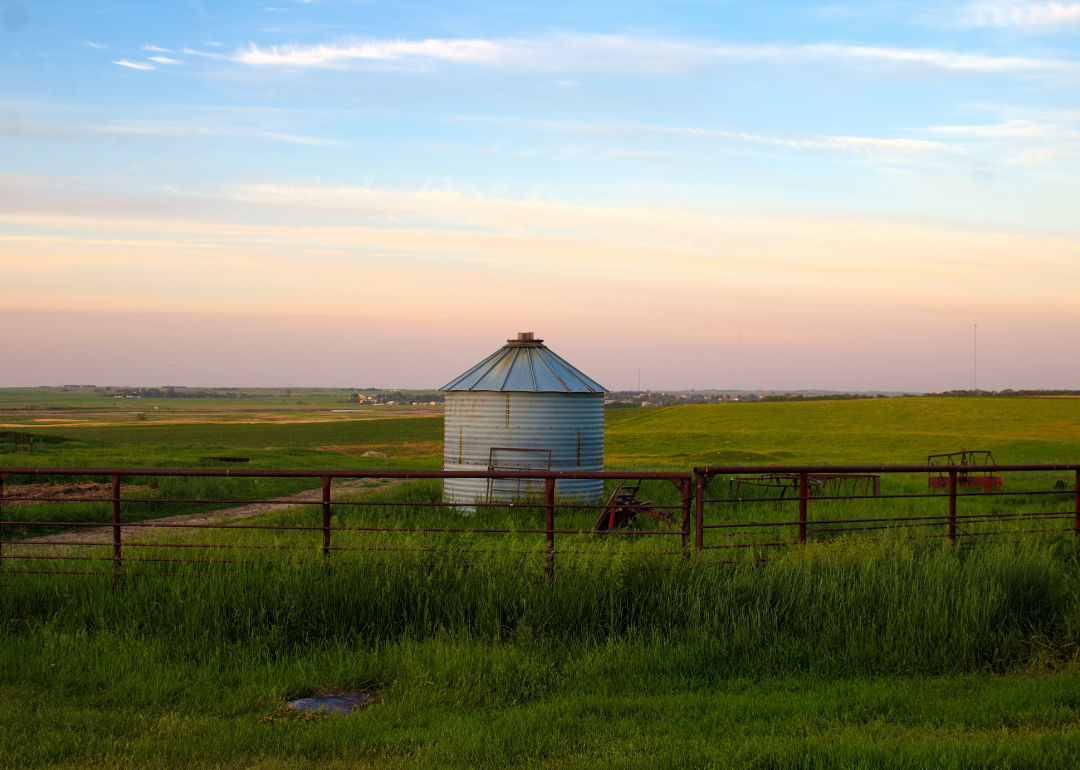
- Bridges in poor condition: 20.7% (6 of 29 bridges)
- Square meters of bridges in poor condition: 11.3% (463 of 4,088 square meters of bridges)
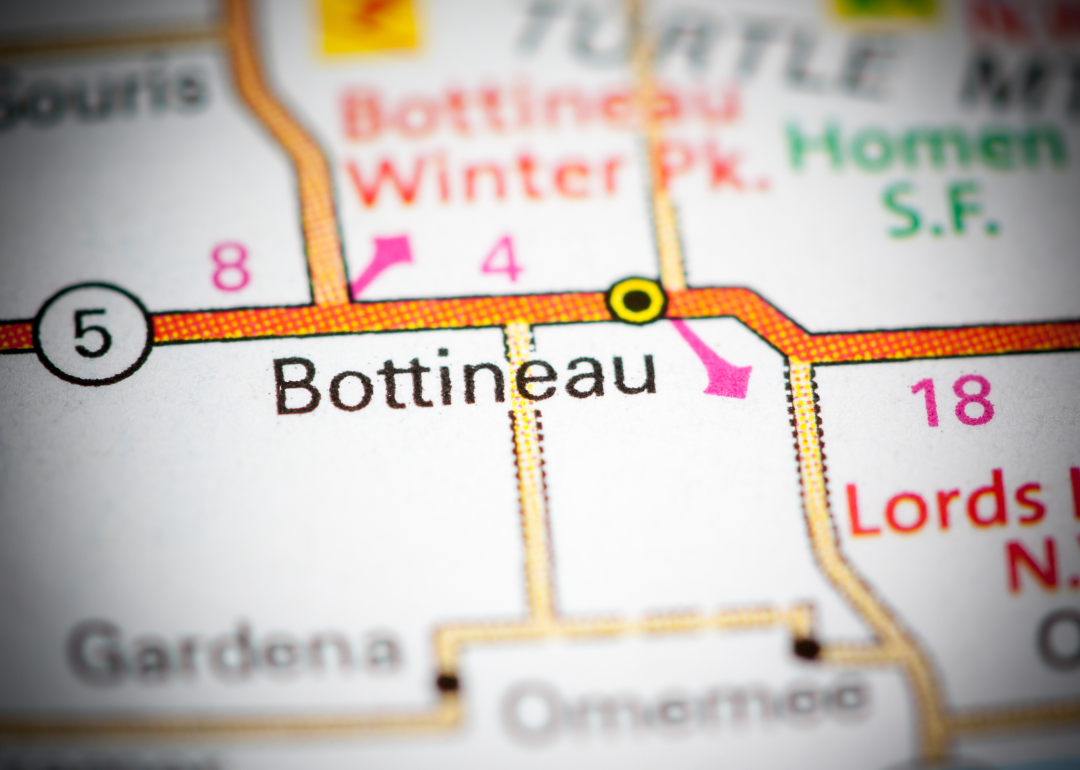
- Bridges in poor condition: 20.9% (28 of 134 bridges)
- Square meters of bridges in poor condition: 18.0% (3,220 of 17,894 square meters of bridges)
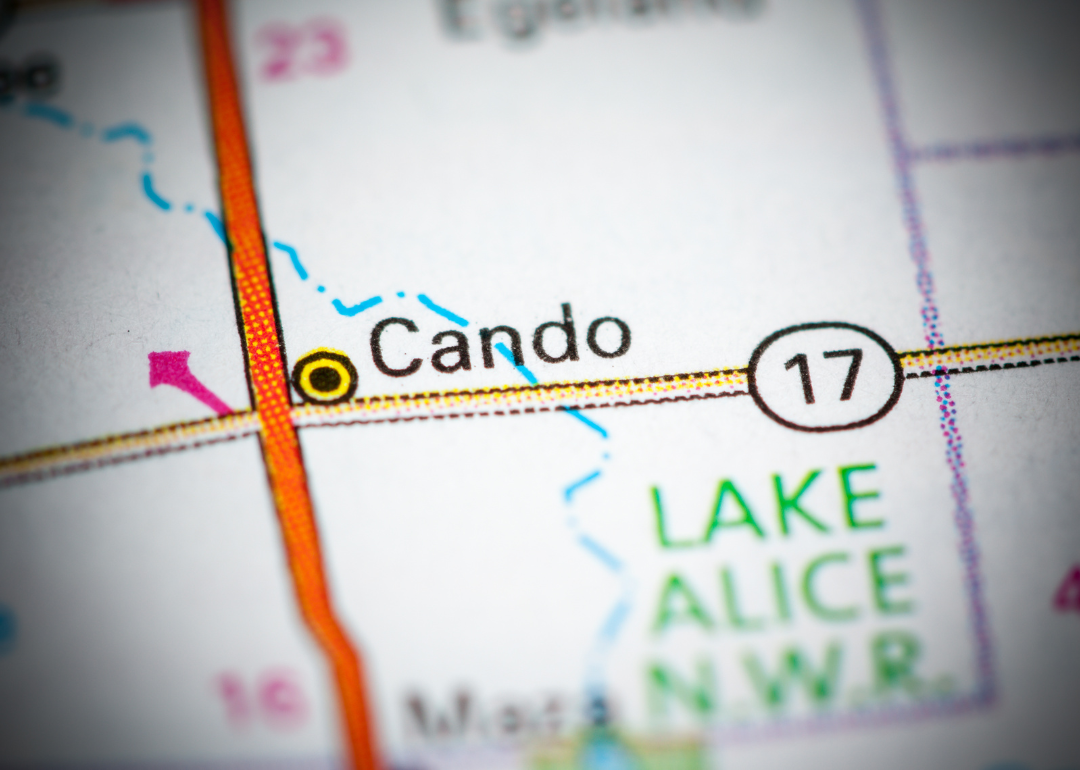
- Bridges in poor condition: 22.4% (13 of 58 bridges)
- Square meters of bridges in poor condition: 20.7% (1,092 of 5,285 square meters of bridges)

- Bridges in poor condition: 26.9% (18 of 67 bridges)
- Square meters of bridges in poor condition: 17.6% (1,053 of 5,988 square meters of bridges)
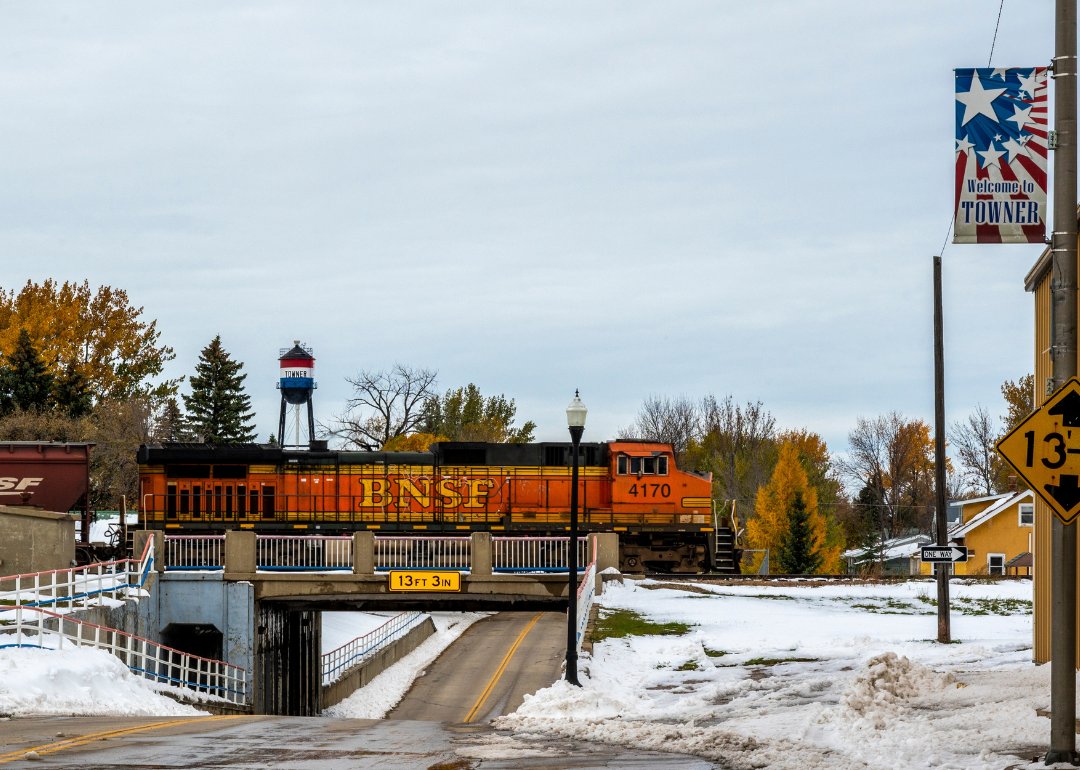
- Bridges in poor condition: 28.7% (31 of 108 bridges)
- Square meters of bridges in poor condition: 20.5% (2,956 of 14,405 square meters of bridges)
