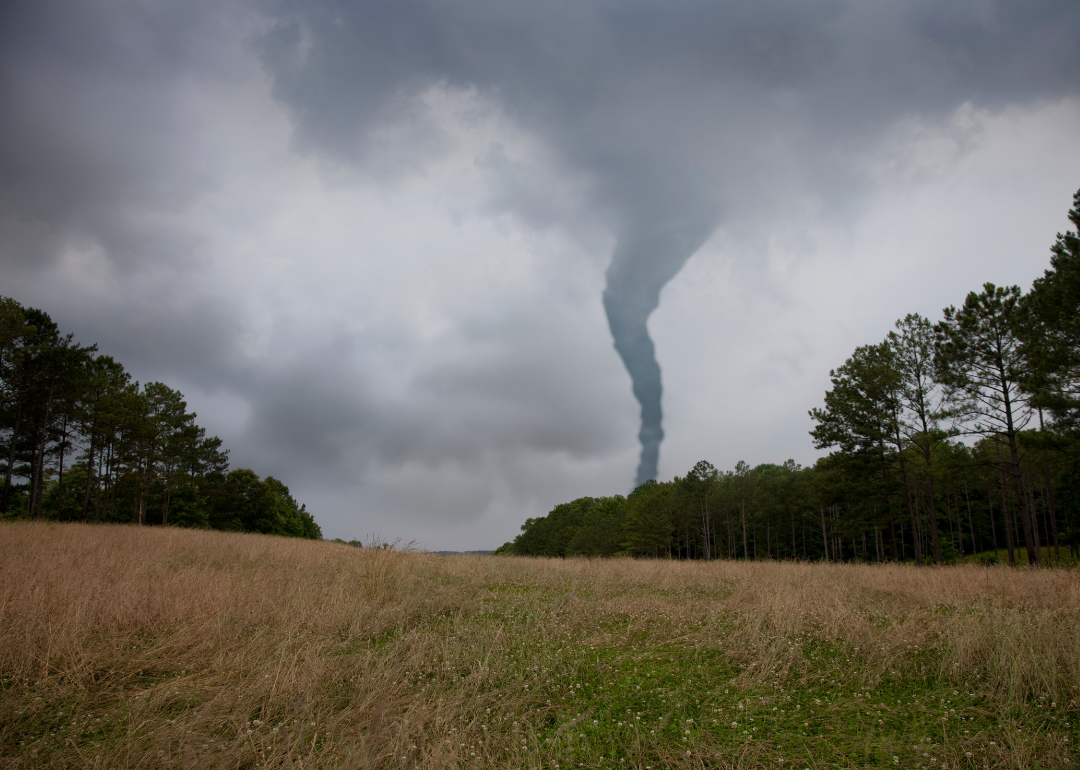
Counties with the most tornadoes in North Dakota
Stacker
Canva
- Tornadoes since 2000: 5 (0.24 per 100 square miles)
- #2,042 nationally
- Tornadoes this year, as of May 31: 0
- #2,042 nationally
- Tornadoes this year, as of May 31: 0
#47. Williams County
Kit Leong // Shutterstock
- Tornadoes since 2000: 5 (0.27 per 100 square miles)
- #2,035 nationally
- Tornadoes this year, as of May 31: 0
- #2,035 nationally
- Tornadoes this year, as of May 31: 0
#46. Mountrail County
Roadwardbound // Shutterstock
- Tornadoes since 2000: 6 (0.36 per 100 square miles)
- #2,014 nationally
- Tornadoes this year, as of May 31: 0
- #2,014 nationally
- Tornadoes this year, as of May 31: 0
#45. Grant County
northlight // Shutterstock
- Tornadoes since 2000: 5 (0.37 per 100 square miles)
- #2,009 nationally
- Tornadoes this year, as of May 31: 0
- #2,009 nationally
- Tornadoes this year, as of May 31: 0
#44. Kidder County
SevenMaps // Shutterstock
- Tornadoes since 2000: 5 (0.40 per 100 square miles)
- #2,000 nationally
- Tornadoes this year, as of May 31: 0
- #2,000 nationally
- Tornadoes this year, as of May 31: 0
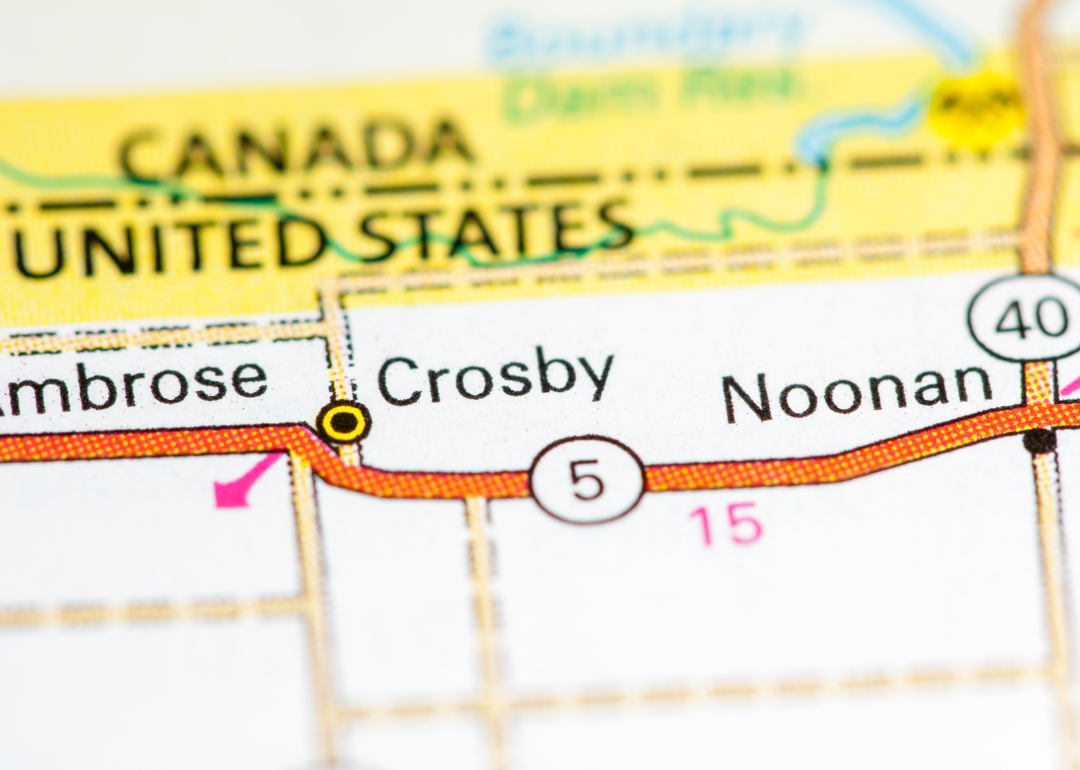
#43. Divide County
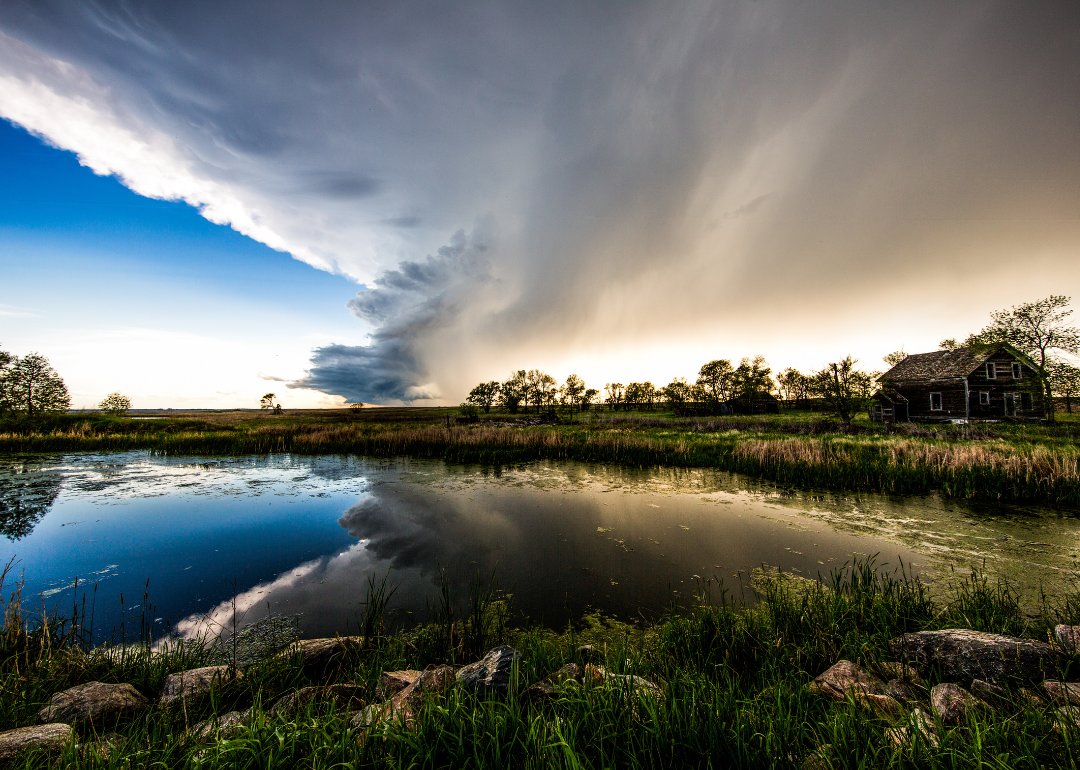
Cammie Czuchnicki // Shutterstock
- Tornadoes since 2000: 6 (0.40 per 100 square miles)
- #1,999 nationally
- Tornadoes this year, as of May 31: 0
- #1,999 nationally
- Tornadoes this year, as of May 31: 0
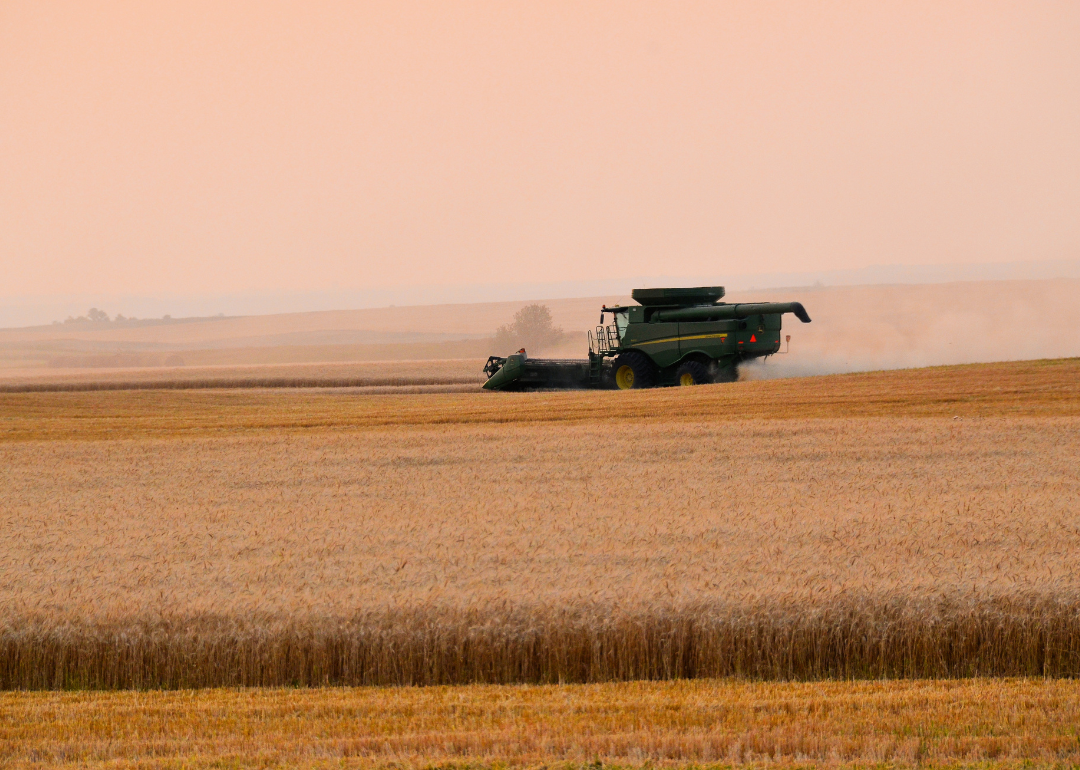
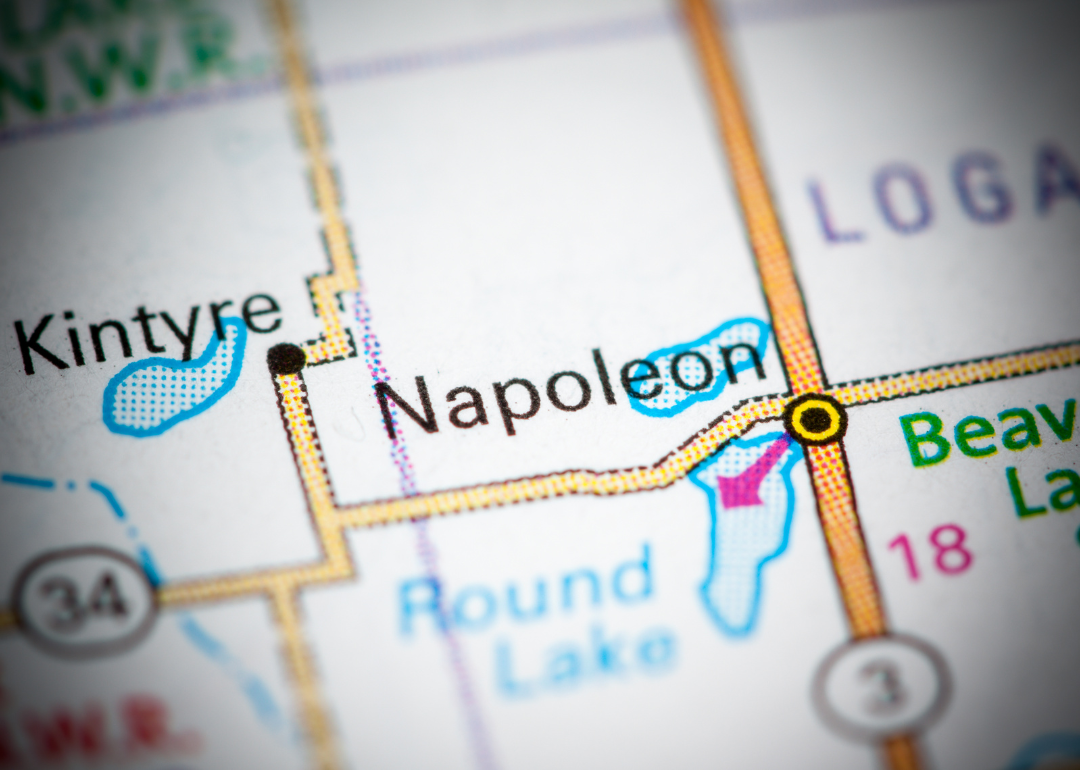
#42. Emmons County

Tanyarmorgan2436 // Shutterstock
- Tornadoes since 2000: 11 (0.40 per 100 square miles)
- #1,998 nationally
- Tornadoes this year, as of May 31: 0
- #1,998 nationally
- Tornadoes this year, as of May 31: 0
#41. McKenzie County
Logan Bush // Shutterstock
- Tornadoes since 2000: 5 (0.43 per 100 square miles)
- #1,992 nationally
- Tornadoes this year, as of May 31: 0
- #1,992 nationally
- Tornadoes this year, as of May 31: 0
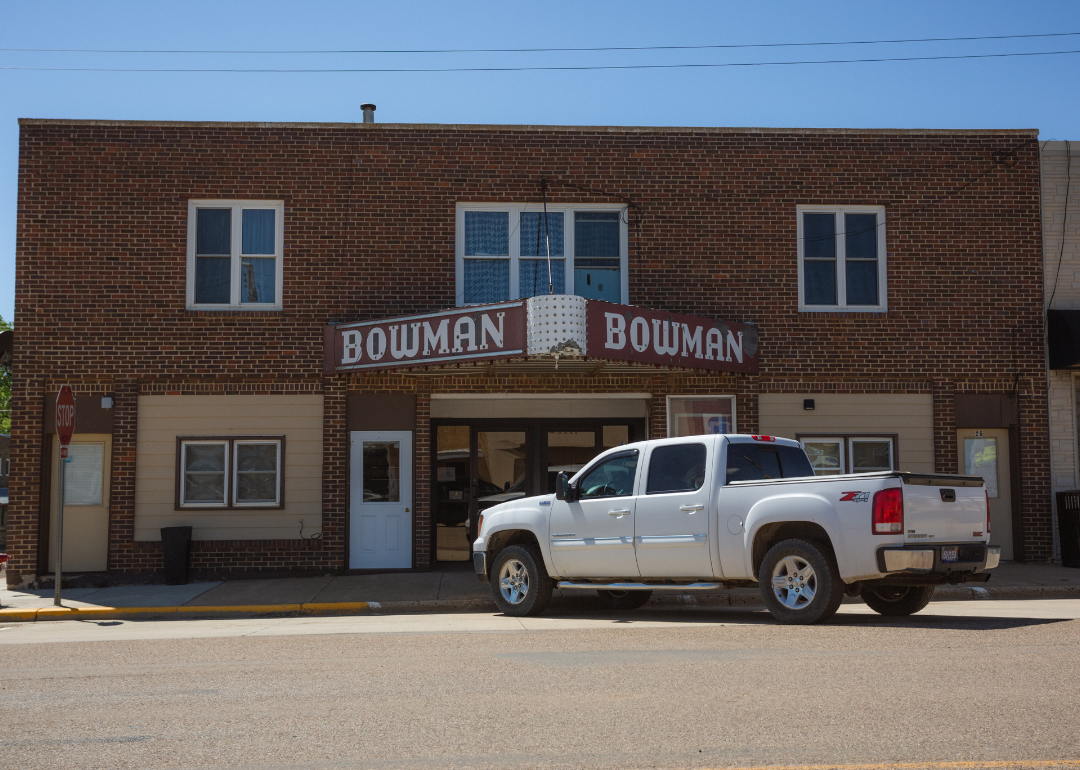
#40. Bowman County
Jacob Boomsma // Shutterstock
- Tornadoes since 2000: 10 (0.45 per 100 square miles)
- #1,990 nationally
- Tornadoes this year, as of May 31: 0
- #1,990 nationally
- Tornadoes this year, as of May 31: 0
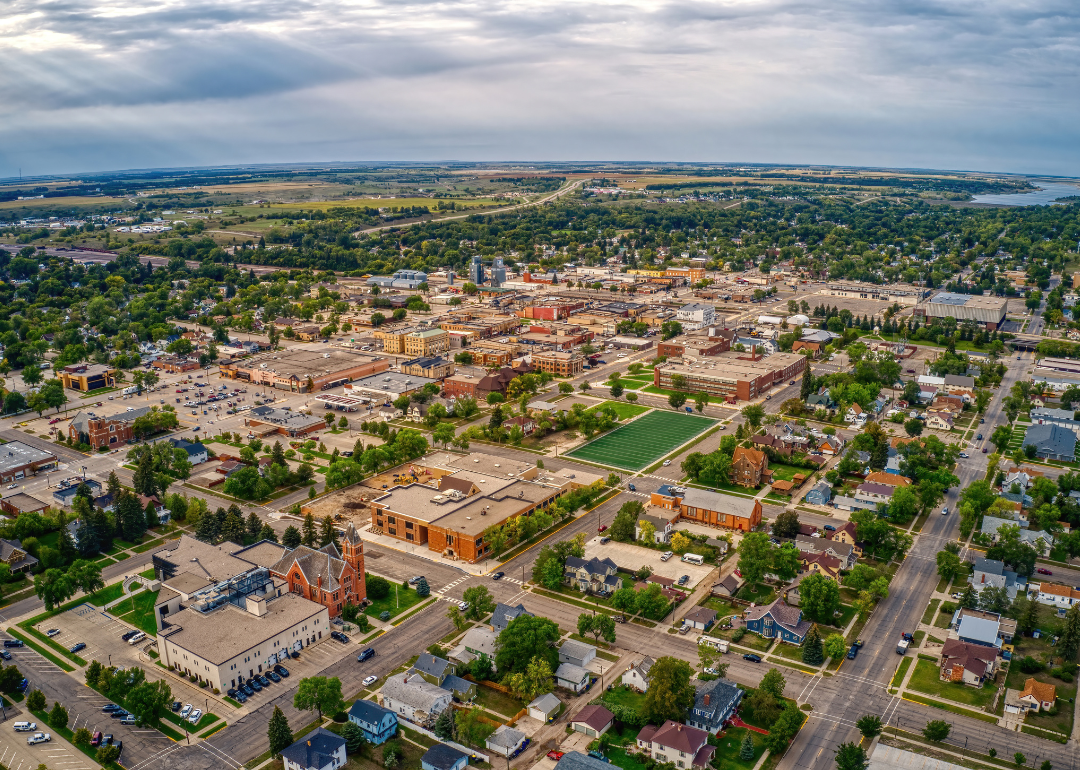
#39. Stutsman County
northlight // Shutterstock
- Tornadoes since 2000: 5 (0.48 per 100 square miles)
- #1,983 nationally
- Tornadoes this year, as of May 31: 0
- #1,983 nationally
- Tornadoes this year, as of May 31: 0
#38. Mercer County
Yosoyana // Shutterstock
- Tornadoes since 2000: 10 (0.50 per 100 square miles)
- #1,976 nationally
- Tornadoes this year, as of May 31: 0
- #1,976 nationally
- Tornadoes this year, as of May 31: 0
#37. Ward County
Traveller70 // Shutterstock
- Tornadoes since 2000: 10 (0.50 per 100 square miles)
- #1,975 nationally
- Tornadoes this year, as of May 31: 0
- #1,975 nationally
- Tornadoes this year, as of May 31: 0
#36. Dunn County
SevenMaps // Shutterstock
- Tornadoes since 2000: 5 (0.50 per 100 square miles)
- #1,973 nationally
- Tornadoes this year, as of May 31: 0
- #1,973 nationally
- Tornadoes this year, as of May 31: 0
#35. Logan County
Dirk Wierenga // Shutterstock
- Tornadoes since 2000: 10 (0.53 per 100 square miles)
- #1,964 nationally
- Tornadoes this year, as of May 31: 0
- #1,964 nationally
- Tornadoes this year, as of May 31: 0
#34. McHenry County

SevenMaps // Shutterstock
- Tornadoes since 2000: 7 (0.55 per 100 square miles)
- #1,960 nationally
- Tornadoes this year, as of May 31: 0
- #1,960 nationally
- Tornadoes this year, as of May 31: 0
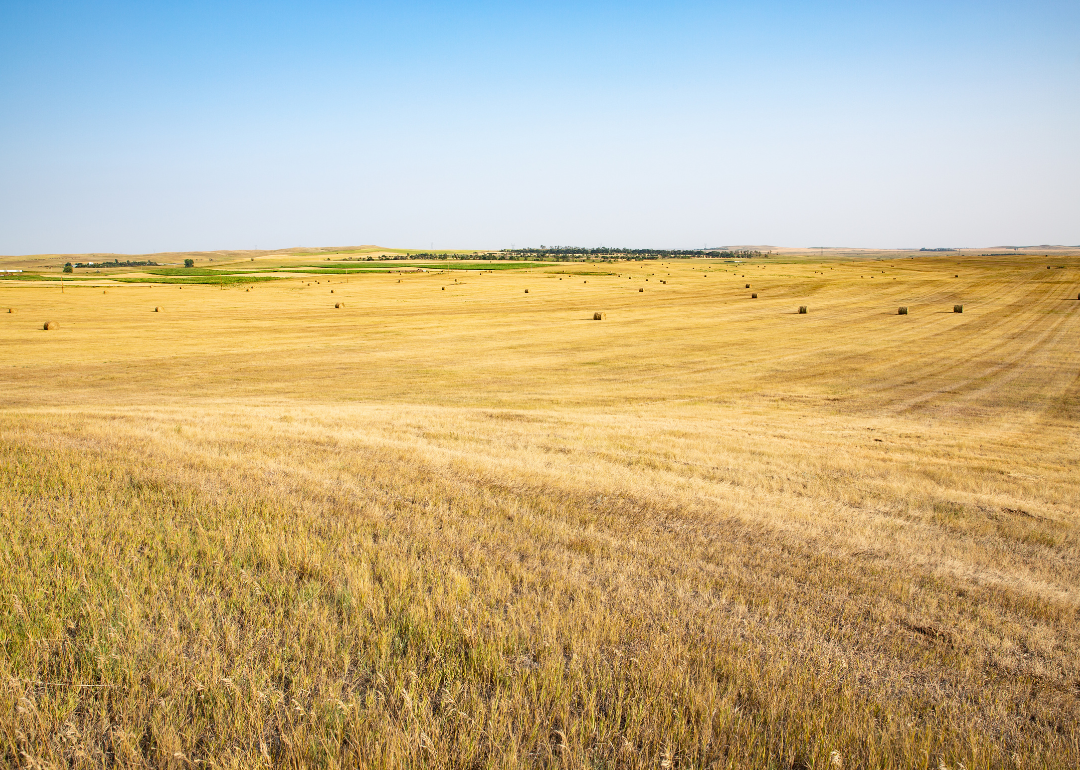
#33. Wells County
Canva
- Tornadoes since 2000: 6 (0.59 per 100 square miles)
- #1,949 nationally
- Tornadoes this year, as of May 31: 0
- #1,949 nationally
- Tornadoes this year, as of May 31: 0
#32. Pierce County
SevenMaps // Shutterstock
- Tornadoes since 2000: 10 (0.60 per 100 square miles)
- #1,946 nationally
- Tornadoes this year, as of May 31: 0
- #1,946 nationally
- Tornadoes this year, as of May 31: 0
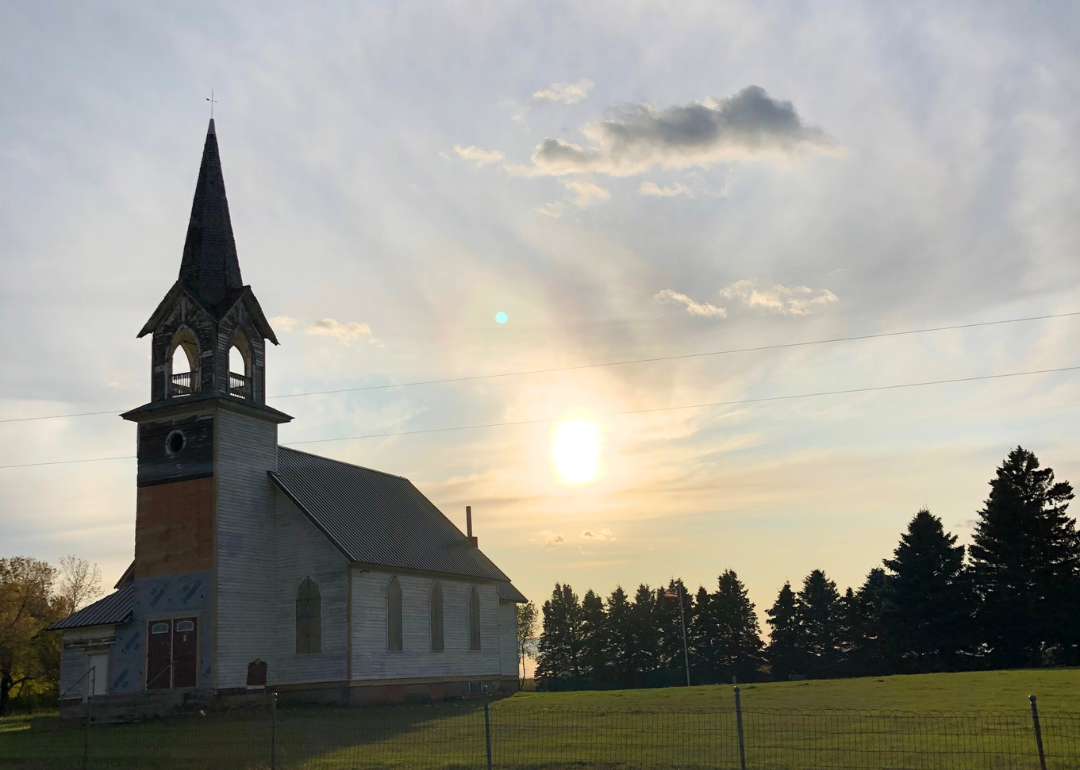
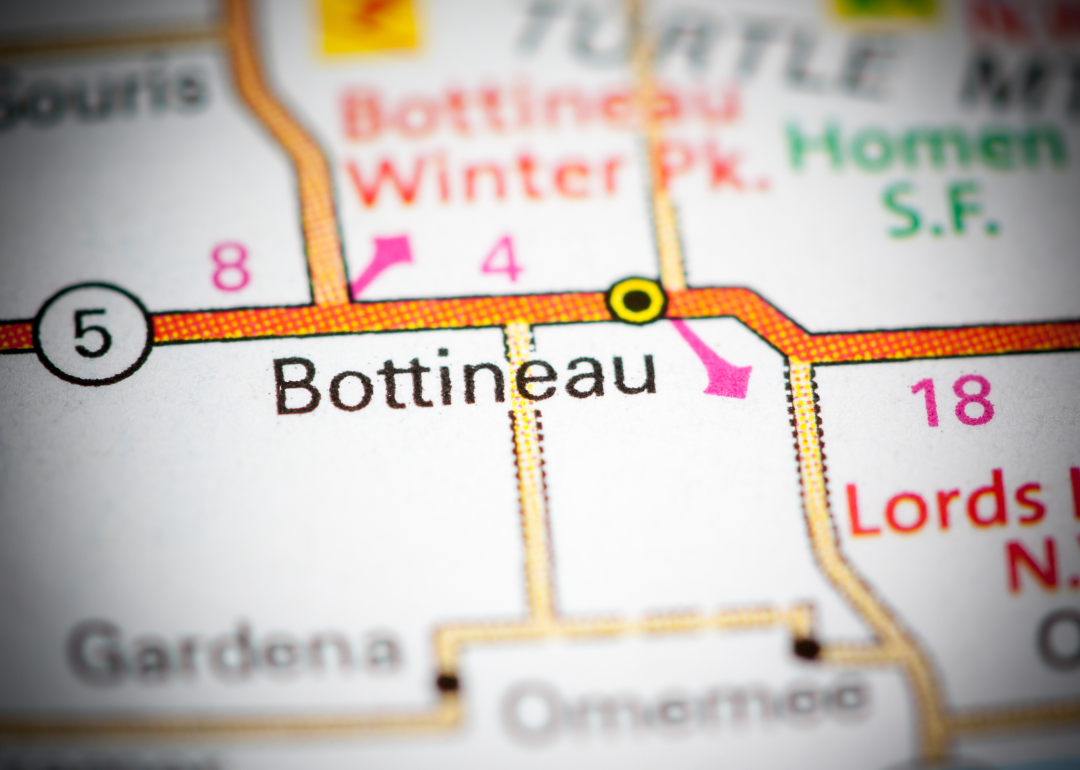
#31. Bottineau County
Joseph Sohm // Shutterstock
- Tornadoes since 2000: 7 (0.64 per 100 square miles)
- #1,932 nationally
- Tornadoes this year, as of May 31: 0
- #1,932 nationally
- Tornadoes this year, as of May 31: 0
#30. Sioux County

SevenMaps // Shutterstock
- Tornadoes since 2000: 5 (0.69 per 100 square miles)
- #1,919 nationally
- Tornadoes this year, as of May 31: 0
- #1,919 nationally
- Tornadoes this year, as of May 31: 0
#29. Oliver County
Joseph Sohm // Shutterstock
- Tornadoes since 2000: 12 (0.74 per 100 square miles)
- #1,904 nationally
- Tornadoes this year, as of May 31: 0
- #1,904 nationally
- Tornadoes this year, as of May 31: 0
#28. Burleigh County

SevenMaps // Shutterstock
- Tornadoes since 2000: 8 (0.82 per 100 square miles)
- #1,865 nationally
- Tornadoes this year, as of May 31: 0
- #1,865 nationally
- Tornadoes this year, as of May 31: 0
#27. McIntosh County
Cavan-Images // Shutterstock
- Tornadoes since 2000: 12 (0.90 per 100 square miles)
- #1,825 nationally
- Tornadoes this year, as of May 31: 0
- #1,825 nationally
- Tornadoes this year, as of May 31: 0
#26. Stark County
Smpalmero // Shutterstock
- Tornadoes since 2000: 19 (0.90 per 100 square miles)
- #1,824 nationally
- Tornadoes this year, as of May 31: 0
- #1,824 nationally
- Tornadoes this year, as of May 31: 0
#25. McLean County

SevenMaps // Shutterstock
- Tornadoes since 2000: 8 (0.91 per 100 square miles)
- #1,818 nationally
- Tornadoes this year, as of May 31: 0
- #1,818 nationally
- Tornadoes this year, as of May 31: 0
#24. Renville County
northlight // Shutterstock
- Tornadoes since 2000: 11 (0.97 per 100 square miles)
- #1,790 nationally
- Tornadoes this year, as of May 31: 0
- #1,790 nationally
- Tornadoes this year, as of May 31: 0
#23. Hettinger County
SevenMaps // Shutterstock
- Tornadoes since 2000: 9 (1.00 per 100 square miles)
- #1,776 nationally
- Tornadoes this year, as of May 31: 0
- #1,776 nationally
- Tornadoes this year, as of May 31: 0
#22. Rolette County

Danita Delimont // Shutterstock
- Tornadoes since 2000: 10 (1.16 per 100 square miles)
- #1,672 nationally
- Tornadoes this year, as of May 31: 0
- #1,672 nationally
- Tornadoes this year, as of May 31: 0
#21. Ransom County

SevenMaps // Shutterstock
- Tornadoes since 2000: 14 (1.22 per 100 square miles)
- #1,627 nationally
- Tornadoes this year, as of May 31: 0
- #1,627 nationally
- Tornadoes this year, as of May 31: 0
#20. LaMoure County

Michael Coddington // Shutterstock
- Tornadoes since 2000: 15 (1.26 per 100 square miles)
- #1,576 nationally
- Tornadoes this year, as of May 31: 0
- #1,576 nationally
- Tornadoes this year, as of May 31: 0
#19. Ramsey County
Charissa Enget // Shutterstock
- Tornadoes since 2000: 14 (1.27 per 100 square miles)
- #1,571 nationally
- Tornadoes this year, as of May 31: 0
- #1,571 nationally
- Tornadoes this year, as of May 31: 0
#18. Burke County
Bob Pool // Shutterstock
- Tornadoes since 2000: 25 (1.30 per 100 square miles)
- #1,554 nationally
- Tornadoes this year, as of May 31: 0
- #1,554 nationally
- Tornadoes this year, as of May 31: 0
#17. Morton County
Jacob Boomsma // Shutterstock
- Tornadoes since 2000: 15 (1.33 per 100 square miles)
- #1,538 nationally
- Tornadoes this year, as of May 31: 0
- #1,538 nationally
- Tornadoes this year, as of May 31: 0
#16. Dickey County
dedio // Shutterstock
- Tornadoes since 2000: 22 (1.48 per 100 square miles)
- #1,433 nationally
- Tornadoes this year, as of May 31: 0
- #1,433 nationally
- Tornadoes this year, as of May 31: 0
#15. Cavalier County
Zack Frank // Shutterstock
- Tornadoes since 2000: 10 (1.59 per 100 square miles)
- #1,365 nationally
- Tornadoes this year, as of May 31: 0
- #1,365 nationally
- Tornadoes this year, as of May 31: 0
#14. Eddy County
Canva
- Tornadoes since 2000: 24 (1.61 per 100 square miles)
- #1,346 nationally
- Tornadoes this year, as of May 31: 0
- #1,346 nationally
- Tornadoes this year, as of May 31: 0
#13. Barnes County
StompingGirl // Shutterstock
- Tornadoes since 2000: 16 (1.86 per 100 square miles)
- #1,155 nationally
- Tornadoes this year, as of May 31: 0
- #1,155 nationally
- Tornadoes this year, as of May 31: 0
#12. Sargent County

Canva
- Tornadoes since 2000: 27 (1.88 per 100 square miles)
- #1,140 nationally
- Tornadoes this year, as of May 31: 0
- #1,140 nationally
- Tornadoes this year, as of May 31: 0
#11. Richland County
SevenMaps // Shutterstock
- Tornadoes since 2000: 22 (2.15 per 100 square miles)
- #957 nationally
- Tornadoes this year, as of May 31: 0
- #957 nationally
- Tornadoes this year, as of May 31: 0
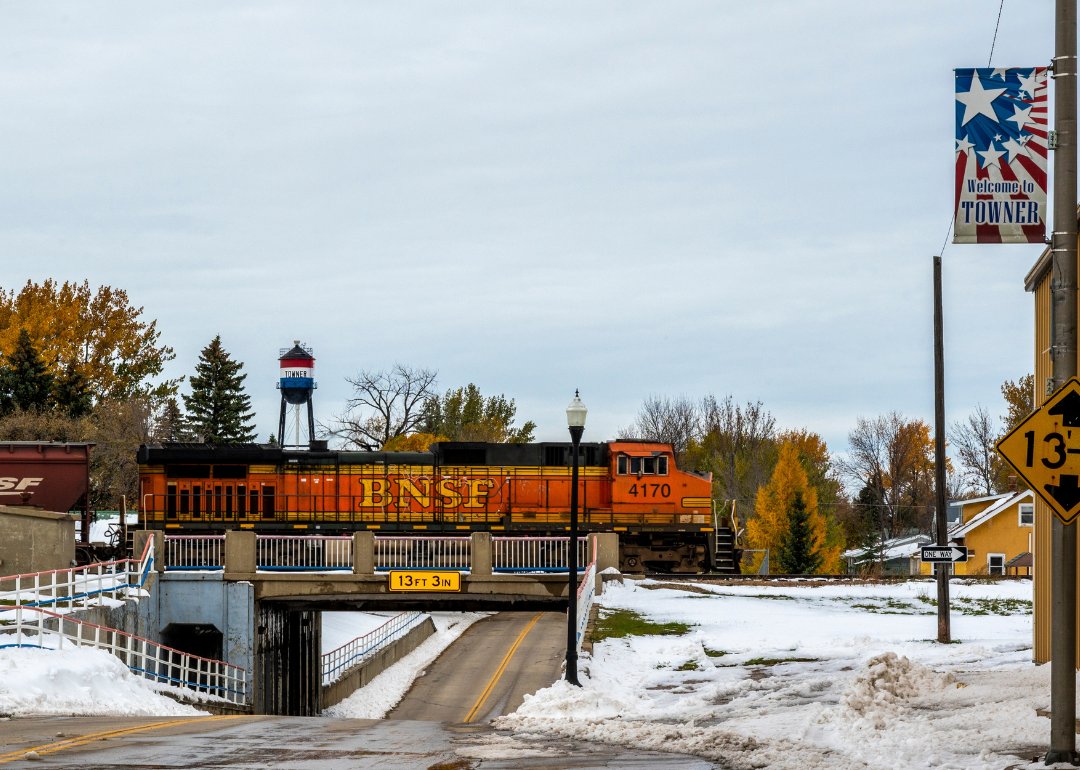
#10. Towner County
SevenMaps // Shutterstock
- Tornadoes since 2000: 30 (2.16 per 100 square miles)
- #951 nationally
- Tornadoes this year, as of May 31: 0
- #951 nationally
- Tornadoes this year, as of May 31: 0
#9. Benson County

Guy William // Shutterstock
- Tornadoes since 2000: 41 (2.32 per 100 square miles)
- #843 nationally
- Tornadoes this year, as of May 31: 0
- #843 nationally
- Tornadoes this year, as of May 31: 0
#8. Cass County
Canva
- Tornadoes since 2000: 31 (2.42 per 100 square miles)
- #774 nationally
- Tornadoes this year, as of May 31: 0
- #774 nationally
- Tornadoes this year, as of May 31: 0
#7. Walsh County

SevenMaps // Shutterstock
- Tornadoes since 2000: 22 (2.55 per 100 square miles)
- #702 nationally
- Tornadoes this year, as of May 31: 0
- #702 nationally
- Tornadoes this year, as of May 31: 0
#6. Traill County
Bob Pool // Shutterstock
- Tornadoes since 2000: 29 (2.59 per 100 square miles)
- #688 nationally
- Tornadoes this year, as of May 31: 0
- #688 nationally
- Tornadoes this year, as of May 31: 0
#5. Pembina County

SevenMaps // Shutterstock
- Tornadoes since 2000: 19 (2.68 per 100 square miles)
- #640 nationally
- Tornadoes this year, as of May 31: 0
- #640 nationally
- Tornadoes this year, as of May 31: 0
#4. Griggs County
Dirk Wierenga // Shutterstock
- Tornadoes since 2000: 27 (2.75 per 100 square miles)
- #610 nationally
- Tornadoes this year, as of May 31: 0
- #610 nationally
- Tornadoes this year, as of May 31: 0
#3. Nelson County
SevenMaps // Shutterstock
- Tornadoes since 2000: 24 (3.37 per 100 square miles)
- #362 nationally
- Tornadoes this year, as of May 31: 0
- #362 nationally
- Tornadoes this year, as of May 31: 0
#2. Steele County
Jacob Boomsma // Shutterstock
- Tornadoes since 2000: 63 (4.39 per 100 square miles)
- #172 nationally
- Tornadoes this year, as of May 31: 0
- #172 nationally
- Tornadoes this year, as of May 31: 0
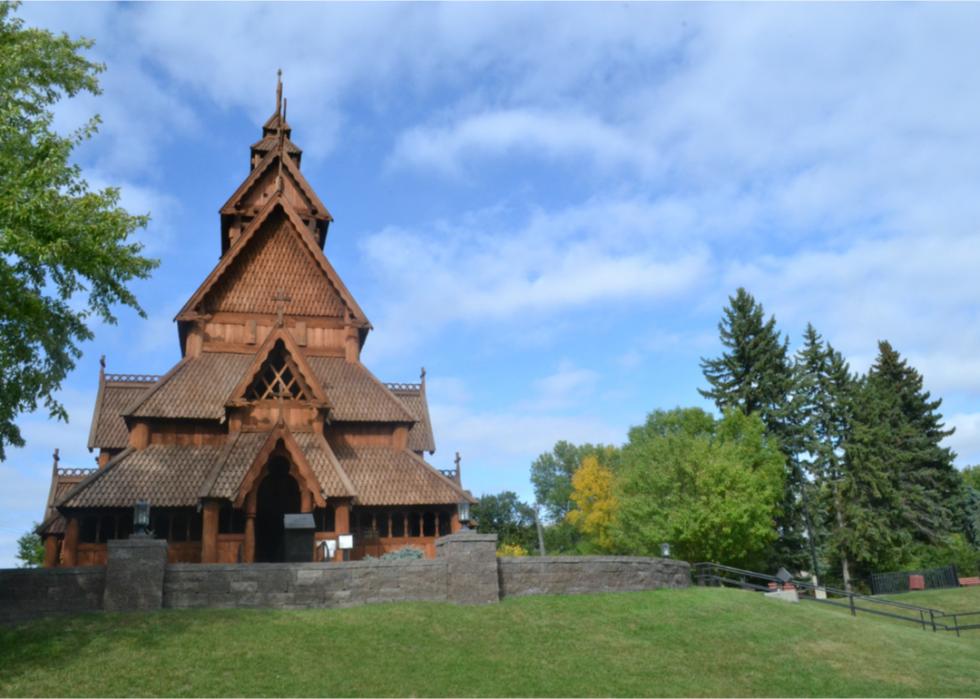
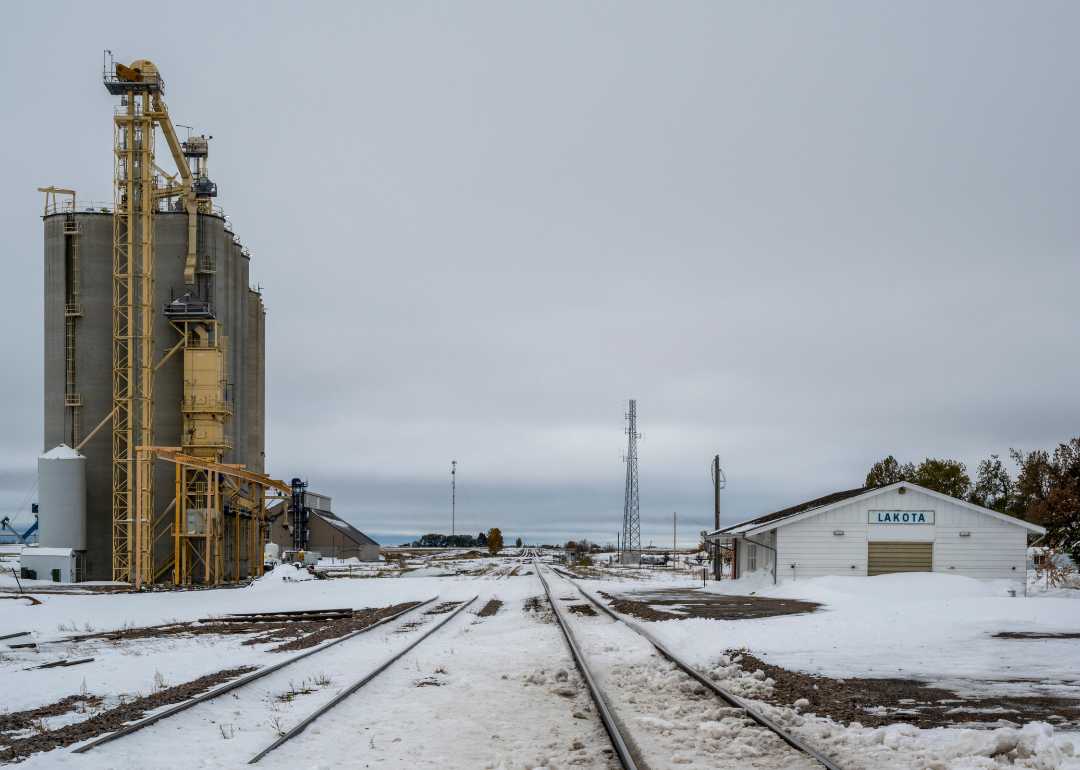
#1. Grand Forks County
Canva