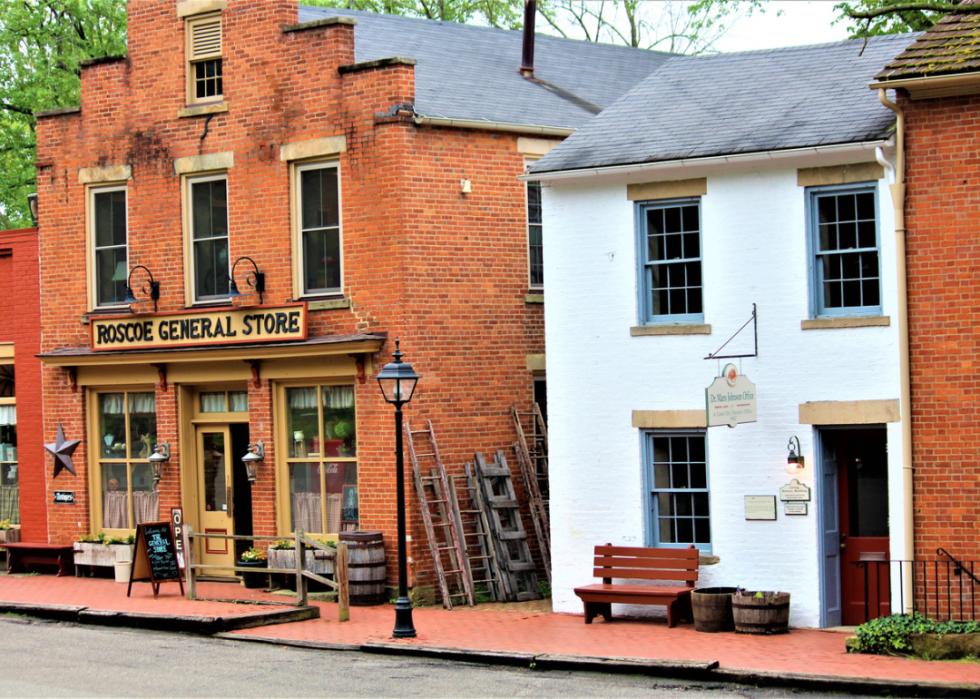
Counties with the highest rates of strokes in Ohio
JNix // Shutterstock
- Age-adjusted rate of all strokes among adults, estimates for 2021: 3.0% (range between 2.6% and 3.4%)
- Death rate for ischemic strokes, 2018-20: 17.3 per 100K people
- Death rate for hemorrhagic strokes, 2018-20: 10.0 per 100K people
- Death rate for ischemic strokes, 2018-20: 17.3 per 100K people
- Death rate for hemorrhagic strokes, 2018-20: 10.0 per 100K people
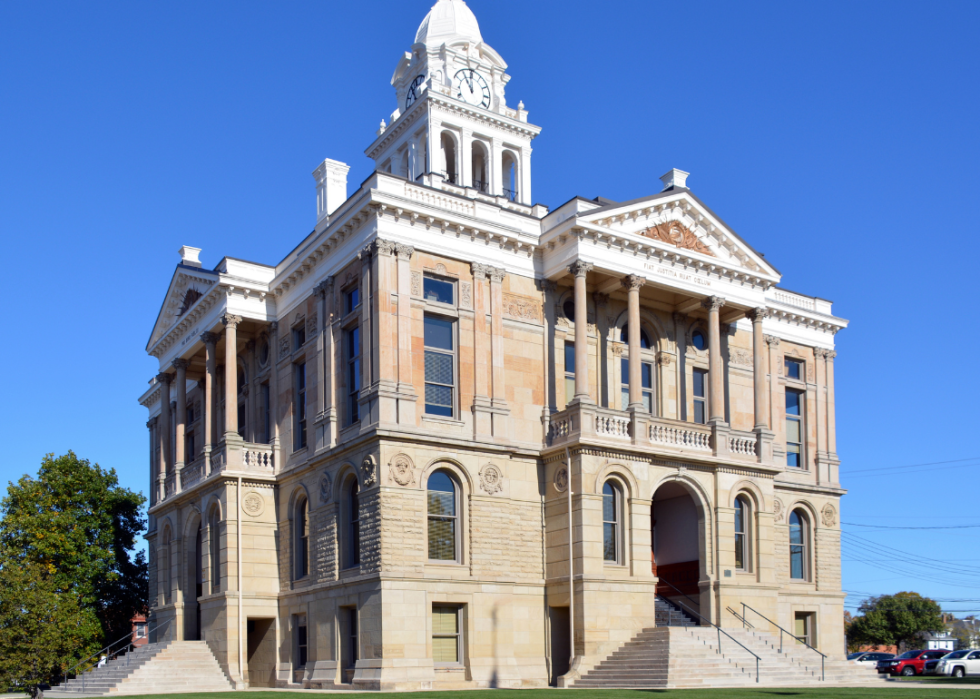
#50. Pickaway County
BLAZE Pro // Shutterstock
- Age-adjusted rate of all strokes among adults, estimates for 2021: 3.0% (range between 2.6% and 3.4%)
- Death rate for ischemic strokes, 2018-20: 18.1 per 100K people
- Death rate for hemorrhagic strokes, 2018-20: 9.0 per 100K people
- Death rate for ischemic strokes, 2018-20: 18.1 per 100K people
- Death rate for hemorrhagic strokes, 2018-20: 9.0 per 100K people
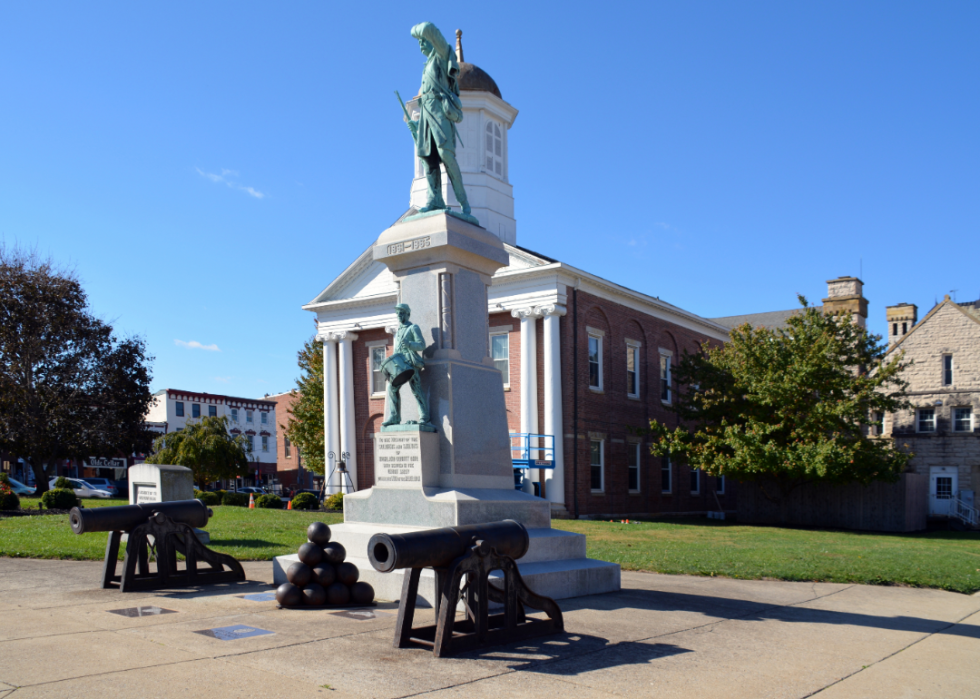
#49. Stark County
BLAZE Pro // Shutterstock
- Age-adjusted rate of all strokes among adults, estimates for 2021: 3.0% (range between 2.7% and 3.5%)
- Death rate for ischemic strokes, 2018-20: 18.4 per 100K people
- Death rate for hemorrhagic strokes, 2018-20: 9.4 per 100K people
- Death rate for ischemic strokes, 2018-20: 18.4 per 100K people
- Death rate for hemorrhagic strokes, 2018-20: 9.4 per 100K people
#48. Tuscarawas County

Canva
- Age-adjusted rate of all strokes among adults, estimates for 2021: 3.0% (range between 2.6% and 3.4%)
- Death rate for ischemic strokes, 2018-20: 19.2 per 100K people
- Death rate for hemorrhagic strokes, 2018-20: 9.7 per 100K people
- Death rate for ischemic strokes, 2018-20: 19.2 per 100K people
- Death rate for hemorrhagic strokes, 2018-20: 9.7 per 100K people
#47. Shelby County

Aiwilliams // Shutterstock
- Age-adjusted rate of all strokes among adults, estimates for 2021: 3.0% (range between 2.6% and 3.4%)
- Death rate for ischemic strokes, 2018-20: 19.3 per 100K people
- Death rate for hemorrhagic strokes, 2018-20: 8.8 per 100K people
- Death rate for ischemic strokes, 2018-20: 19.3 per 100K people
- Death rate for hemorrhagic strokes, 2018-20: 8.8 per 100K people
You may also like: Counties with the lowest home prices in Ohio
#46. Carroll County

Canva
- Age-adjusted rate of all strokes among adults, estimates for 2021: 3.0% (range between 2.6% and 3.3%)
- Death rate for ischemic strokes, 2018-20: 19.7 per 100K people
- Death rate for hemorrhagic strokes, 2018-20: 12.3 per 100K people
- Death rate for ischemic strokes, 2018-20: 19.7 per 100K people
- Death rate for hemorrhagic strokes, 2018-20: 12.3 per 100K people
#45. Seneca County
JNix // Shutterstock
- Age-adjusted rate of all strokes among adults, estimates for 2021: 3.0% (range between 2.6% and 3.5%)
- Death rate for ischemic strokes, 2018-20: 20.3 per 100K people
- Death rate for hemorrhagic strokes, 2018-20: 9.6 per 100K people
- Death rate for ischemic strokes, 2018-20: 20.3 per 100K people
- Death rate for hemorrhagic strokes, 2018-20: 9.6 per 100K people
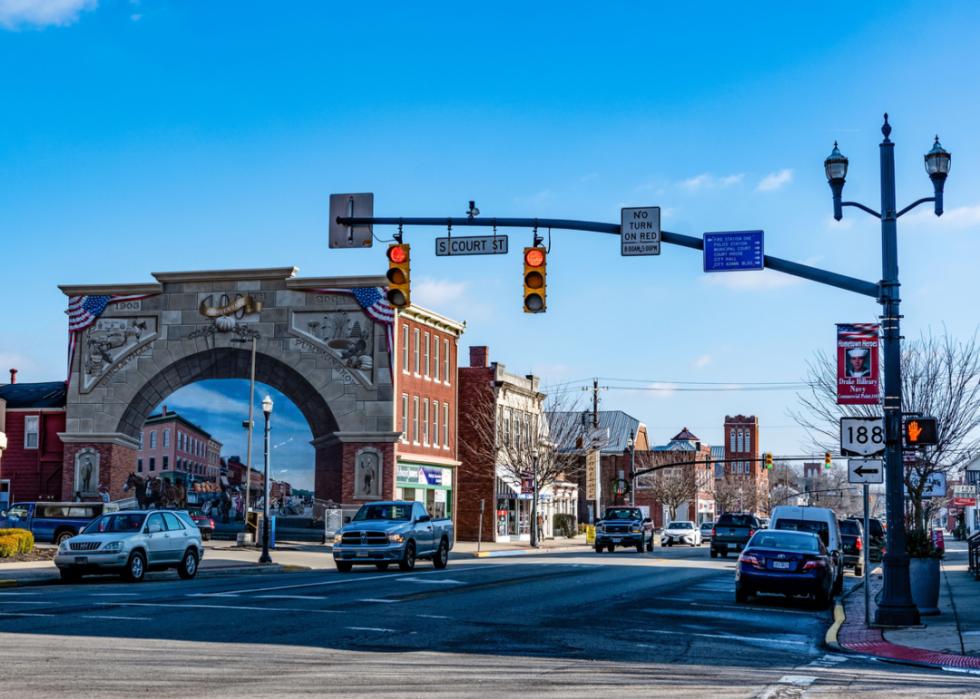
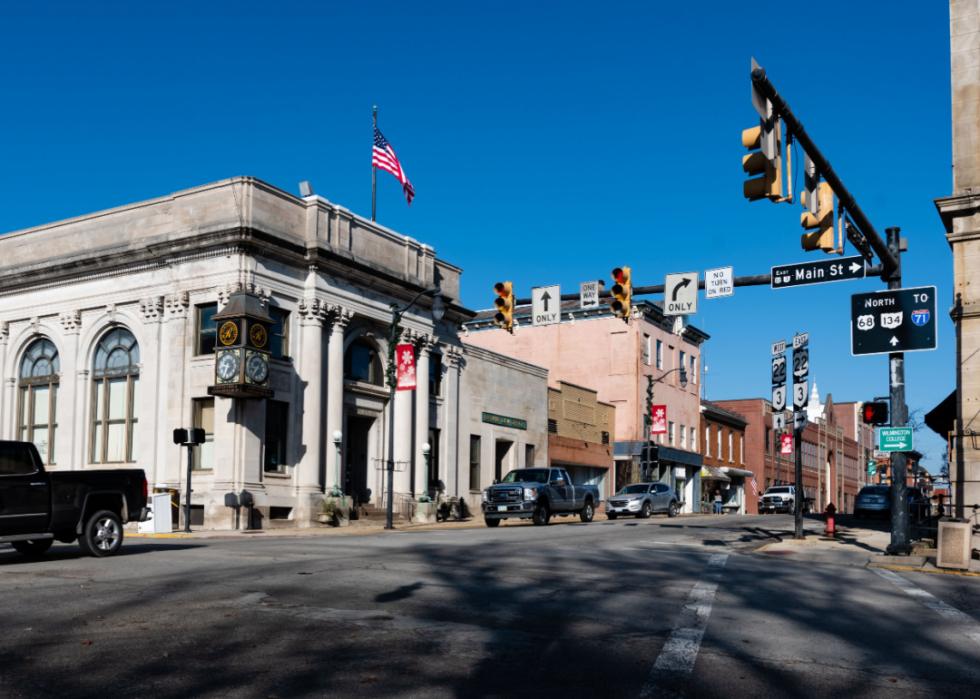
#44. Clinton County
Henryk Sadura // Shutterstock
- Age-adjusted rate of all strokes among adults, estimates for 2021: 3.0% (range between 2.6% and 3.4%)
- Death rate for ischemic strokes, 2018-20: 20.4 per 100K people
- Death rate for hemorrhagic strokes, 2018-20: 11.7 per 100K people
- Death rate for ischemic strokes, 2018-20: 20.4 per 100K people
- Death rate for hemorrhagic strokes, 2018-20: 11.7 per 100K people
#43. Sandusky County
Canva
- Age-adjusted rate of all strokes among adults, estimates for 2021: 3.0% (range between 2.6% and 3.4%)
- Death rate for ischemic strokes, 2018-20: 20.6 per 100K people
- Death rate for hemorrhagic strokes, 2018-20: 10.4 per 100K people
- Death rate for ischemic strokes, 2018-20: 20.6 per 100K people
- Death rate for hemorrhagic strokes, 2018-20: 10.4 per 100K people
#42. Darke County
photo.ua // Shutterstock
- Age-adjusted rate of all strokes among adults, estimates for 2021: 3.0% (range between 2.7% and 3.4%)
- Death rate for ischemic strokes, 2018-20: 20.8 per 100K people
- Death rate for hemorrhagic strokes, 2018-20: 10.3 per 100K people
- Death rate for ischemic strokes, 2018-20: 20.8 per 100K people
- Death rate for hemorrhagic strokes, 2018-20: 10.3 per 100K people
You may also like: Counties with the most veterans in Ohio
#41. Hamilton County

Anne Kitzman // Shutterstock
- Age-adjusted rate of all strokes among adults, estimates for 2021: 3.0% (range between 2.6% and 3.4%)
- Death rate for ischemic strokes, 2018-20: 20.9 per 100K people
- Death rate for hemorrhagic strokes, 2018-20: 9.9 per 100K people
- Death rate for ischemic strokes, 2018-20: 20.9 per 100K people
- Death rate for hemorrhagic strokes, 2018-20: 9.9 per 100K people
#40. Paulding County
Keith J Finks // Shutterstock
- Age-adjusted rate of all strokes among adults, estimates for 2021: 3.0% (range between 2.7% and 3.4%)
- Death rate for ischemic strokes, 2018-20: 23.1 per 100K people
- Death rate for hemorrhagic strokes, 2018-20: 11.1 per 100K people
- Death rate for ischemic strokes, 2018-20: 23.1 per 100K people
- Death rate for hemorrhagic strokes, 2018-20: 11.1 per 100K people
#39. Huron County
Canva
- Age-adjusted rate of all strokes among adults, estimates for 2021: 3.0% (range between 2.6% and 3.4%)
- Death rate for ischemic strokes, 2018-20: 24.0 per 100K people
- Death rate for hemorrhagic strokes, 2018-20: 9.6 per 100K people
- Death rate for ischemic strokes, 2018-20: 24.0 per 100K people
- Death rate for hemorrhagic strokes, 2018-20: 9.6 per 100K people
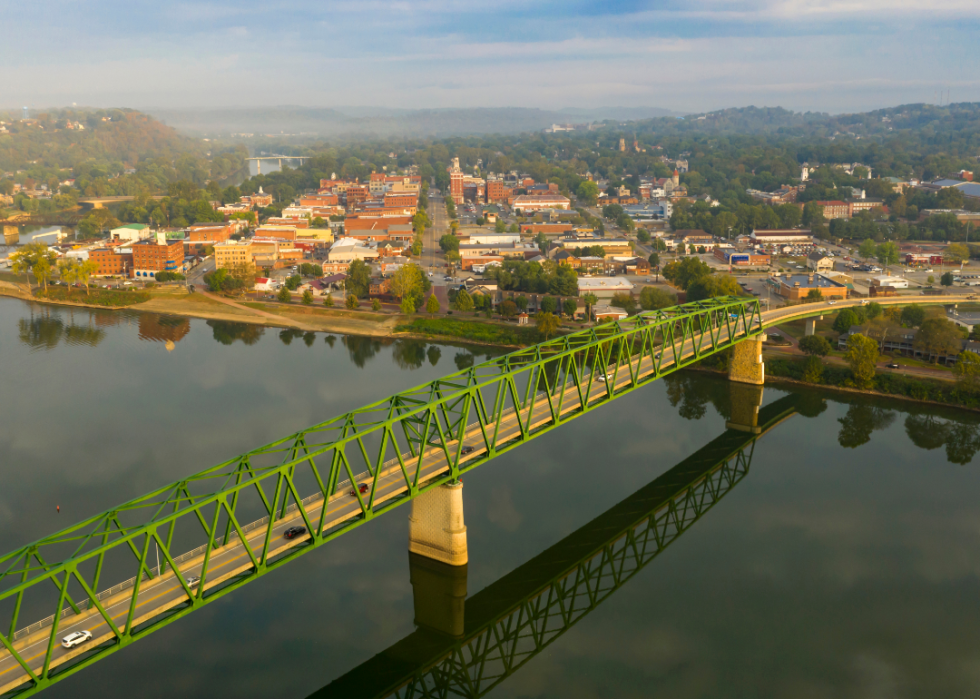
#38. Washington County
JNix // Shutterstock
- Age-adjusted rate of all strokes among adults, estimates for 2021: 3.1% (range between 2.8% and 3.6%)
- Death rate for ischemic strokes, 2018-20: 12.9 per 100K people
- Death rate for hemorrhagic strokes, 2018-20: 9.3 per 100K people
- Death rate for ischemic strokes, 2018-20: 12.9 per 100K people
- Death rate for hemorrhagic strokes, 2018-20: 9.3 per 100K people
#37. Perry County
Canva
- Age-adjusted rate of all strokes among adults, estimates for 2021: 3.1% (range between 2.7% and 3.5%)
- Death rate for ischemic strokes, 2018-20: 13.9 per 100K people
- Death rate for hemorrhagic strokes, 2018-20: 9.4 per 100K people
- Death rate for ischemic strokes, 2018-20: 13.9 per 100K people
- Death rate for hemorrhagic strokes, 2018-20: 9.4 per 100K people
You may also like: Counties with highest COVID-19 infection rates in Ohio
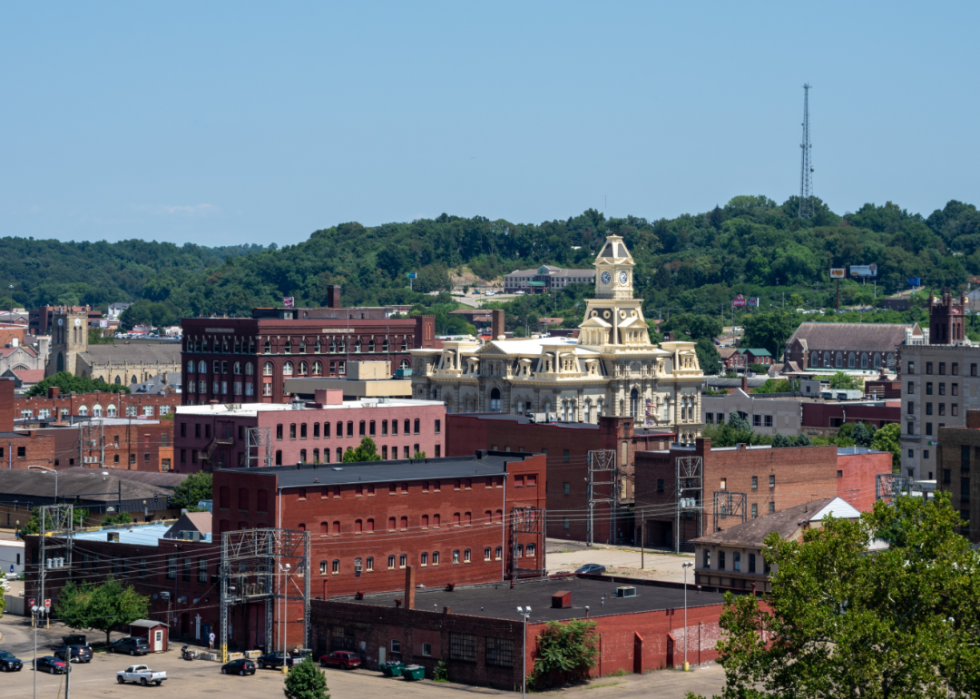
#36. Muskingum County
JNix // Shutterstock
- Age-adjusted rate of all strokes among adults, estimates for 2021: 3.1% (range between 2.7% and 3.6%)
- Death rate for ischemic strokes, 2018-20: 17.3 per 100K people
- Death rate for hemorrhagic strokes, 2018-20: 8.9 per 100K people
- Death rate for ischemic strokes, 2018-20: 17.3 per 100K people
- Death rate for hemorrhagic strokes, 2018-20: 8.9 per 100K people
#35. Harrison County
Canva
- Age-adjusted rate of all strokes among adults, estimates for 2021: 3.1% (range between 2.8% and 3.6%)
- Death rate for ischemic strokes, 2018-20: 18.2 per 100K people
- Death rate for hemorrhagic strokes, 2018-20: 9.3 per 100K people
- Death rate for ischemic strokes, 2018-20: 18.2 per 100K people
- Death rate for hemorrhagic strokes, 2018-20: 9.3 per 100K people
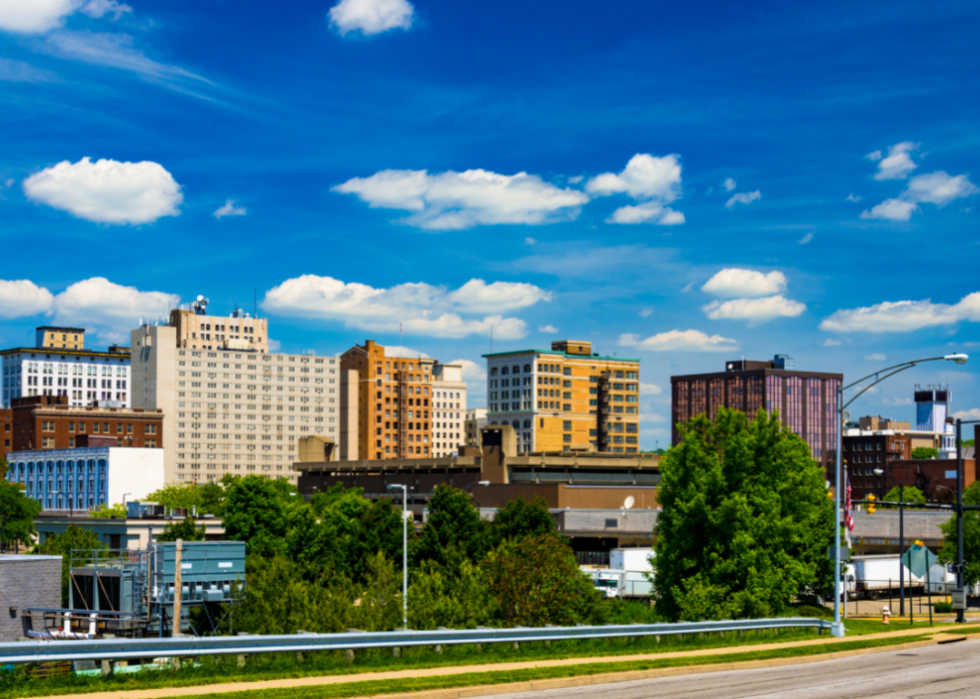
#34. Mahoning County
JNix // Shutterstock
- Age-adjusted rate of all strokes among adults, estimates for 2021: 3.1% (range between 2.7% and 3.5%)
- Death rate for ischemic strokes, 2018-20: 18.9 per 100K people
- Death rate for hemorrhagic strokes, 2018-20: 9.2 per 100K people
- Death rate for ischemic strokes, 2018-20: 18.9 per 100K people
- Death rate for hemorrhagic strokes, 2018-20: 9.2 per 100K people
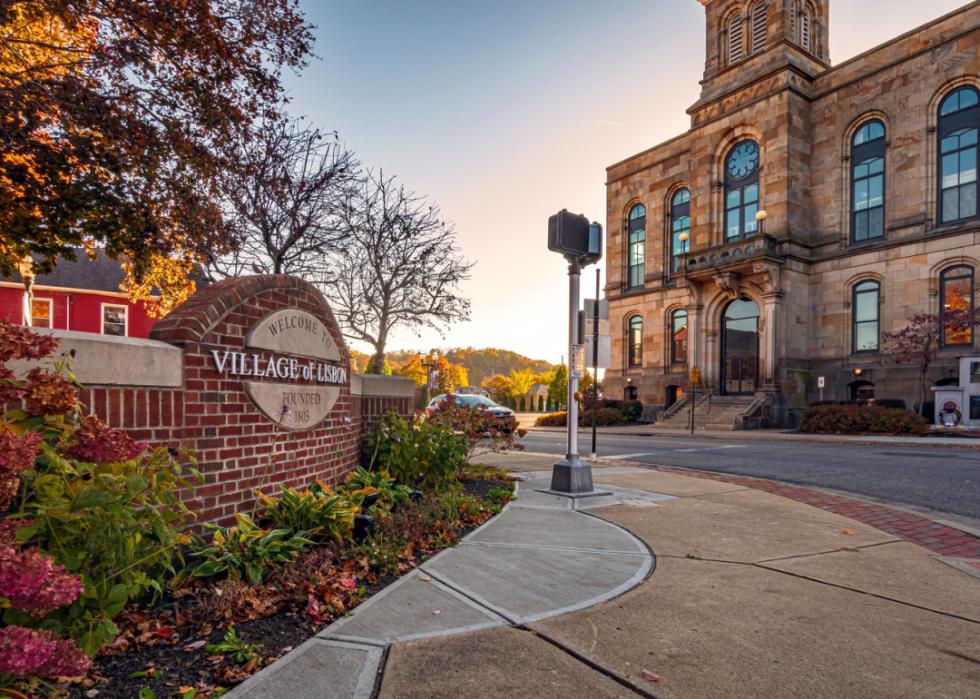
#33. Columbiana County

Canva
- Age-adjusted rate of all strokes among adults, estimates for 2021: 3.1% (range between 2.7% and 3.5%)
- Death rate for ischemic strokes, 2018-20: 19.7 per 100K people
- Death rate for hemorrhagic strokes, 2018-20: 8.2 per 100K people
- Death rate for ischemic strokes, 2018-20: 19.7 per 100K people
- Death rate for hemorrhagic strokes, 2018-20: 8.2 per 100K people
#32. Hardin County
Canva
- Age-adjusted rate of all strokes among adults, estimates for 2021: 3.1% (range between 2.8% and 3.6%)
- Death rate for ischemic strokes, 2018-20: 20.6 per 100K people
- Death rate for hemorrhagic strokes, 2018-20: 9.6 per 100K people
- Death rate for ischemic strokes, 2018-20: 20.6 per 100K people
- Death rate for hemorrhagic strokes, 2018-20: 9.6 per 100K people
You may also like: Recipes from Ohio
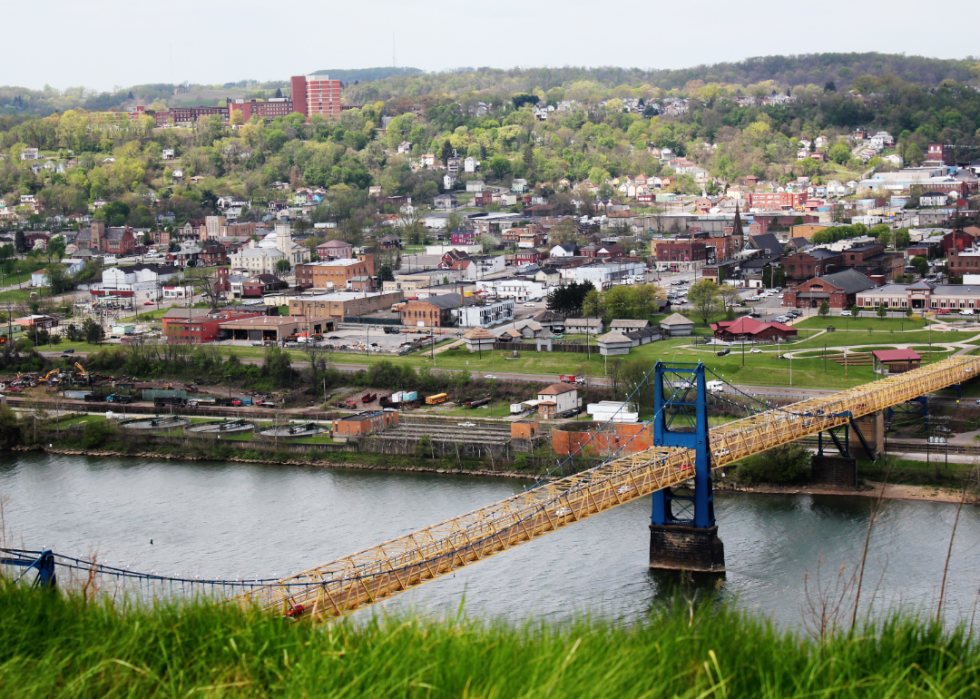
#31. Jefferson County
Bravo Charlie Productions // Shutterstock
- Age-adjusted rate of all strokes among adults, estimates for 2021: 3.1% (range between 2.8% and 3.5%)
- Death rate for ischemic strokes, 2018-20: 21.3 per 100K people
- Death rate for hemorrhagic strokes, 2018-20: 8.5 per 100K people
- Death rate for ischemic strokes, 2018-20: 21.3 per 100K people
- Death rate for hemorrhagic strokes, 2018-20: 8.5 per 100K people
#30. Allen County

Canva
- Age-adjusted rate of all strokes among adults, estimates for 2021: 3.1% (range between 2.7% and 3.5%)
- Death rate for ischemic strokes, 2018-20: 21.7 per 100K people
- Death rate for hemorrhagic strokes, 2018-20: 9.5 per 100K people
- Death rate for ischemic strokes, 2018-20: 21.7 per 100K people
- Death rate for hemorrhagic strokes, 2018-20: 9.5 per 100K people
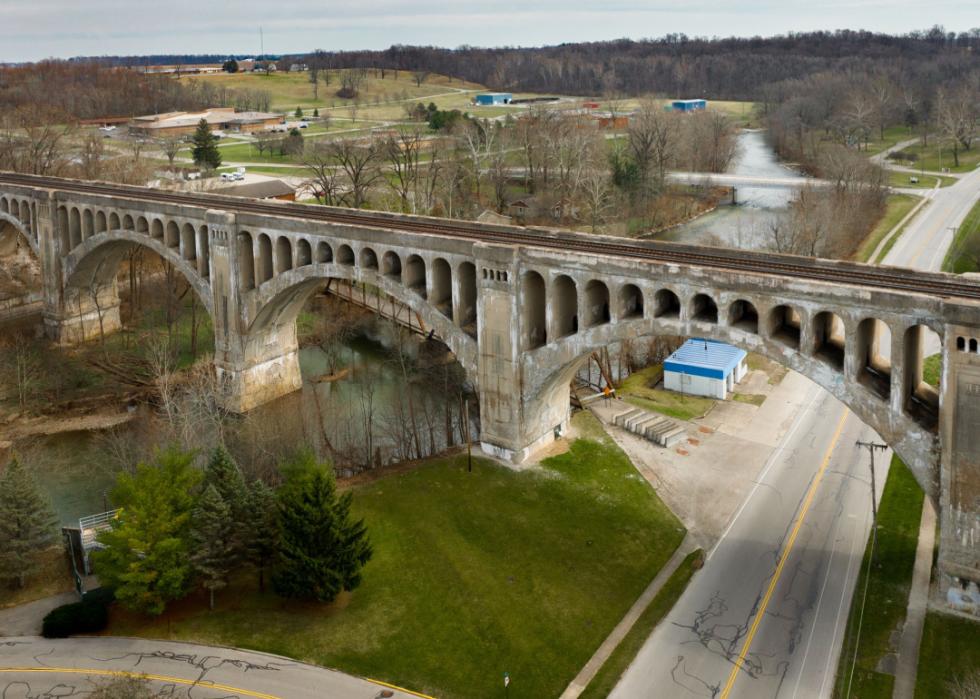
#29. Crawford County

Canva
- Age-adjusted rate of all strokes among adults, estimates for 2021: 3.2% (range between 2.8% and 3.6%)
- Death rate for ischemic strokes, 2018-20: 16.1 per 100K people
- Death rate for hemorrhagic strokes, 2018-20: 8.9 per 100K people
- Death rate for ischemic strokes, 2018-20: 16.1 per 100K people
- Death rate for hemorrhagic strokes, 2018-20: 8.9 per 100K people
#28. Cuyahoga County

Michael Shake // Shutterstock
- Age-adjusted rate of all strokes among adults, estimates for 2021: 3.2% (range between 2.9% and 3.6%)
- Death rate for ischemic strokes, 2018-20: 19.0 per 100K people
- Death rate for hemorrhagic strokes, 2018-20: 8.8 per 100K people
- Death rate for ischemic strokes, 2018-20: 19.0 per 100K people
- Death rate for hemorrhagic strokes, 2018-20: 8.8 per 100K people
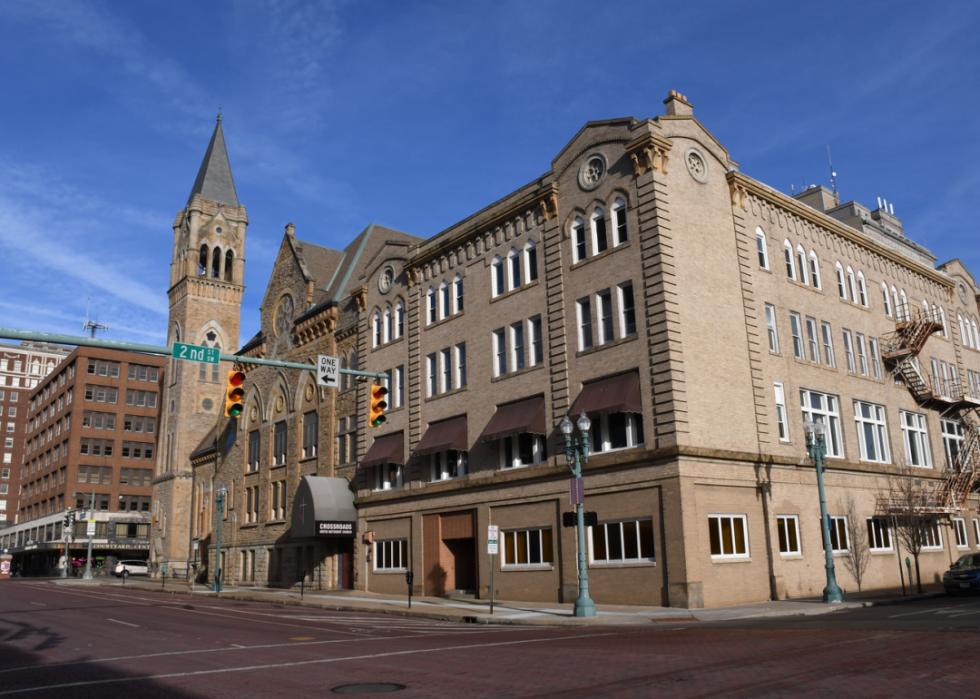
#27. Lucas County
Wendy van Overstreet // Shutterstock
- Age-adjusted rate of all strokes among adults, estimates for 2021: 3.2% (range between 2.8% and 3.6%)
- Death rate for ischemic strokes, 2018-20: 20.1 per 100K people
- Death rate for hemorrhagic strokes, 2018-20: 10.3 per 100K people
- Death rate for ischemic strokes, 2018-20: 20.1 per 100K people
- Death rate for hemorrhagic strokes, 2018-20: 10.3 per 100K people
You may also like: Counties with the most college graduates in Ohio
#26. Athens County

Canva
- Age-adjusted rate of all strokes among adults, estimates for 2021: 3.2% (range between 2.9% and 3.6%)
- Death rate for ischemic strokes, 2018-20: 20.5 per 100K people
- Death rate for hemorrhagic strokes, 2018-20: 9.0 per 100K people
- Death rate for ischemic strokes, 2018-20: 20.5 per 100K people
- Death rate for hemorrhagic strokes, 2018-20: 9.0 per 100K people
#25. Ross County
James Marciniak // Shutterstock
- Age-adjusted rate of all strokes among adults, estimates for 2021: 3.2% (range between 2.8% and 3.6%)
- Death rate for ischemic strokes, 2018-20: 22.2 per 100K people
- Death rate for hemorrhagic strokes, 2018-20: 9.8 per 100K people
- Death rate for ischemic strokes, 2018-20: 22.2 per 100K people
- Death rate for hemorrhagic strokes, 2018-20: 9.8 per 100K people
#24. Clark County

ADC Bradley // Shutterstock
- Age-adjusted rate of all strokes among adults, estimates for 2021: 3.2% (range between 2.8% and 3.6%)
- Death rate for ischemic strokes, 2018-20: 22.3 per 100K people
- Death rate for hemorrhagic strokes, 2018-20: 9.9 per 100K people
- Death rate for ischemic strokes, 2018-20: 22.3 per 100K people
- Death rate for hemorrhagic strokes, 2018-20: 9.9 per 100K people
#23. Brown County

Canva
- Age-adjusted rate of all strokes among adults, estimates for 2021: 3.2% (range between 2.8% and 3.6%)
- Death rate for ischemic strokes, 2018-20: 22.3 per 100K people
- Death rate for hemorrhagic strokes, 2018-20: 10.3 per 100K people
- Death rate for ischemic strokes, 2018-20: 22.3 per 100K people
- Death rate for hemorrhagic strokes, 2018-20: 10.3 per 100K people
#22. Montgomery County

Canva
- Age-adjusted rate of all strokes among adults, estimates for 2021: 3.2% (range between 2.8% and 3.6%)
- Death rate for ischemic strokes, 2018-20: 23.0 per 100K people
- Death rate for hemorrhagic strokes, 2018-20: 7.0 per 100K people
- Death rate for ischemic strokes, 2018-20: 23.0 per 100K people
- Death rate for hemorrhagic strokes, 2018-20: 7.0 per 100K people
You may also like: Counties with the oldest homes in Ohio
#21. Monroe County

Donna Wickerham // Shutterstock
- Age-adjusted rate of all strokes among adults, estimates for 2021: 3.2% (range between 2.8% and 3.7%)
- Death rate for ischemic strokes, 2018-20: 23.0 per 100K people
- Death rate for hemorrhagic strokes, 2018-20: 10.0 per 100K people
- Death rate for ischemic strokes, 2018-20: 23.0 per 100K people
- Death rate for hemorrhagic strokes, 2018-20: 10.0 per 100K people
#20. Richland County

arthurgphotography // Shutterstock
- Age-adjusted rate of all strokes among adults, estimates for 2021: 3.2% (range between 2.8% and 3.6%)
- Death rate for ischemic strokes, 2018-20: 23.9 per 100K people
- Death rate for hemorrhagic strokes, 2018-20: 8.8 per 100K people
- Death rate for ischemic strokes, 2018-20: 23.9 per 100K people
- Death rate for hemorrhagic strokes, 2018-20: 8.8 per 100K people
#19. Hocking County

Kenneth Keifer // Shutterstock
- Age-adjusted rate of all strokes among adults, estimates for 2021: 3.3% (range between 3.0% and 3.8%)
- Death rate for ischemic strokes, 2018-20: 14.1 per 100K people
- Death rate for hemorrhagic strokes, 2018-20: 9.0 per 100K people
- Death rate for ischemic strokes, 2018-20: 14.1 per 100K people
- Death rate for hemorrhagic strokes, 2018-20: 9.0 per 100K people
#18. Noble County
Canva
- Age-adjusted rate of all strokes among adults, estimates for 2021: 3.3% (range between 2.9% and 3.7%)
- Death rate for ischemic strokes, 2018-20: 15.6 per 100K people
- Death rate for hemorrhagic strokes, 2018-20: 9.6 per 100K people
- Death rate for ischemic strokes, 2018-20: 15.6 per 100K people
- Death rate for hemorrhagic strokes, 2018-20: 9.6 per 100K people
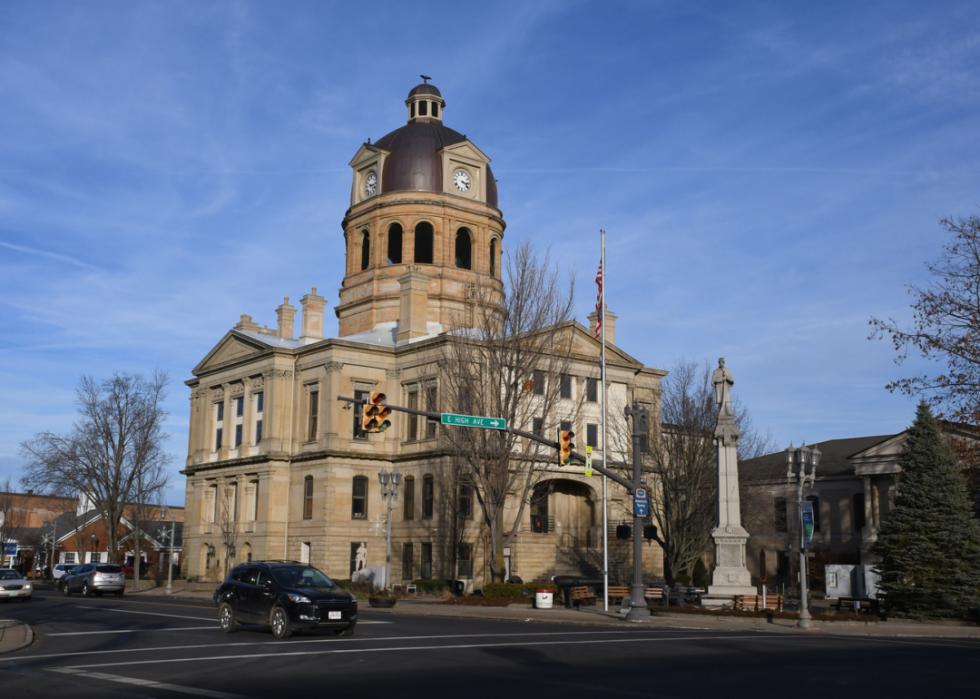
#17. Guernsey County
James W. Thompson // Shutterstock
- Age-adjusted rate of all strokes among adults, estimates for 2021: 3.3% (range between 2.9% and 3.7%)
- Death rate for ischemic strokes, 2018-20: 16.1 per 100K people
- Death rate for hemorrhagic strokes, 2018-20: 7.9 per 100K people
- Death rate for ischemic strokes, 2018-20: 16.1 per 100K people
- Death rate for hemorrhagic strokes, 2018-20: 7.9 per 100K people
You may also like: Best places to raise a family in Ohio
#16. Marion County
Madison Muskopf // Shutterstock
- Age-adjusted rate of all strokes among adults, estimates for 2021: 3.3% (range between 2.9% and 3.8%)
- Death rate for ischemic strokes, 2018-20: 16.5 per 100K people
- Death rate for hemorrhagic strokes, 2018-20: 9.1 per 100K people
- Death rate for ischemic strokes, 2018-20: 16.5 per 100K people
- Death rate for hemorrhagic strokes, 2018-20: 9.1 per 100K people
#15. Coshocton County
Canva
- Age-adjusted rate of all strokes among adults, estimates for 2021: 3.3% (range between 2.8% and 3.7%)
- Death rate for ischemic strokes, 2018-20: 18.0 per 100K people
- Death rate for hemorrhagic strokes, 2018-20: 8.4 per 100K people
- Death rate for ischemic strokes, 2018-20: 18.0 per 100K people
- Death rate for hemorrhagic strokes, 2018-20: 8.4 per 100K people
#14. Fayette County

James Marciniak // Shutterstock
- Age-adjusted rate of all strokes among adults, estimates for 2021: 3.3% (range between 2.9% and 3.8%)
- Death rate for ischemic strokes, 2018-20: 20.8 per 100K people
- Death rate for hemorrhagic strokes, 2018-20: 10.8 per 100K people
- Death rate for ischemic strokes, 2018-20: 20.8 per 100K people
- Death rate for hemorrhagic strokes, 2018-20: 10.8 per 100K people
#13. Jackson County
Canva
- Age-adjusted rate of all strokes among adults, estimates for 2021: 3.3% (range between 2.9% and 3.8%)
- Death rate for ischemic strokes, 2018-20: 21.2 per 100K people
- Death rate for hemorrhagic strokes, 2018-20: 9.1 per 100K people
- Death rate for ischemic strokes, 2018-20: 21.2 per 100K people
- Death rate for hemorrhagic strokes, 2018-20: 9.1 per 100K people
#12. Highland County
The American Explorer // Shutterstock
- Age-adjusted rate of all strokes among adults, estimates for 2021: 3.3% (range between 2.9% and 3.7%)
- Death rate for ischemic strokes, 2018-20: 21.3 per 100K people
- Death rate for hemorrhagic strokes, 2018-20: 10.7 per 100K people
- Death rate for ischemic strokes, 2018-20: 21.3 per 100K people
- Death rate for hemorrhagic strokes, 2018-20: 10.7 per 100K people
You may also like: Most diverse counties in Ohio
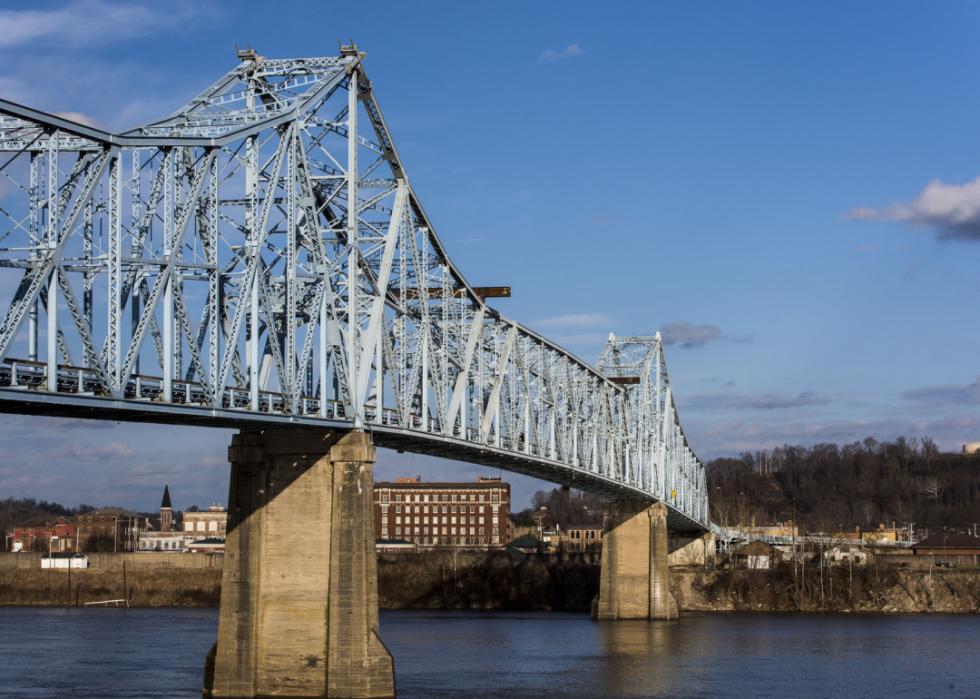
#11. Lawrence County

JNix // Shutterstock
- Age-adjusted rate of all strokes among adults, estimates for 2021: 3.3% (range between 2.8% and 3.7%)
- Death rate for ischemic strokes, 2018-20: 23.3 per 100K people
- Death rate for hemorrhagic strokes, 2018-20: 11.2 per 100K people
- Death rate for ischemic strokes, 2018-20: 23.3 per 100K people
- Death rate for hemorrhagic strokes, 2018-20: 11.2 per 100K people
#10. Gallia County

Canva
- Age-adjusted rate of all strokes among adults, estimates for 2021: 3.3% (range between 2.8% and 3.7%)
- Death rate for ischemic strokes, 2018-20: 23.5 per 100K people
- Death rate for hemorrhagic strokes, 2018-20: 8.8 per 100K people
- Death rate for ischemic strokes, 2018-20: 23.5 per 100K people
- Death rate for hemorrhagic strokes, 2018-20: 8.8 per 100K people
#9. Trumbull County
redtbird02 // Shutterstock
- Age-adjusted rate of all strokes among adults, estimates for 2021: 3.4% (range between 3.0% and 3.9%)
- Death rate for ischemic strokes, 2018-20: 17.1 per 100K people
- Death rate for hemorrhagic strokes, 2018-20: 8.3 per 100K people
- Death rate for ischemic strokes, 2018-20: 17.1 per 100K people
- Death rate for hemorrhagic strokes, 2018-20: 8.3 per 100K people
#8. Ashtabula County

Canva
- Age-adjusted rate of all strokes among adults, estimates for 2021: 3.4% (range between 3.0% and 3.9%)
- Death rate for ischemic strokes, 2018-20: 23.4 per 100K people
- Death rate for hemorrhagic strokes, 2018-20: 11.0 per 100K people
- Death rate for ischemic strokes, 2018-20: 23.4 per 100K people
- Death rate for hemorrhagic strokes, 2018-20: 11.0 per 100K people
#7. Adams County
Canva
- Age-adjusted rate of all strokes among adults, estimates for 2021: 3.5% (range between 3.1% and 3.9%)
- Death rate for ischemic strokes, 2018-20: 15.0 per 100K people
- Death rate for hemorrhagic strokes, 2018-20: 9.6 per 100K people
- Death rate for ischemic strokes, 2018-20: 15.0 per 100K people
- Death rate for hemorrhagic strokes, 2018-20: 9.6 per 100K people
You may also like: Counties most concerned about climate change in Ohio
#6. Morgan County
Canva
- Age-adjusted rate of all strokes among adults, estimates for 2021: 3.5% (range between 3.0% and 4.0%)
- Death rate for ischemic strokes, 2018-20: 17.7 per 100K people
- Death rate for hemorrhagic strokes, 2018-20: 9.3 per 100K people
- Death rate for ischemic strokes, 2018-20: 17.7 per 100K people
- Death rate for hemorrhagic strokes, 2018-20: 9.3 per 100K people
#5. Holmes County
The American Explorer // Shutterstock
- Age-adjusted rate of all strokes among adults, estimates for 2021: 3.5% (range between 3.1% and 4.0%)
- Death rate for ischemic strokes, 2018-20: 20.4 per 100K people
- Death rate for hemorrhagic strokes, 2018-20: 11.1 per 100K people
- Death rate for ischemic strokes, 2018-20: 20.4 per 100K people
- Death rate for hemorrhagic strokes, 2018-20: 11.1 per 100K people
#4. Vinton County

Canva
- Age-adjusted rate of all strokes among adults, estimates for 2021: 3.5% (range between 3.1% and 4.0%)
- Death rate for ischemic strokes, 2018-20: 22.0 per 100K people
- Death rate for hemorrhagic strokes, 2018-20: 11.2 per 100K people
- Death rate for ischemic strokes, 2018-20: 22.0 per 100K people
- Death rate for hemorrhagic strokes, 2018-20: 11.2 per 100K people
#3. Meigs County
Canva
- Age-adjusted rate of all strokes among adults, estimates for 2021: 3.5% (range between 3.1% and 4.1%)
- Death rate for ischemic strokes, 2018-20: 22.7 per 100K people
- Death rate for hemorrhagic strokes, 2018-20: 11.1 per 100K people
- Death rate for ischemic strokes, 2018-20: 22.7 per 100K people
- Death rate for hemorrhagic strokes, 2018-20: 11.1 per 100K people
#2. Scioto County

Canva
- Age-adjusted rate of all strokes among adults, estimates for 2021: 3.6% (range between 3.1% and 4.0%)
- Death rate for ischemic strokes, 2018-20: 21.3 per 100K people
- Death rate for hemorrhagic strokes, 2018-20: 10.2 per 100K people
- Death rate for ischemic strokes, 2018-20: 21.3 per 100K people
- Death rate for hemorrhagic strokes, 2018-20: 10.2 per 100K people
You may also like: Highest-earning counties in Ohio
This story features data reporting and writing by Emma Rubin and is part of a series utilizing data automation across 49 states.
#1. Pike County

Canva