Counties with the most bridges in dire need of repair in Ohio

- Bridges in poor condition: 7.9% (15 of 190 bridges)
- Square meters of bridges in poor condition: 4.6% (2,064 of 44,715 square meters of bridges)
- Bridges in poor condition: 8.1% (26 of 322 bridges)
- Square meters of bridges in poor condition: 3.1% (4,335 of 139,113 square meters of bridges)
- Bridges in poor condition: 8.1% (26 of 320 bridges)
- Square meters of bridges in poor condition: 3.4% (3,948 of 117,381 square meters of bridges)
- Bridges in poor condition: 8.2% (19 of 232 bridges)
- Square meters of bridges in poor condition: 5.5% (7,953 of 145,062 square meters of bridges)

- Bridges in poor condition: 8.3% (29 of 351 bridges)
- Square meters of bridges in poor condition: 7.0% (6,963 of 99,504 square meters of bridges)
- Bridges in poor condition: 8.7% (34 of 393 bridges)
- Square meters of bridges in poor condition: 3.9% (4,628 of 119,483 square meters of bridges)
- Bridges in poor condition: 8.9% (28 of 313 bridges)
- Square meters of bridges in poor condition: 4.5% (3,282 of 72,879 square meters of bridges)
- Bridges in poor condition: 9.0% (33 of 365 bridges)
- Square meters of bridges in poor condition: 2.1% (3,114 of 148,913 square meters of bridges)

- Bridges in poor condition: 9.2% (20 of 218 bridges)
- Square meters of bridges in poor condition: 3.9% (4,546 of 116,657 square meters of bridges)

- Bridges in poor condition: 9.3% (37 of 396 bridges)
- Square meters of bridges in poor condition: 3.2% (7,128 of 225,532 square meters of bridges)
- Bridges in poor condition: 9.4% (24 of 255 bridges)
- Square meters of bridges in poor condition: 1.3% (1,743 of 132,742 square meters of bridges)

- Bridges in poor condition: 9.4% (24 of 255 bridges)
- Square meters of bridges in poor condition: 3.7% (2,061 of 55,442 square meters of bridges)
- Bridges in poor condition: 9.6% (26 of 271 bridges)
- Square meters of bridges in poor condition: 7.2% (2,605 of 36,382 square meters of bridges)
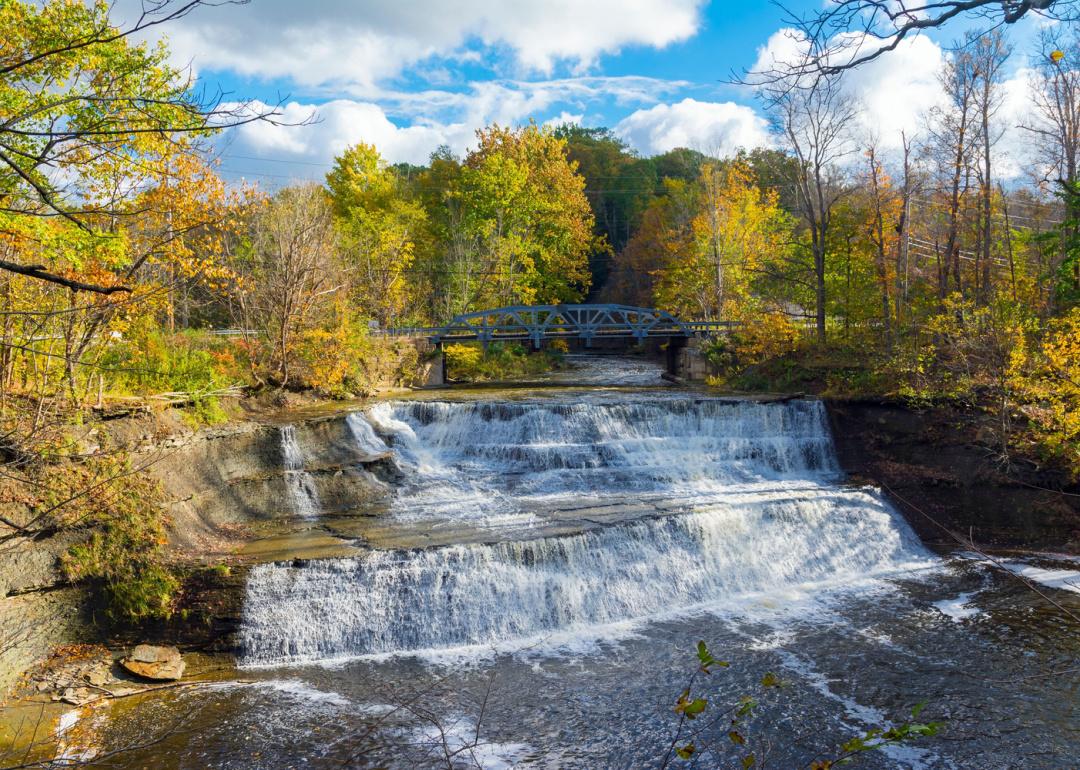
- Bridges in poor condition: 9.8% (21 of 215 bridges)
- Square meters of bridges in poor condition: 11.6% (22,897 of 196,828 square meters of bridges)

- Bridges in poor condition: 9.9% (44 of 444 bridges)
- Square meters of bridges in poor condition: 6.2% (10,825 of 174,684 square meters of bridges)
- Bridges in poor condition: 10.2% (20 of 197 bridges)
- Square meters of bridges in poor condition: 8.8% (6,502 of 73,981 square meters of bridges)
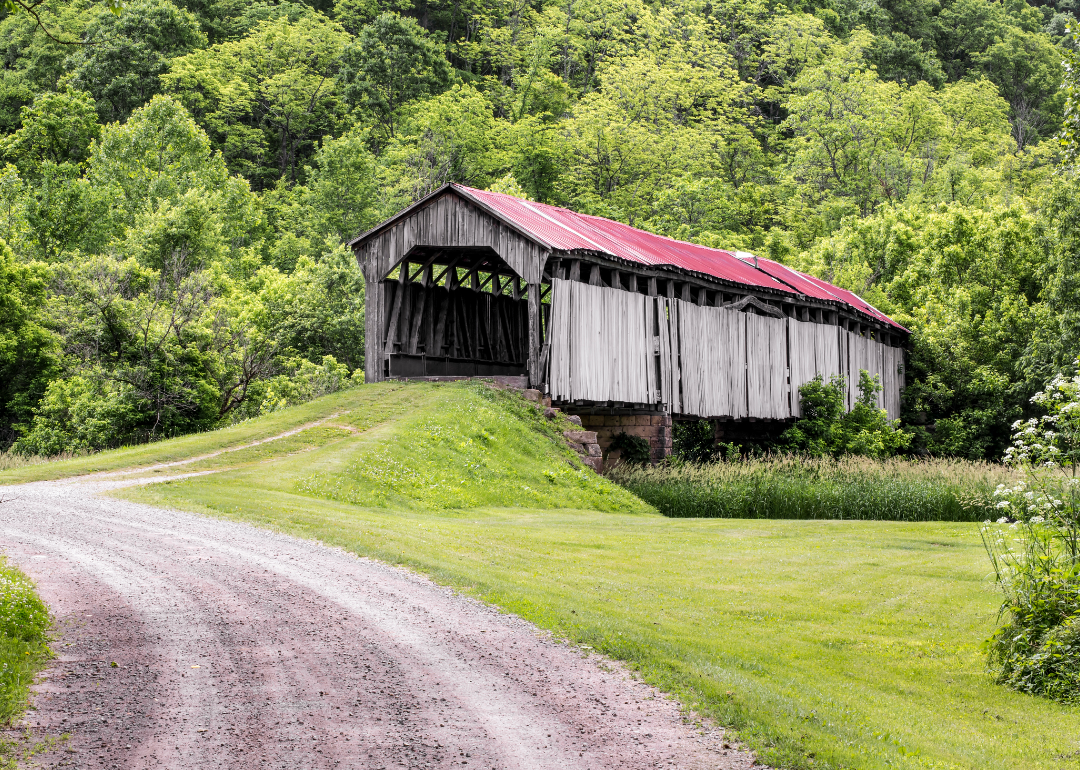
- Bridges in poor condition: 11.0% (18 of 164 bridges)
- Square meters of bridges in poor condition: 5.3% (1,653 of 31,465 square meters of bridges)

- Bridges in poor condition: 11.2% (21 of 188 bridges)
- Square meters of bridges in poor condition: 3.1% (1,764 of 56,222 square meters of bridges)
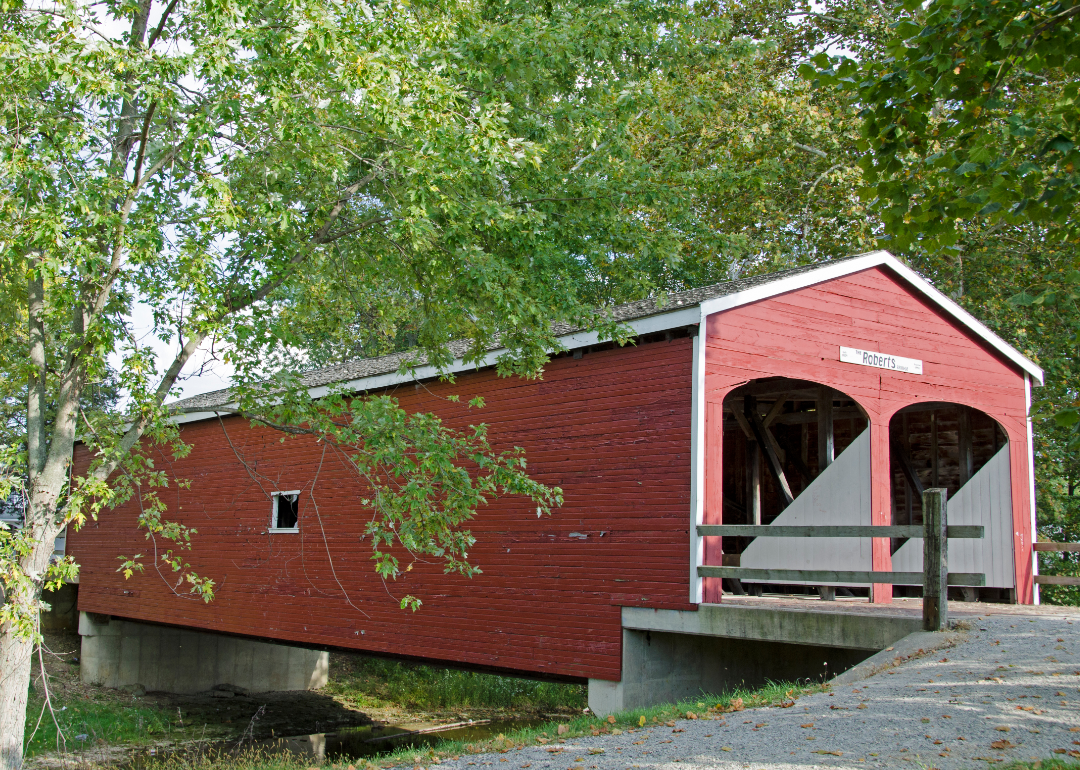
- Bridges in poor condition: 12.3% (44 of 359 bridges)
- Square meters of bridges in poor condition: 7.8% (6,183 of 79,544 square meters of bridges)

- Bridges in poor condition: 15.4% (22 of 143 bridges)
- Square meters of bridges in poor condition: 9.8% (3,434 of 34,966 square meters of bridges)
