Counties with the most homes selling under list price in Ohio
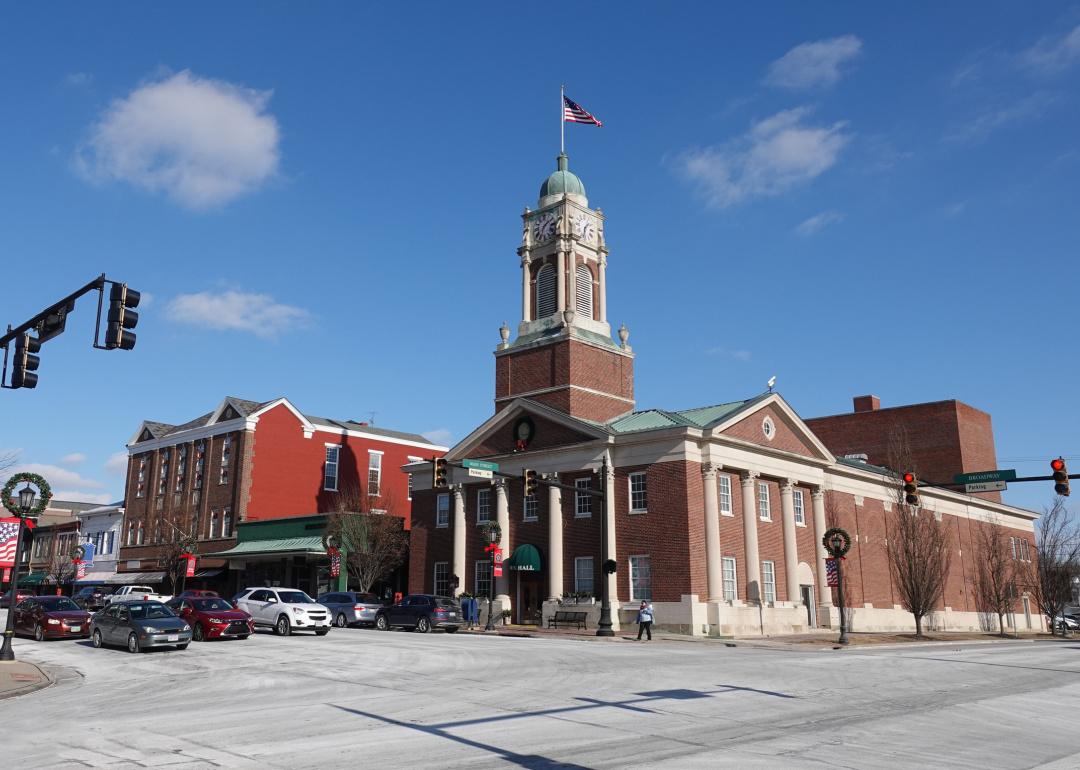
- Average price difference: 0.08% below list
-- Median list price: $396,500
-- Median sale price: $369,900
- Total homes sold: 239
-- Share that sold above list: 39.3%

- Average price difference: 0.16% below list
-- Median list price: $319,900
-- Median sale price: $325,450
- Total homes sold: 196
-- Share that sold above list: 30.6%
- Average price difference: 0.45% below list
-- Median list price: $279,950
-- Median sale price: $300,000
- Total homes sold: 288
-- Share that sold above list: 34.4%

- Average price difference: 0.69% below list
-- Median list price: $314,999
-- Median sale price: $276,650
- Total homes sold: 164
-- Share that sold above list: 28.7%
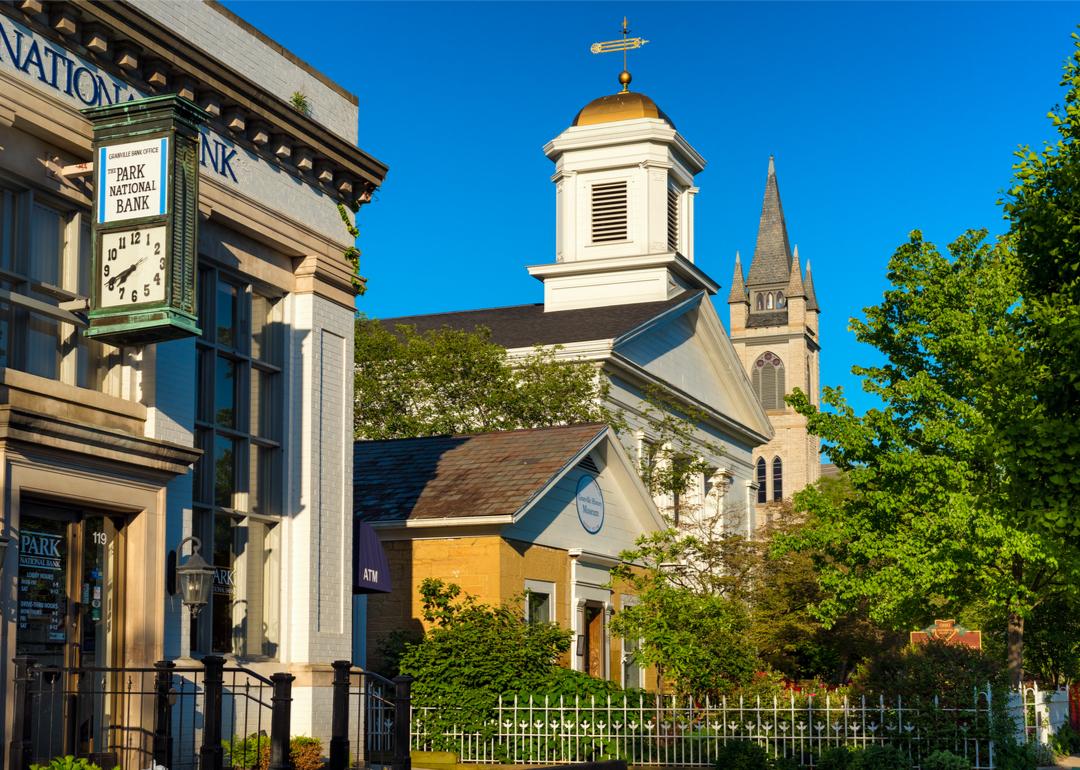
- Average price difference: 0.73% below list
-- Median list price: $339,000
-- Median sale price: $321,500
- Total homes sold: 191
-- Share that sold above list: 27.7%

- Average price difference: 0.75% below list
-- Median list price: $199,900
-- Median sale price: $195,500
- Total homes sold: 540
-- Share that sold above list: 38.1%
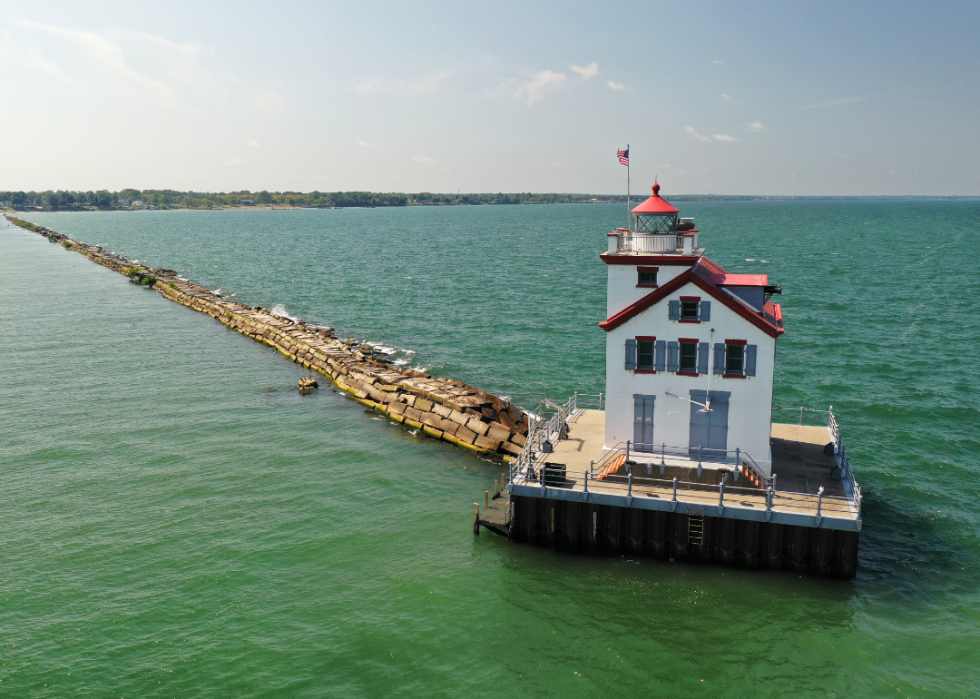
- Average price difference: 0.77% below list
-- Median list price: $235,000
-- Median sale price: $193,750
- Total homes sold: 280
-- Share that sold above list: 38.9%
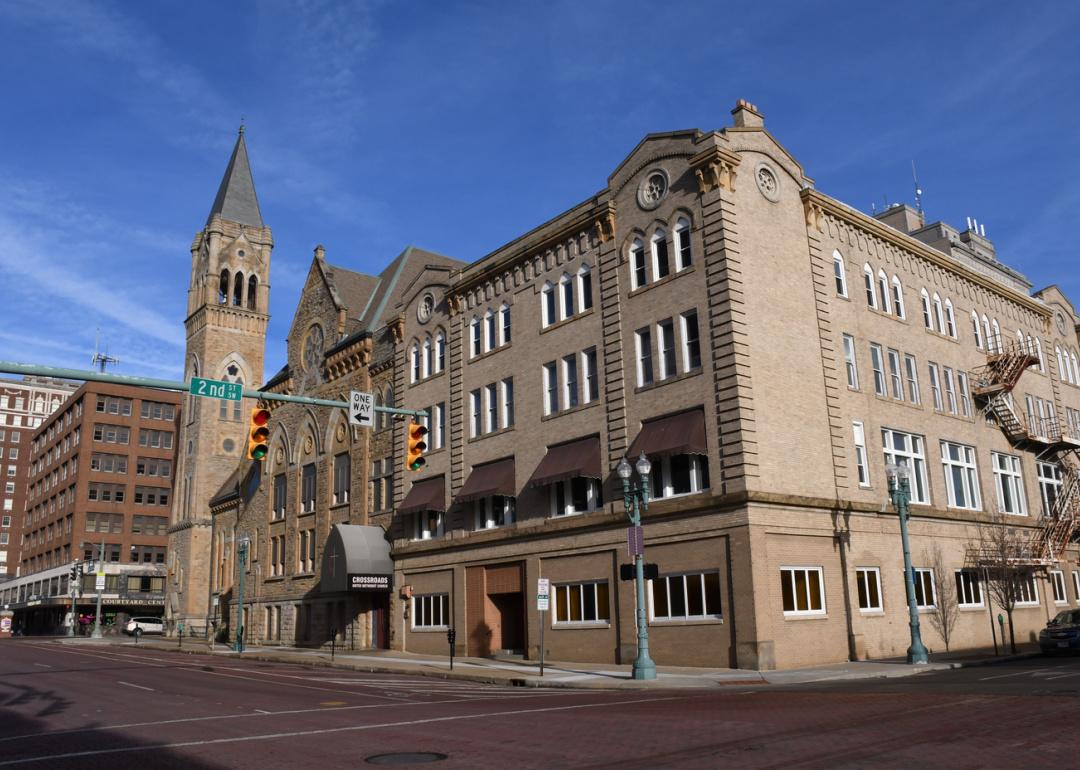
- Average price difference: 0.79% below list
-- Median list price: $207,450
-- Median sale price: $200,000
- Total homes sold: 312
-- Share that sold above list: 35.9%
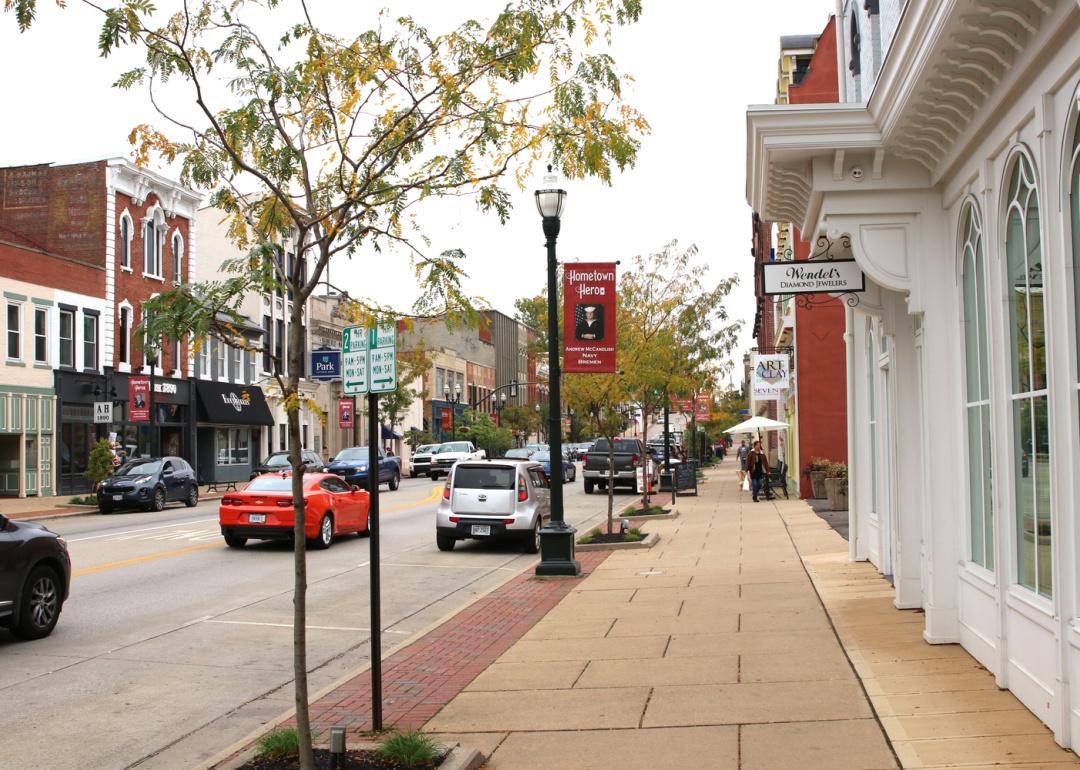
- Average price difference: 0.87% below list
-- Median list price: $342,500
-- Median sale price: $323,950
- Total homes sold: 148
-- Share that sold above list: 36.5%

- Average price difference: 1.11% below list
-- Median list price: $245,000
-- Median sale price: $224,750
- Total homes sold: 231
-- Share that sold above list: 35.9%

- Average price difference: 1.29% below list
-- Median list price: $157,400
-- Median sale price: $152,500
- Total homes sold: 379
-- Share that sold above list: 36.9%

- Average price difference: 1.58% below list
-- Median list price: $199,500
-- Median sale price: $180,000
- Total homes sold: 1,194
-- Share that sold above list: 34.6%

- Average price difference: 2.03% below list
-- Median list price: $190,000
-- Median sale price: $199,000
- Total homes sold: 556
-- Share that sold above list: 29.5%
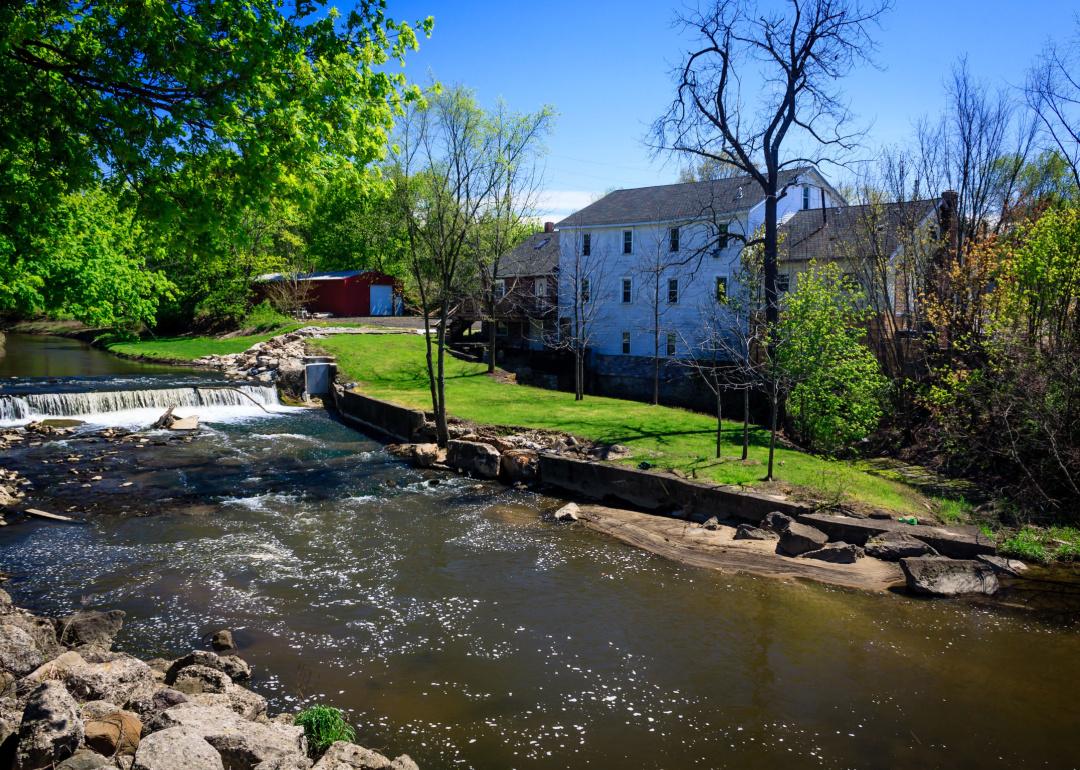
- Average price difference: 2.12% below list
-- Median list price: $169,900
-- Median sale price: $181,000
- Total homes sold: 121
-- Share that sold above list: 28.9%
- Average price difference: 2.49% below list
-- Median list price: $275,000
-- Median sale price: $251,000
- Total homes sold: 106
-- Share that sold above list: 36.8%

- Average price difference: 2.72% below list
-- Median list price: $164,900
-- Median sale price: $137,500
- Total homes sold: 173
-- Share that sold above list: 27.7%

- Average price difference: 3.03% below list
-- Median list price: $184,900
-- Median sale price: $179,900
- Total homes sold: 113
-- Share that sold above list: 23.0%

- Average price difference: 3.52% below list
-- Median list price: $189,900
-- Median sale price: $164,000
- Total homes sold: 193
-- Share that sold above list: 26.4%
This story features data reporting and writing by Elena Cox and is part of a series utilizing data automation across 28 states.
