Counties with the highest rates of strokes in Oklahoma
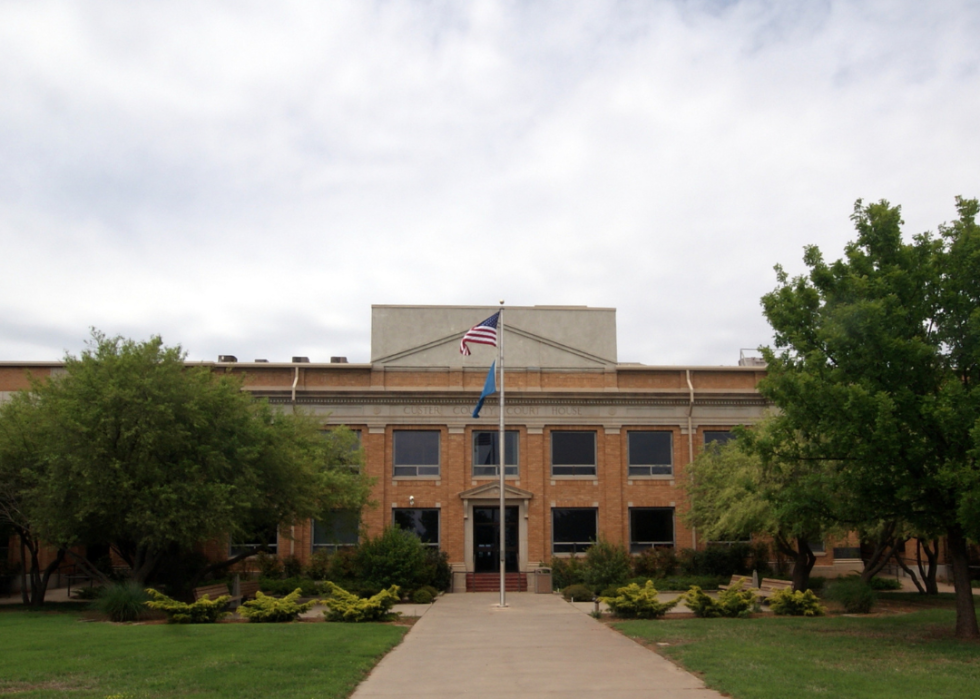
- Death rate for ischemic strokes, 2018-20: 28.7 per 100K people
- Death rate for hemorrhagic strokes, 2018-20: 6.9 per 100K people

- Death rate for ischemic strokes, 2018-20: 24.2 per 100K people
- Death rate for hemorrhagic strokes, 2018-20: 9.8 per 100K people
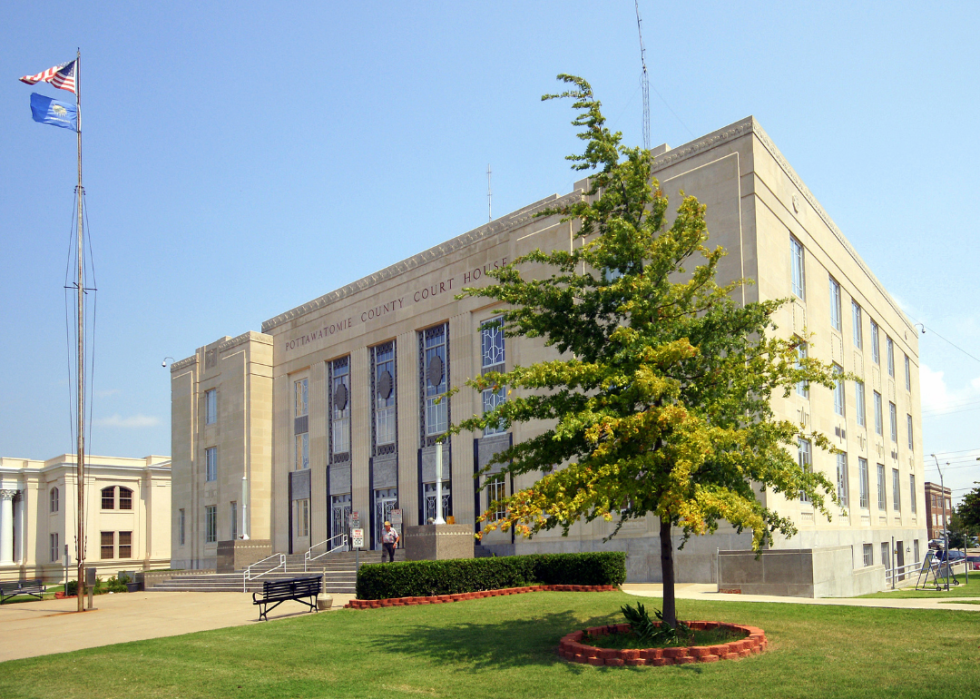
- Death rate for ischemic strokes, 2018-20: 24.9 per 100K people
- Death rate for hemorrhagic strokes, 2018-20: 7.2 per 100K people

- Death rate for ischemic strokes, 2018-20: 25.3 per 100K people
- Death rate for hemorrhagic strokes, 2018-20: 6.8 per 100K people

- Death rate for ischemic strokes, 2018-20: 25.8 per 100K people
- Death rate for hemorrhagic strokes, 2018-20: 5.9 per 100K people
You may also like: Highest-earning counties in Oklahoma

- Death rate for ischemic strokes, 2018-20: 28.0 per 100K people
- Death rate for hemorrhagic strokes, 2018-20: 8.0 per 100K people
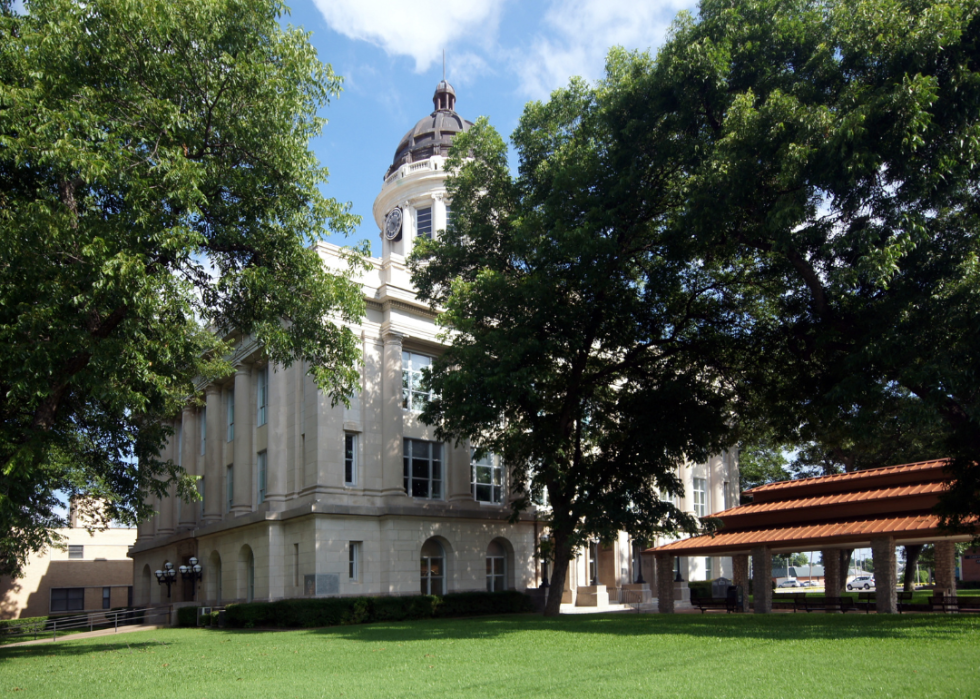
- Death rate for ischemic strokes, 2018-20: 22.6 per 100K people
- Death rate for hemorrhagic strokes, 2018-20: 9.3 per 100K people

- Death rate for ischemic strokes, 2018-20: 23.1 per 100K people
- Death rate for hemorrhagic strokes, 2018-20: 7.3 per 100K people

- Death rate for ischemic strokes, 2018-20: 23.3 per 100K people
- Death rate for hemorrhagic strokes, 2018-20: 6.6 per 100K people

- Death rate for ischemic strokes, 2018-20: 24.0 per 100K people
- Death rate for hemorrhagic strokes, 2018-20: 9.6 per 100K people
You may also like: Best community colleges in Oklahoma
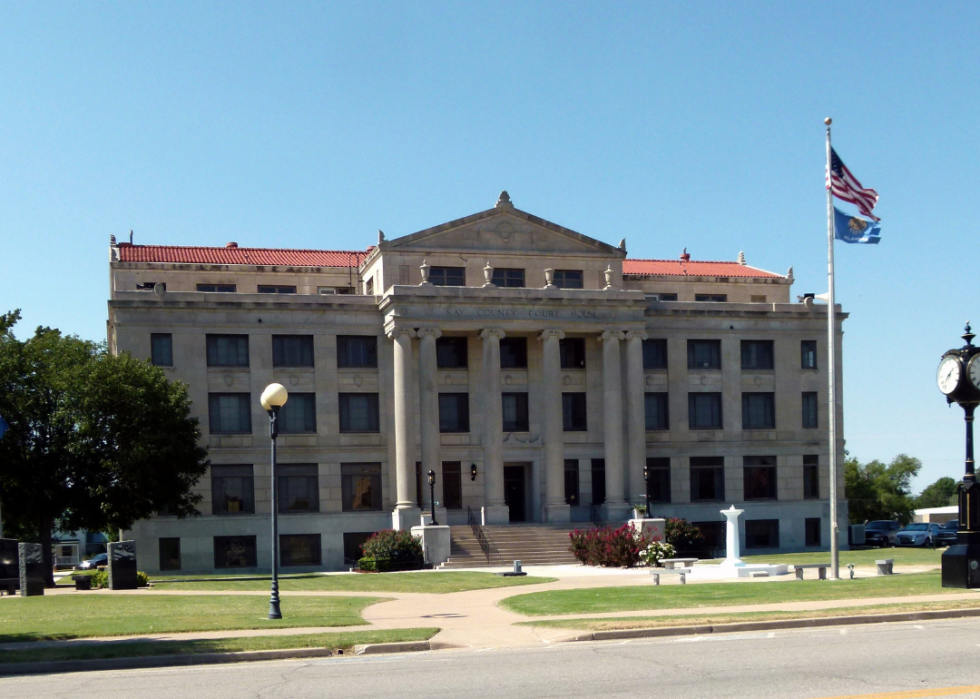
- Death rate for ischemic strokes, 2018-20: 24.3 per 100K people
- Death rate for hemorrhagic strokes, 2018-20: 5.6 per 100K people
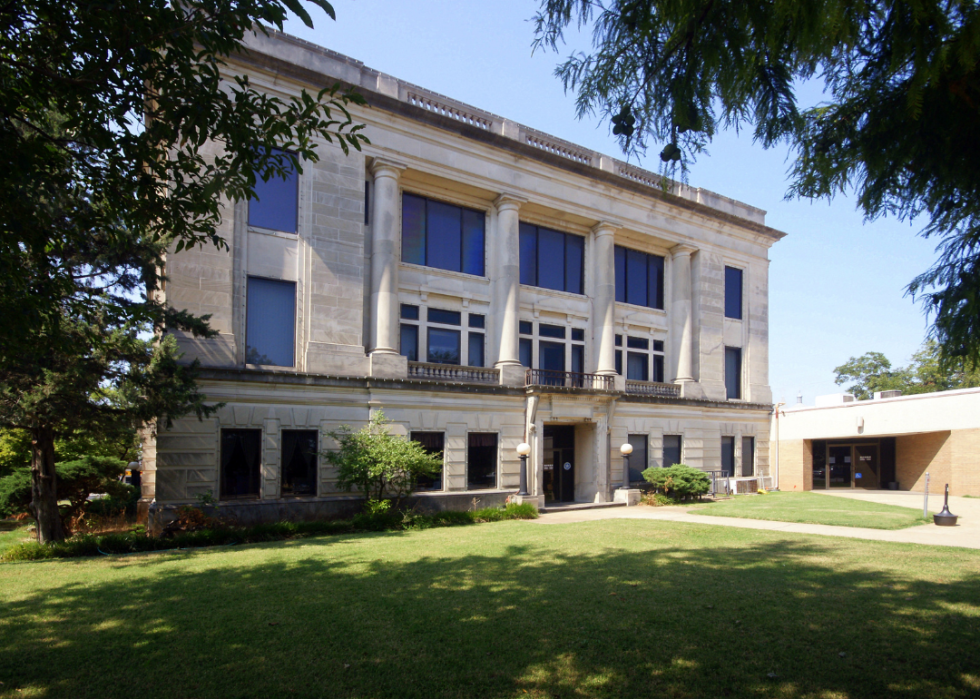
- Death rate for ischemic strokes, 2018-20: 24.5 per 100K people
- Death rate for hemorrhagic strokes, 2018-20: 8.4 per 100K people
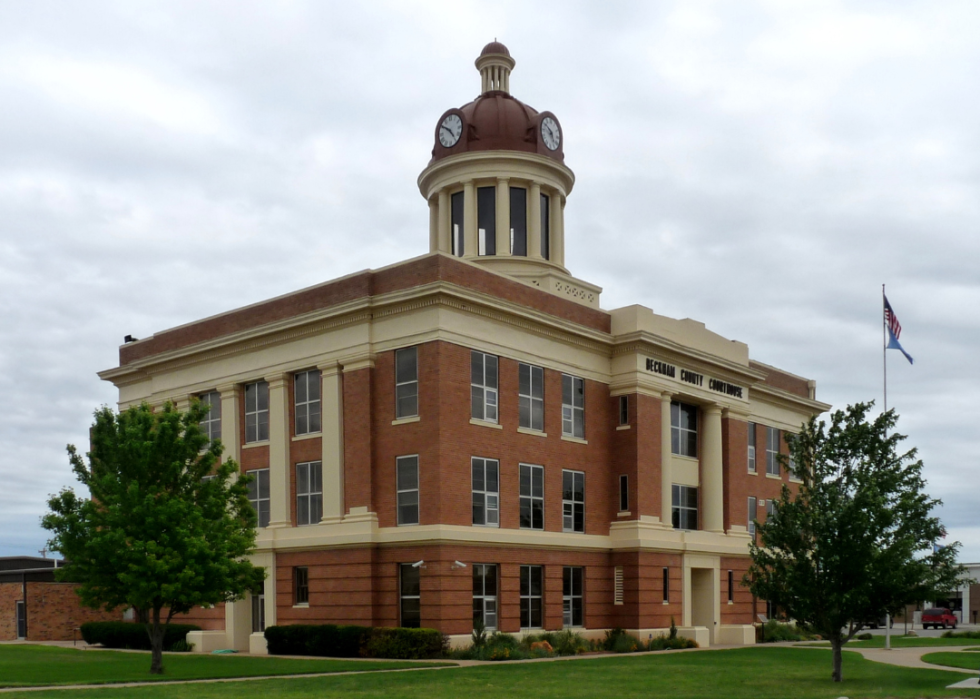
- Death rate for ischemic strokes, 2018-20: 26.1 per 100K people
- Death rate for hemorrhagic strokes, 2018-20: 4.7 per 100K people

- Death rate for ischemic strokes, 2018-20: 26.4 per 100K people
- Death rate for hemorrhagic strokes, 2018-20: 6.4 per 100K people

- Death rate for ischemic strokes, 2018-20: 19.0 per 100K people
- Death rate for hemorrhagic strokes, 2018-20: 6.9 per 100K people
You may also like: States where people in Oklahoma are getting new jobs
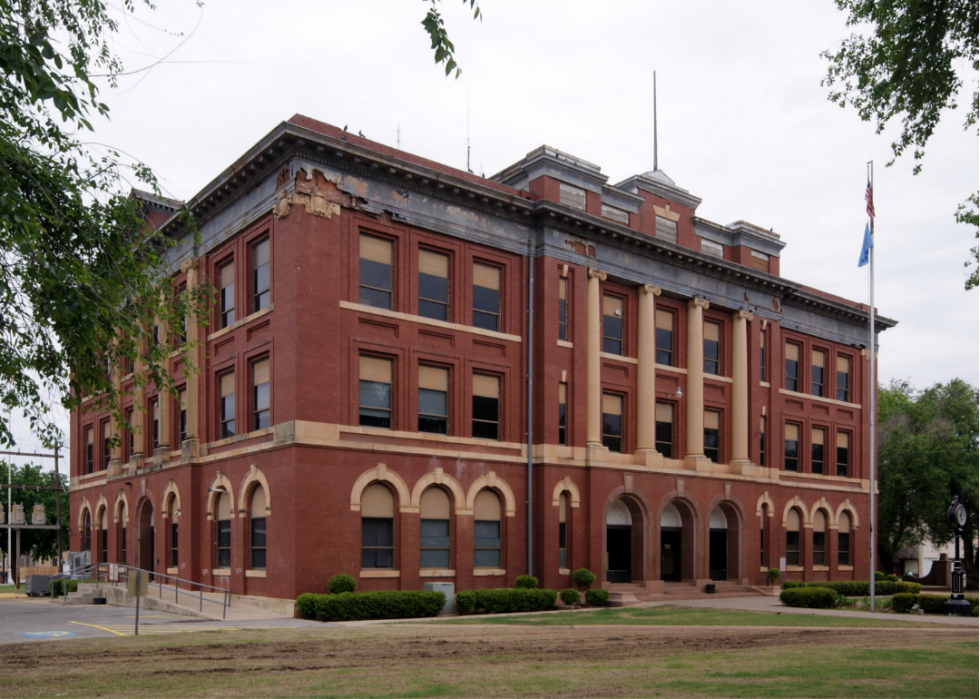
- Death rate for ischemic strokes, 2018-20: 20.3 per 100K people
- Death rate for hemorrhagic strokes, 2018-20: 5.4 per 100K people
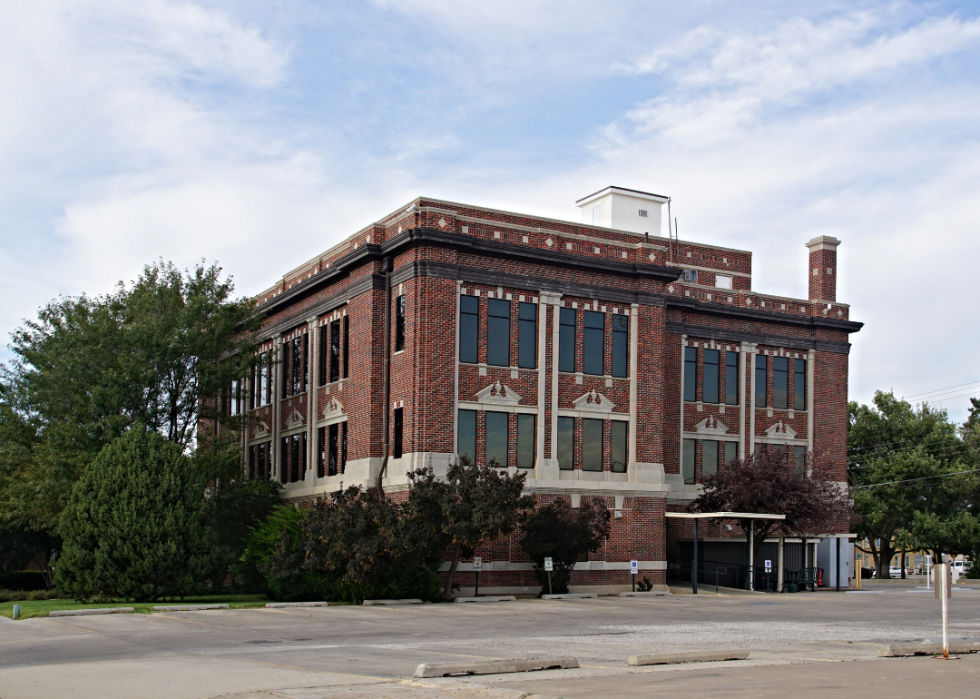
- Death rate for ischemic strokes, 2018-20: 20.4 per 100K people
- Death rate for hemorrhagic strokes, 2018-20: 9.5 per 100K people

- Death rate for ischemic strokes, 2018-20: 21.3 per 100K people
- Death rate for hemorrhagic strokes, 2018-20: 8.1 per 100K people

- Death rate for ischemic strokes, 2018-20: 21.6 per 100K people
- Death rate for hemorrhagic strokes, 2018-20: 10.1 per 100K people
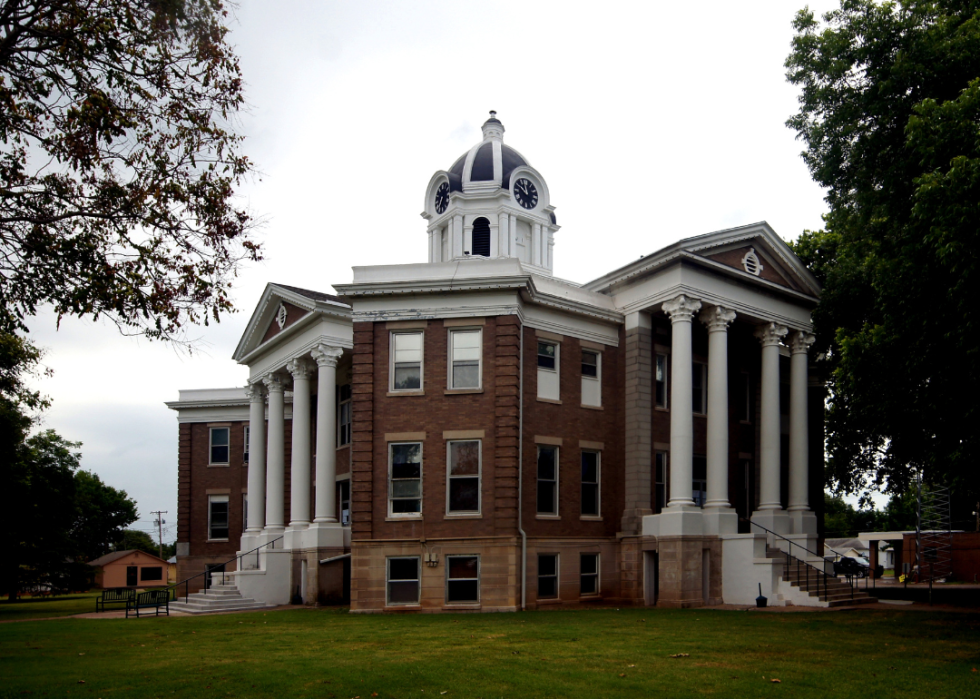
- Death rate for ischemic strokes, 2018-20: 21.8 per 100K people
- Death rate for hemorrhagic strokes, 2018-20: 12.1 per 100K people
You may also like: See how low property taxes in Oklahoma are

- Death rate for ischemic strokes, 2018-20: 26.1 per 100K people
- Death rate for hemorrhagic strokes, 2018-20: 5.0 per 100K people

- Death rate for ischemic strokes, 2018-20: 18.0 per 100K people
- Death rate for hemorrhagic strokes, 2018-20: 7.0 per 100K people
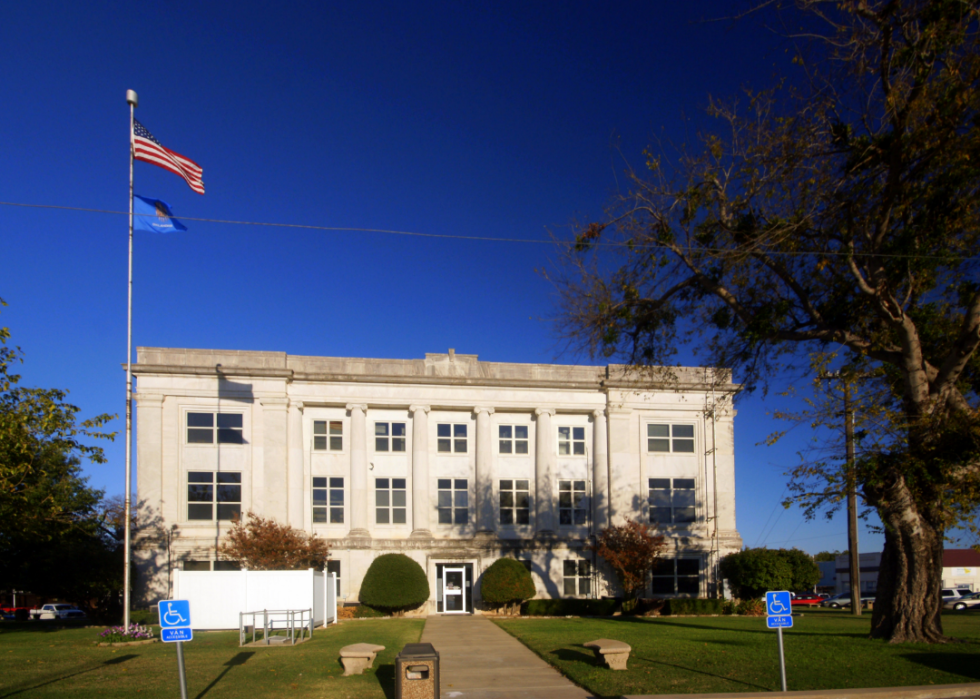
- Death rate for ischemic strokes, 2018-20: 19.9 per 100K people
- Death rate for hemorrhagic strokes, 2018-20: 8.8 per 100K people
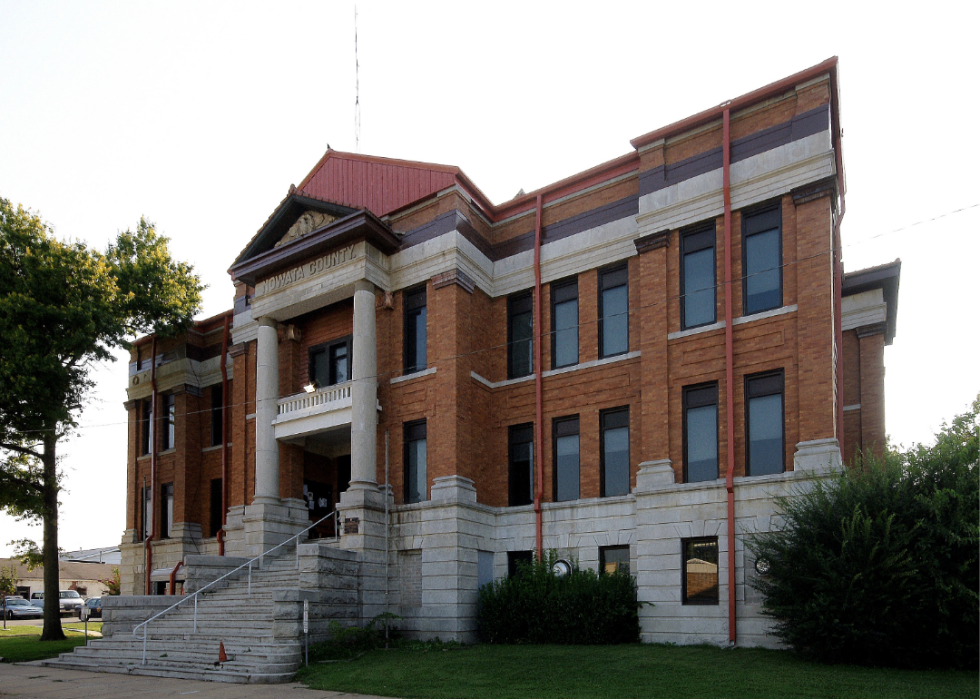
- Death rate for ischemic strokes, 2018-20: 20.8 per 100K people
- Death rate for hemorrhagic strokes, 2018-20: 8.0 per 100K people

- Death rate for ischemic strokes, 2018-20: 21.9 per 100K people
- Death rate for hemorrhagic strokes, 2018-20: 5.5 per 100K people
You may also like: Counties with highest COVID-19 infection rates in Oklahoma
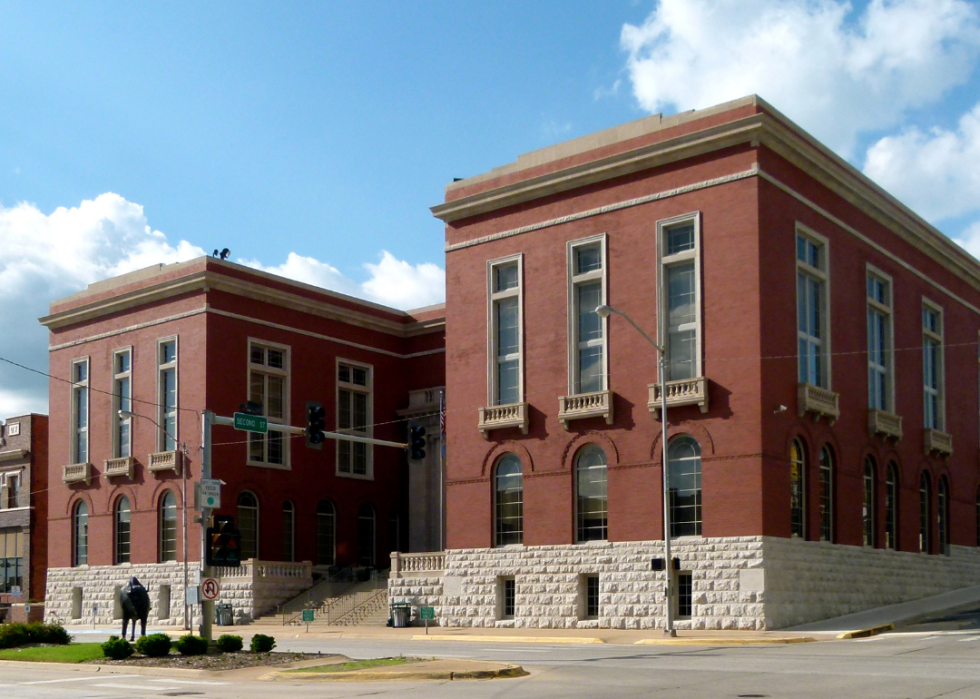
- Death rate for ischemic strokes, 2018-20: 24.3 per 100K people
- Death rate for hemorrhagic strokes, 2018-20: 8.6 per 100K people

- Death rate for ischemic strokes, 2018-20: 45.9 per 100K people
- Death rate for hemorrhagic strokes, 2018-20: 6.3 per 100K people

- Death rate for ischemic strokes, 2018-20: 19.1 per 100K people
- Death rate for hemorrhagic strokes, 2018-20: 7.3 per 100K people
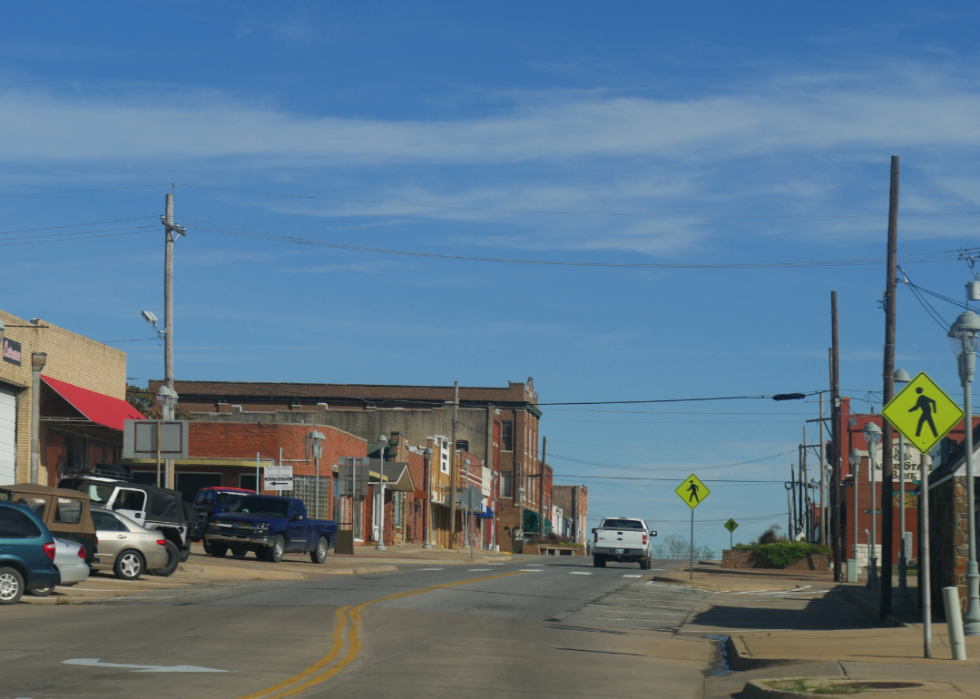
- Death rate for ischemic strokes, 2018-20: 20.5 per 100K people
- Death rate for hemorrhagic strokes, 2018-20: 8.9 per 100K people
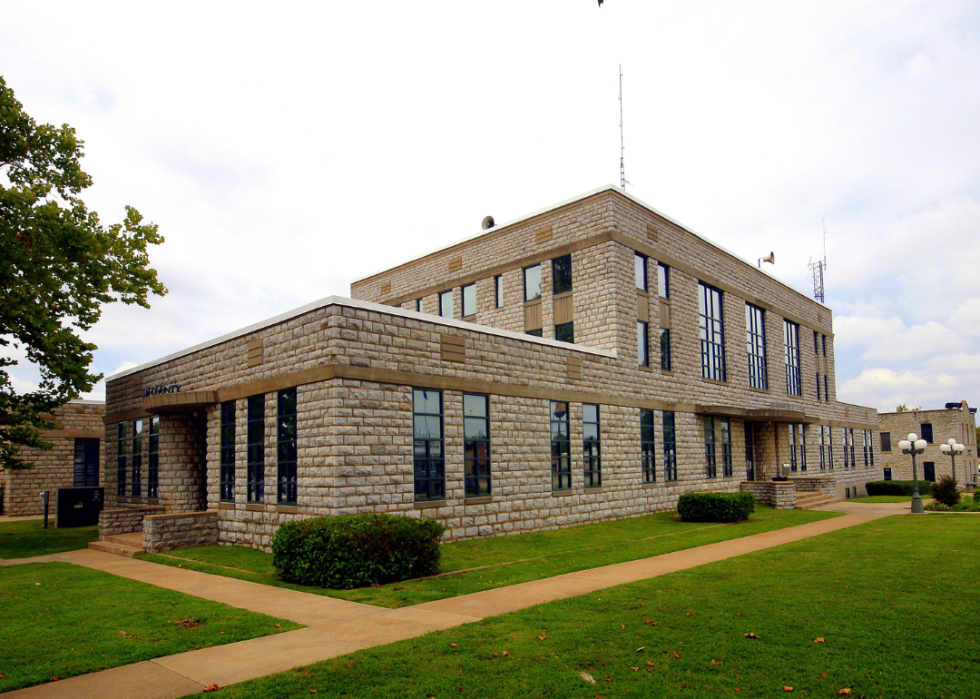
- Death rate for ischemic strokes, 2018-20: 25.1 per 100K people
- Death rate for hemorrhagic strokes, 2018-20: 4.6 per 100K people
You may also like: A child gets a burger: A major civil rights moment in Oklahoma

- Death rate for ischemic strokes, 2018-20: 26.0 per 100K people
- Death rate for hemorrhagic strokes, 2018-20: 10.3 per 100K people
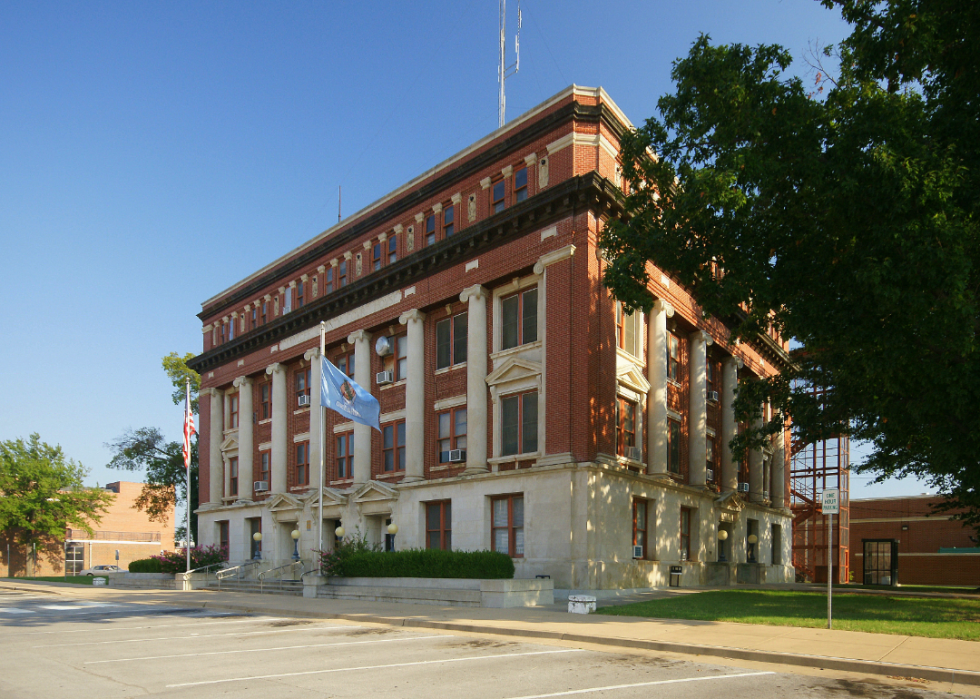
- Death rate for ischemic strokes, 2018-20: 27.0 per 100K people
- Death rate for hemorrhagic strokes, 2018-20: 6.8 per 100K people
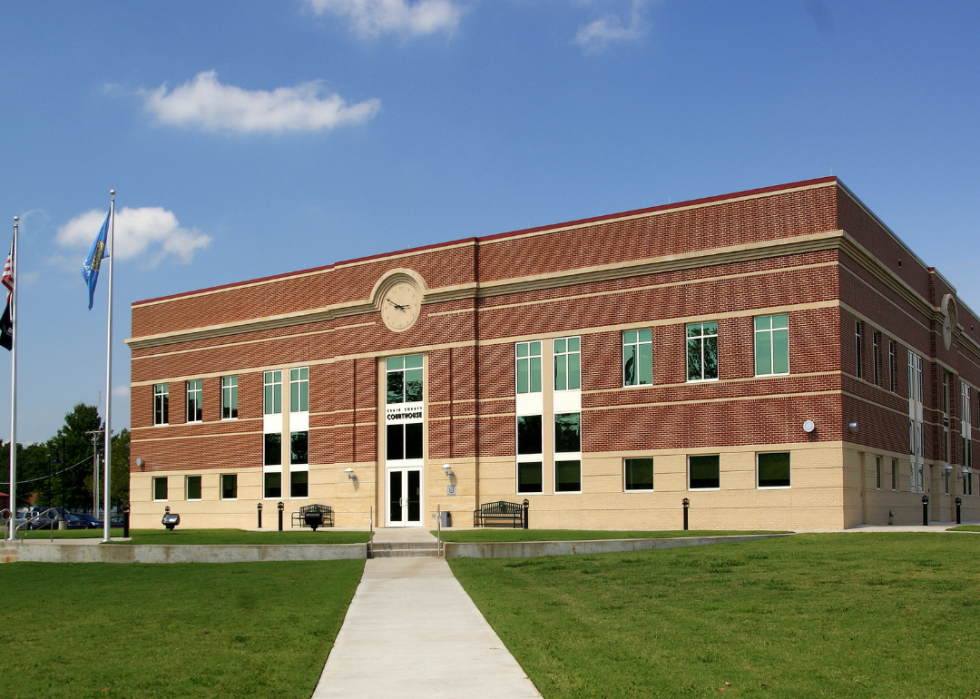
- Death rate for ischemic strokes, 2018-20: 22.7 per 100K people
- Death rate for hemorrhagic strokes, 2018-20: 9.1 per 100K people

- Death rate for ischemic strokes, 2018-20: 22.9 per 100K people
- Death rate for hemorrhagic strokes, 2018-20: 6.7 per 100K people
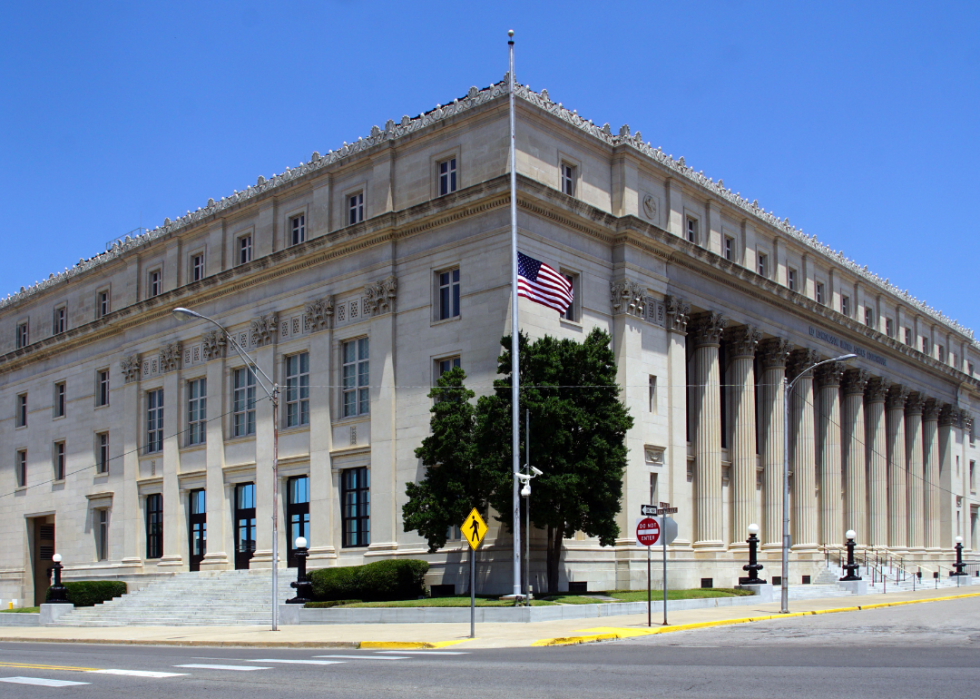
- Death rate for ischemic strokes, 2018-20: 23.2 per 100K people
- Death rate for hemorrhagic strokes, 2018-20: 7.9 per 100K people
You may also like: Counties with the oldest homes in Oklahoma

- Death rate for ischemic strokes, 2018-20: 25.0 per 100K people
- Death rate for hemorrhagic strokes, 2018-20: 9.7 per 100K people
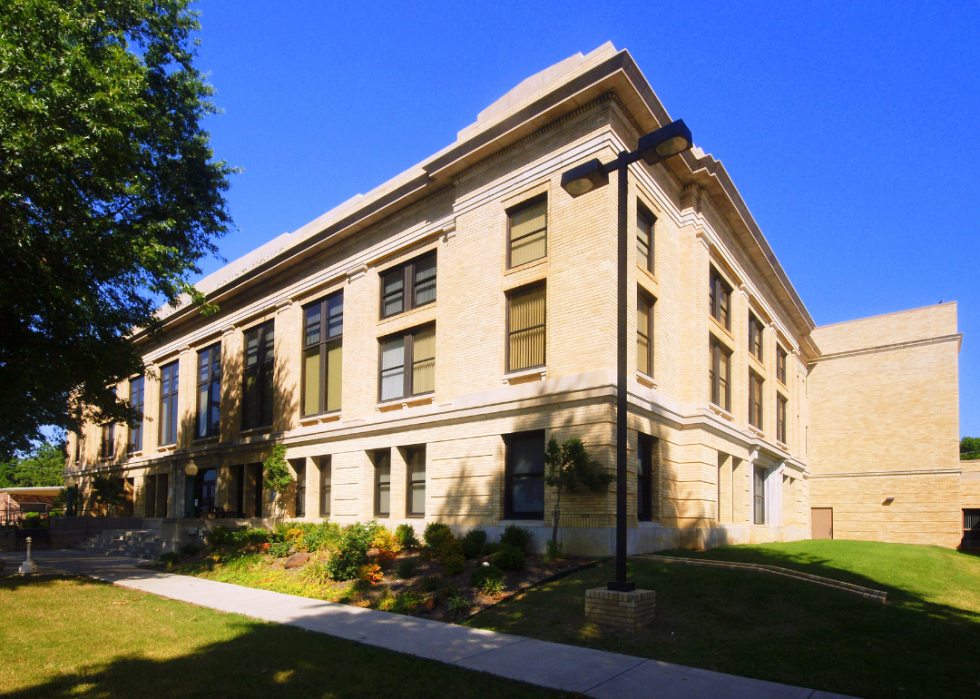
- Death rate for ischemic strokes, 2018-20: 25.1 per 100K people
- Death rate for hemorrhagic strokes, 2018-20: 11.6 per 100K people

- Death rate for ischemic strokes, 2018-20: 25.3 per 100K people
- Death rate for hemorrhagic strokes, 2018-20: 10.7 per 100K people

- Death rate for ischemic strokes, 2018-20: 26.1 per 100K people
- Death rate for hemorrhagic strokes, 2018-20: 8.9 per 100K people
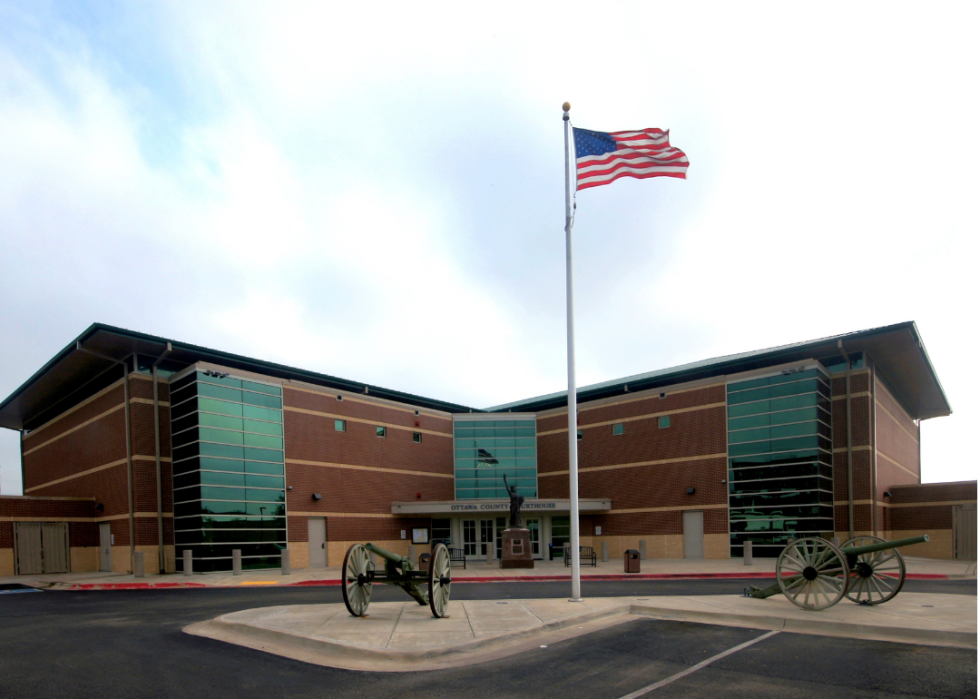
- Death rate for ischemic strokes, 2018-20: 27.0 per 100K people
- Death rate for hemorrhagic strokes, 2018-20: 17.7 per 100K people
You may also like: Colleges with the best ROI in Oklahoma

- Death rate for ischemic strokes, 2018-20: 28.1 per 100K people
- Death rate for hemorrhagic strokes, 2018-20: 9.1 per 100K people

- Death rate for ischemic strokes, 2018-20: 24.4 per 100K people
- Death rate for hemorrhagic strokes, 2018-20: 9.5 per 100K people
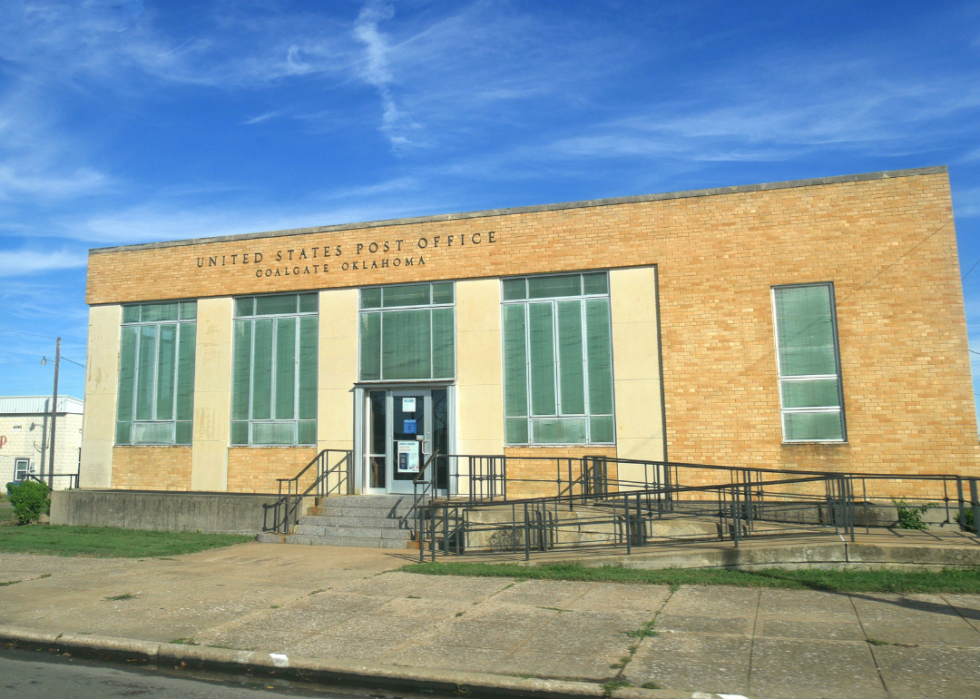
- Death rate for ischemic strokes, 2018-20: 24.5 per 100K people
- Death rate for hemorrhagic strokes, 2018-20: 7.2 per 100K people

- Death rate for ischemic strokes, 2018-20: 25.4 per 100K people
- Death rate for hemorrhagic strokes, 2018-20: 7.5 per 100K people

- Death rate for ischemic strokes, 2018-20: 34.3 per 100K people
- Death rate for hemorrhagic strokes, 2018-20: 11.7 per 100K people
You may also like: Counties with the most born-and-bred residents in Oklahoma
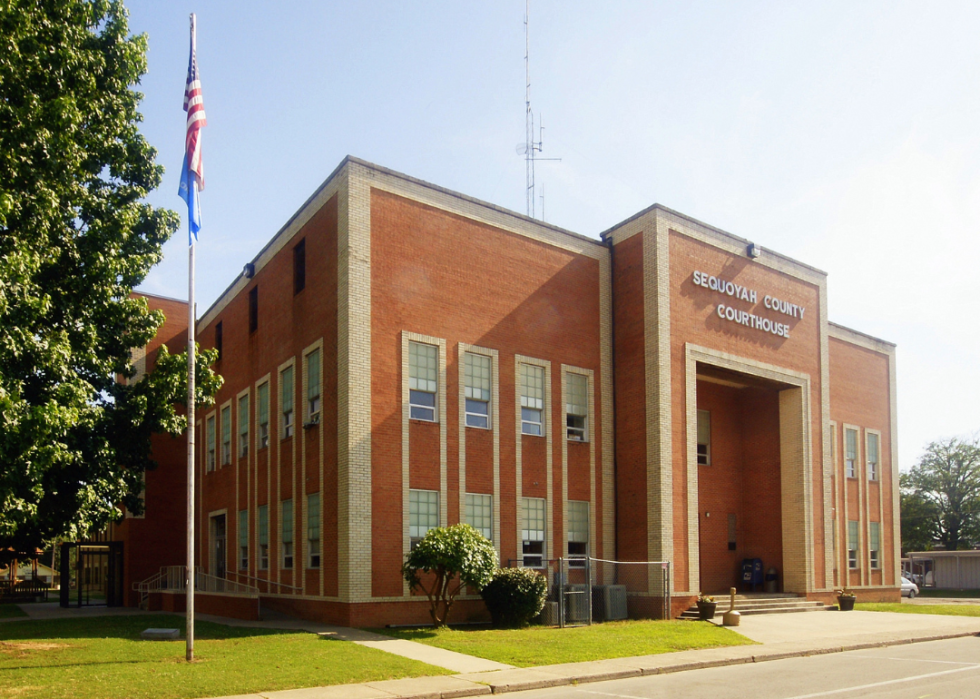
- Death rate for ischemic strokes, 2018-20: 21.6 per 100K people
- Death rate for hemorrhagic strokes, 2018-20: 10.0 per 100K people
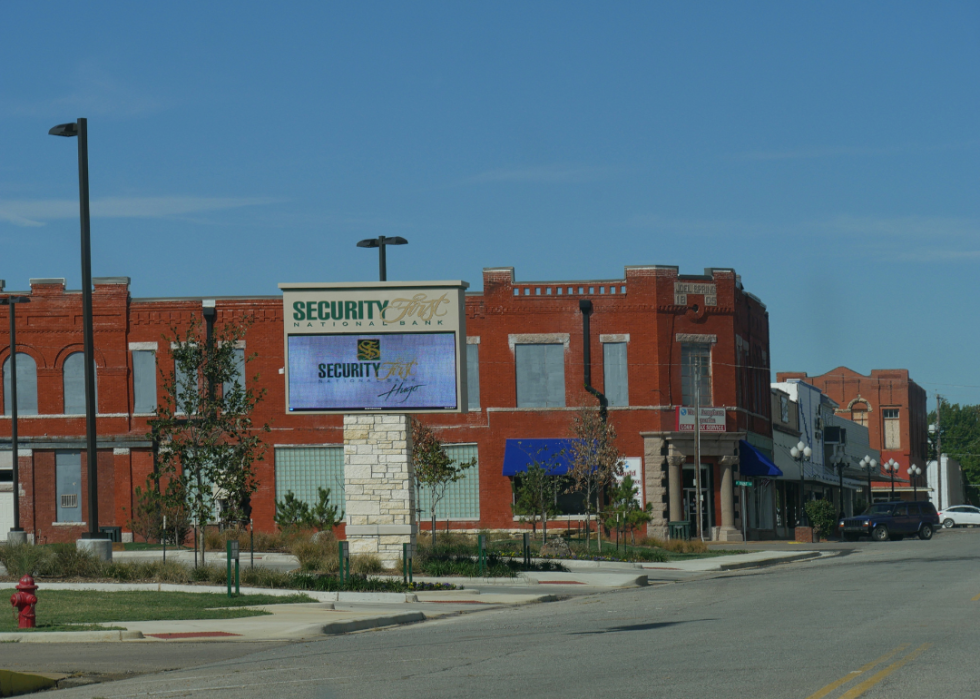
- Death rate for ischemic strokes, 2018-20: 22.1 per 100K people
- Death rate for hemorrhagic strokes, 2018-20: 12.5 per 100K people

- Death rate for ischemic strokes, 2018-20: 28.2 per 100K people
- Death rate for hemorrhagic strokes, 2018-20: 7.8 per 100K people
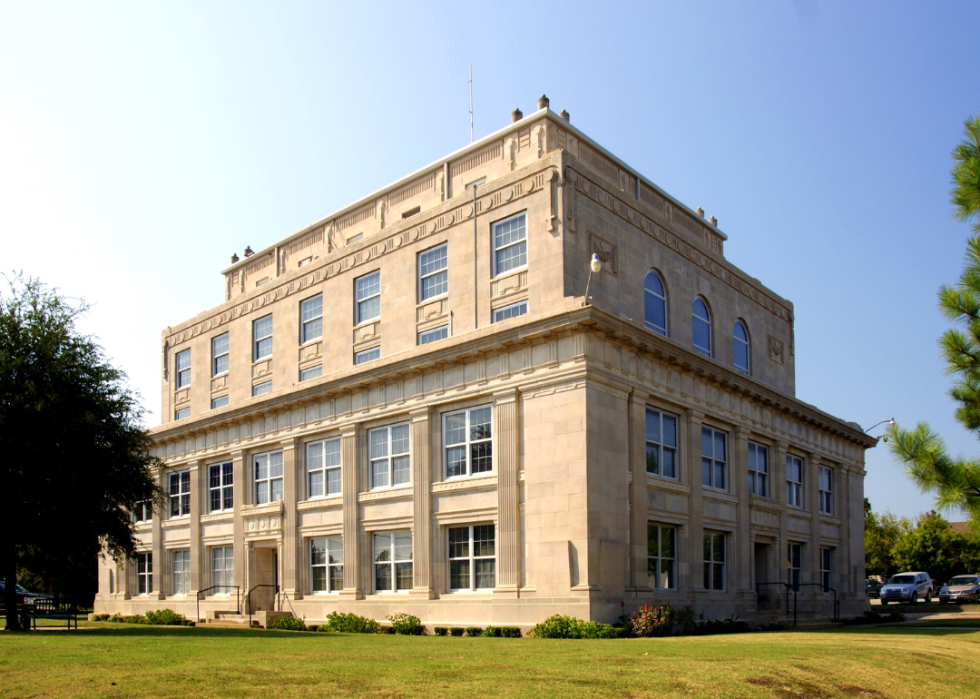
- Death rate for ischemic strokes, 2018-20: 29.0 per 100K people
- Death rate for hemorrhagic strokes, 2018-20: 7.5 per 100K people

- Death rate for ischemic strokes, 2018-20: 19.8 per 100K people
- Death rate for hemorrhagic strokes, 2018-20: 4.8 per 100K people
You may also like: See how Oklahoma will be affected if Roe v. Wade is overturned
This story features data reporting and writing by Emma Rubin and is part of a series utilizing data automation across 49 states.
