Counties with the most bridges in dire need of repair in Oklahoma

- Bridges in poor condition: 13.1% (35 of 268 bridges)
- Square meters of bridges in poor condition: 5.5% (4,643 of 84,163 square meters of bridges)
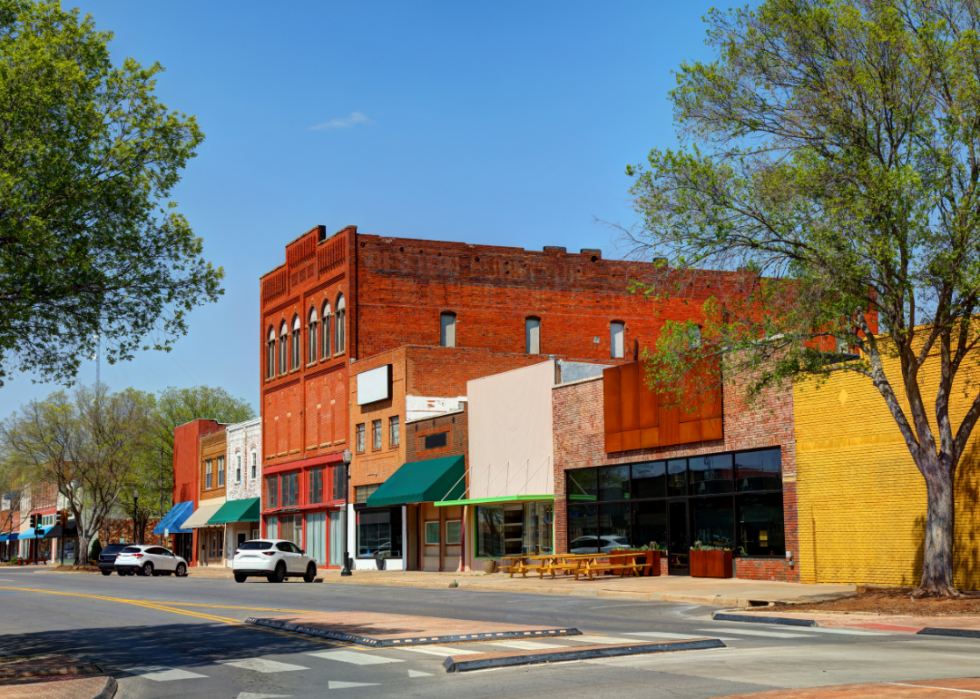
- Bridges in poor condition: 13.6% (53 of 391 bridges)
- Square meters of bridges in poor condition: 4.4% (5,413 of 121,882 square meters of bridges)
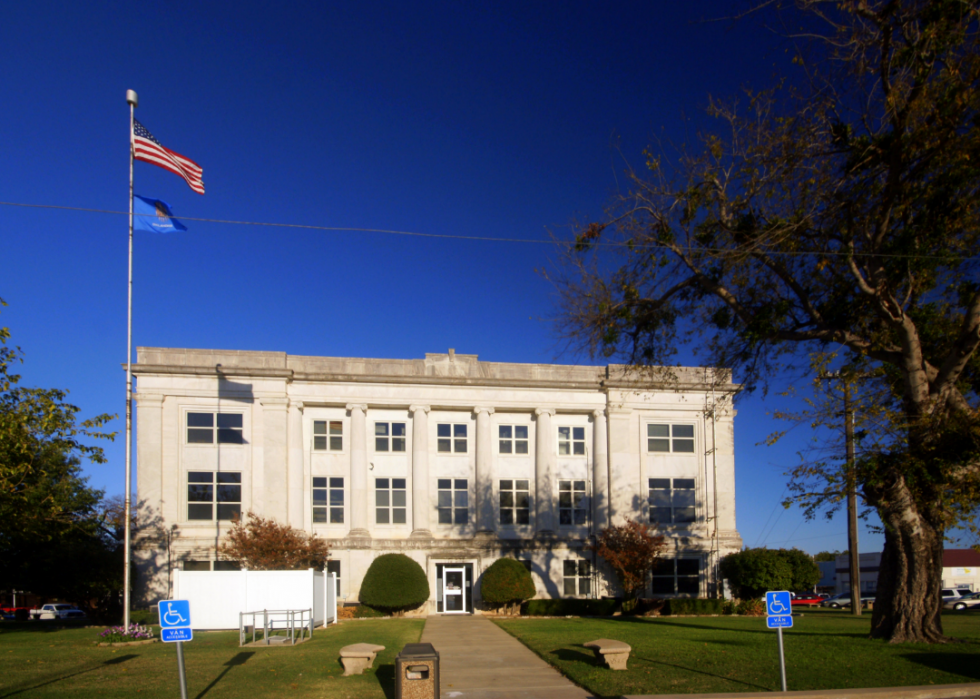
- Bridges in poor condition: 13.9% (11 of 79 bridges)
- Square meters of bridges in poor condition: 60.3% (20,169 of 33,448 square meters of bridges)
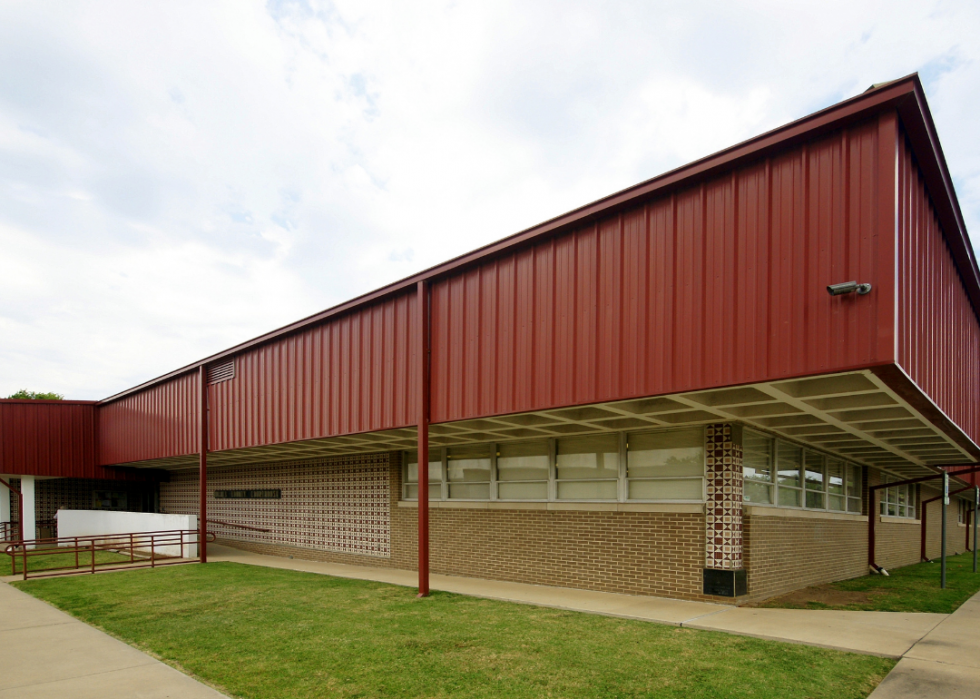
- Bridges in poor condition: 14.5% (32 of 221 bridges)
- Square meters of bridges in poor condition: 7.4% (4,575 of 61,697 square meters of bridges)

- Bridges in poor condition: 14.7% (77 of 525 bridges)
- Square meters of bridges in poor condition: 7.6% (7,019 of 92,917 square meters of bridges)
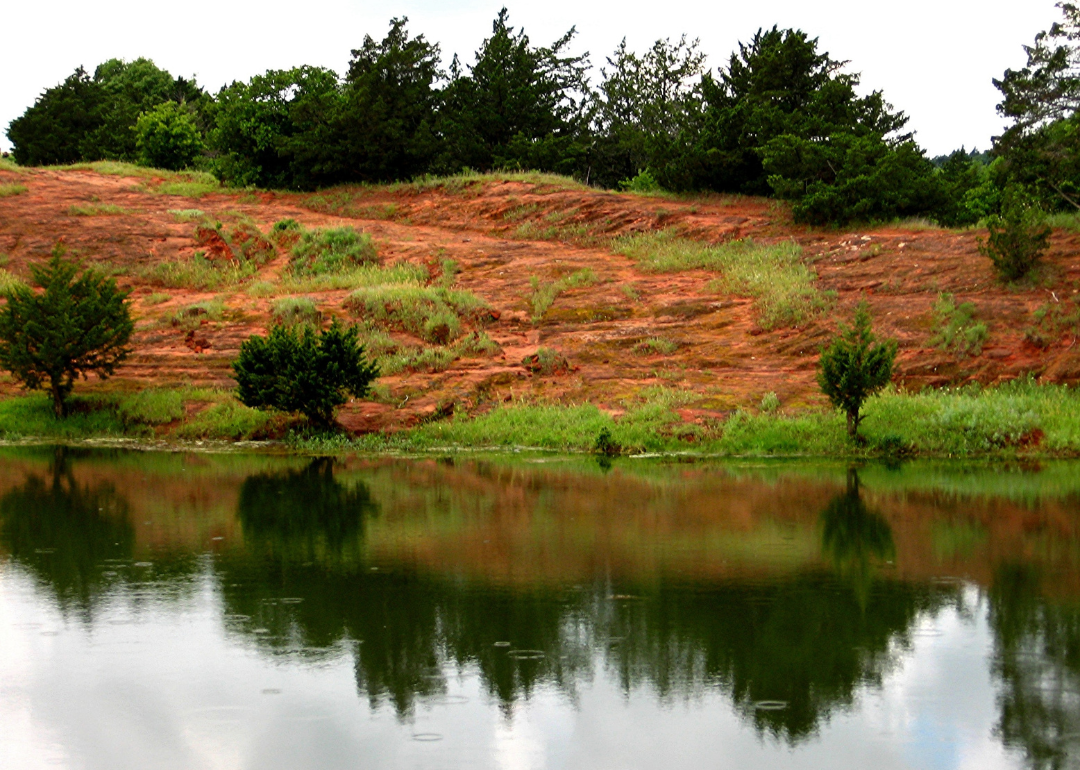
- Bridges in poor condition: 15.0% (65 of 433 bridges)
- Square meters of bridges in poor condition: 9.9% (10,094 of 101,641 square meters of bridges)

- Bridges in poor condition: 15.9% (37 of 233 bridges)
- Square meters of bridges in poor condition: 3.4% (4,603 of 135,982 square meters of bridges)

- Bridges in poor condition: 16.1% (50 of 310 bridges)
- Square meters of bridges in poor condition: 7.0% (5,692 of 81,429 square meters of bridges)

- Bridges in poor condition: 16.4% (58 of 353 bridges)
- Square meters of bridges in poor condition: 4.4% (4,383 of 100,258 square meters of bridges)

- Bridges in poor condition: 17.8% (32 of 180 bridges)
- Square meters of bridges in poor condition: 9.0% (5,746 of 63,522 square meters of bridges)

- Bridges in poor condition: 18.1% (29 of 160 bridges)
- Square meters of bridges in poor condition: 9.1% (7,660 of 84,053 square meters of bridges)

- Bridges in poor condition: 20.1% (80 of 398 bridges)
- Square meters of bridges in poor condition: 4.5% (6,870 of 153,476 square meters of bridges)

- Bridges in poor condition: 20.2% (46 of 228 bridges)
- Square meters of bridges in poor condition: 9.5% (7,240 of 76,014 square meters of bridges)

- Bridges in poor condition: 20.3% (75 of 369 bridges)
- Square meters of bridges in poor condition: 7.5% (9,316 of 123,647 square meters of bridges)
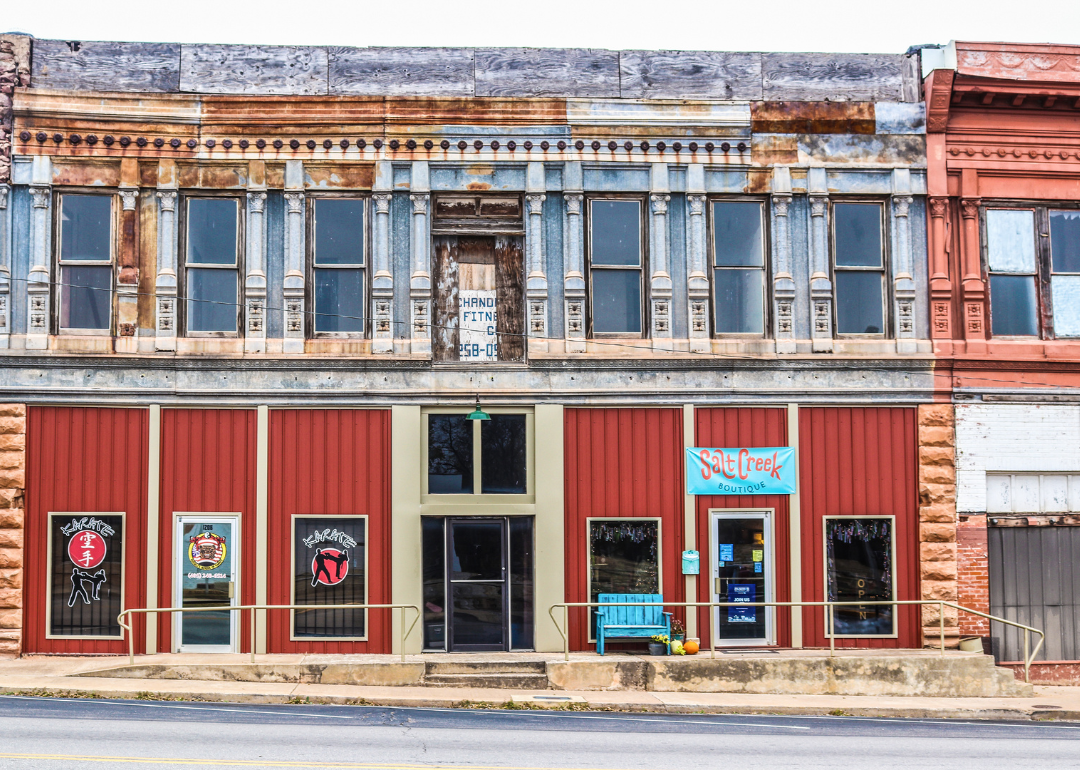
- Bridges in poor condition: 21.3% (105 of 493 bridges)
- Square meters of bridges in poor condition: 7.1% (7,699 of 108,022 square meters of bridges)

- Bridges in poor condition: 21.8% (115 of 528 bridges)
- Square meters of bridges in poor condition: 8.4% (8,309 of 99,144 square meters of bridges)

- Bridges in poor condition: 22.2% (39 of 176 bridges)
- Square meters of bridges in poor condition: 14.9% (10,812 of 72,788 square meters of bridges)
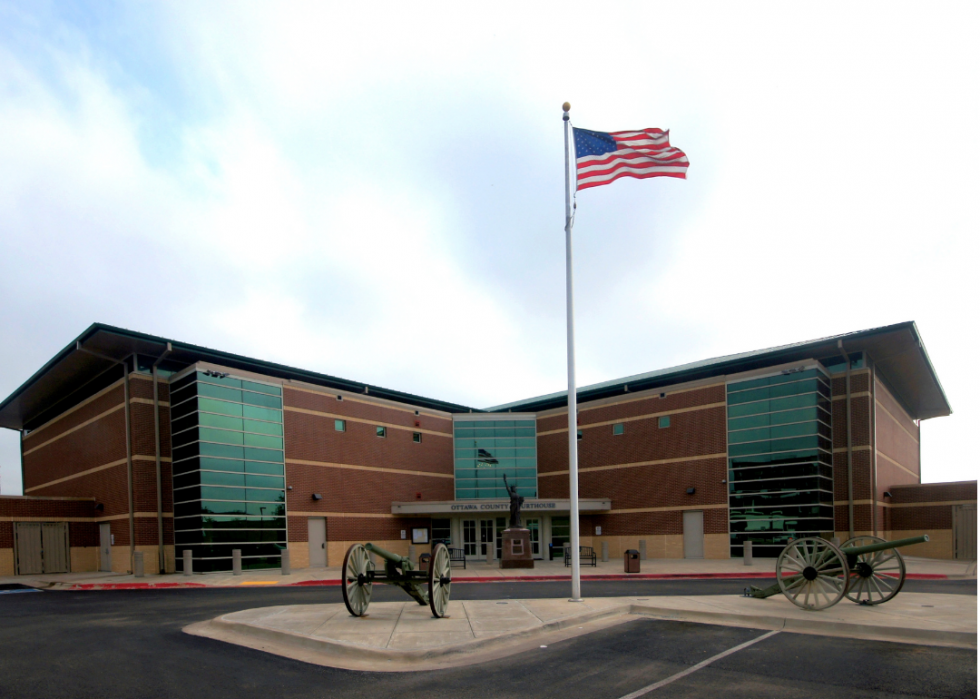
- Bridges in poor condition: 23.2% (63 of 272 bridges)
- Square meters of bridges in poor condition: 5.8% (6,204 of 106,564 square meters of bridges)
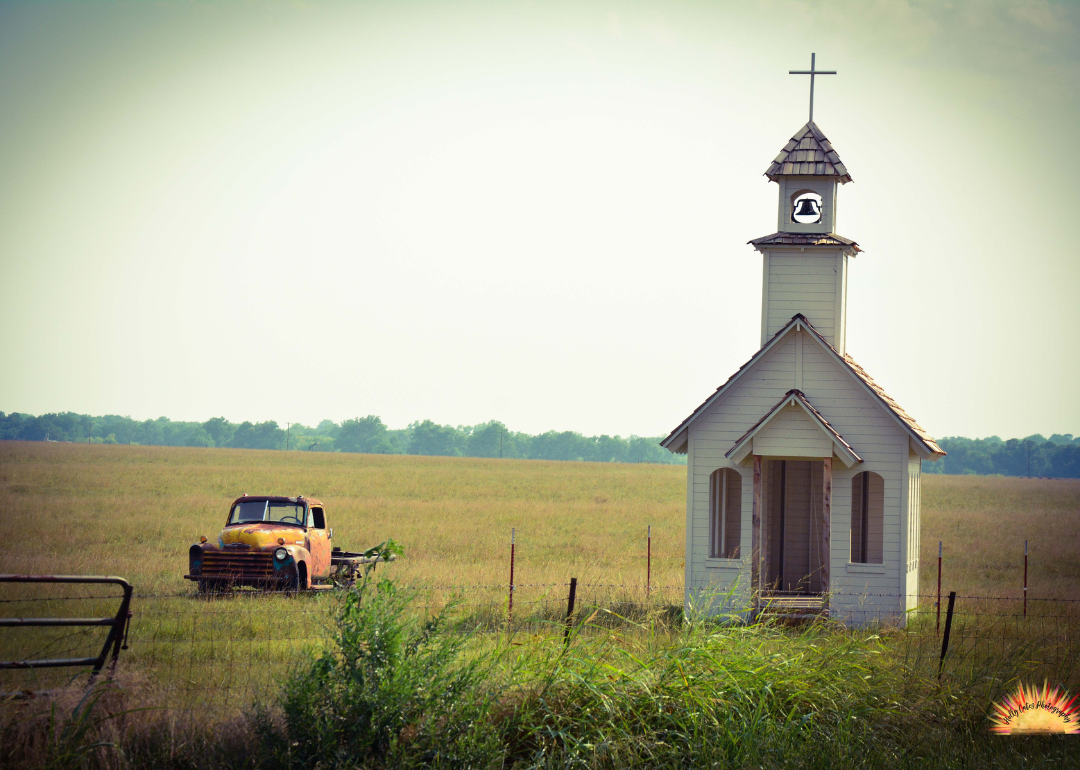
- Bridges in poor condition: 23.6% (78 of 331 bridges)
- Square meters of bridges in poor condition: 13.8% (11,688 of 84,649 square meters of bridges)
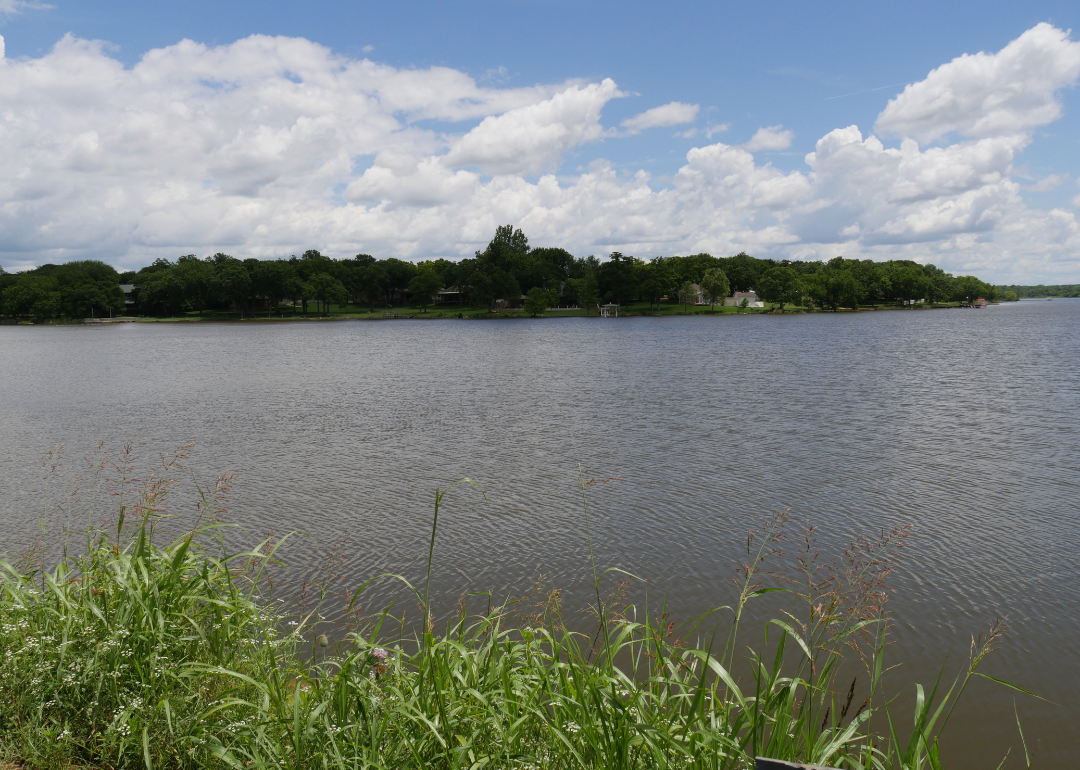
- Bridges in poor condition: 26.8% (80 of 298 bridges)
- Square meters of bridges in poor condition: 7.4% (6,811 of 92,020 square meters of bridges)
