Counties with the highest rates of strokes in Oregon
Yanqiang Dai // Shutterstock
- Age-adjusted rate of all strokes among adults, estimates for 2021: 2.3% (range between 2.0% and 2.7%)
- Death rate for ischemic strokes, 2018-20: 15.6 per 100K people
- Death rate for hemorrhagic strokes, 2018-20: 7.2 per 100K people
- Death rate for ischemic strokes, 2018-20: 15.6 per 100K people
- Death rate for hemorrhagic strokes, 2018-20: 7.2 per 100K people
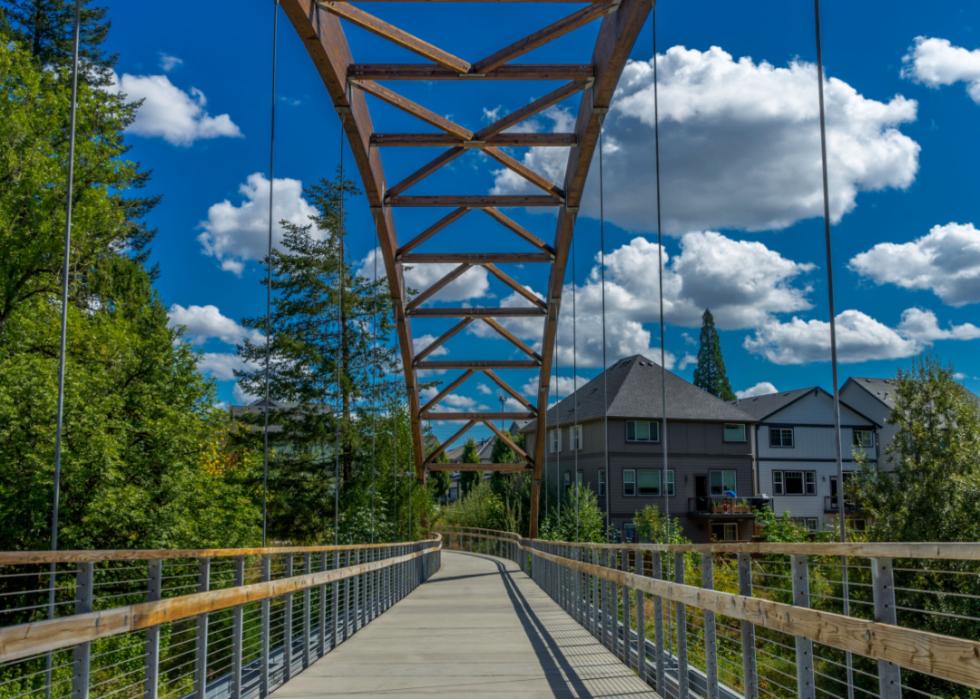
#36. Washington County

Canva
- Age-adjusted rate of all strokes among adults, estimates for 2021: 2.4% (range between 2.1% and 2.7%)
- Death rate for ischemic strokes, 2018-20: 15.4 per 100K people
- Death rate for hemorrhagic strokes, 2018-20: 7.9 per 100K people
- Death rate for ischemic strokes, 2018-20: 15.4 per 100K people
- Death rate for hemorrhagic strokes, 2018-20: 7.9 per 100K people
#35. Clackamas County
Josemaria Toscano // Shutterstock
- Age-adjusted rate of all strokes among adults, estimates for 2021: 2.5% (range between 2.2% and 2.8%)
- Death rate for ischemic strokes, 2018-20: 15.2 per 100K people
- Death rate for hemorrhagic strokes, 2018-20: 8.3 per 100K people
- Death rate for ischemic strokes, 2018-20: 15.2 per 100K people
- Death rate for hemorrhagic strokes, 2018-20: 8.3 per 100K people
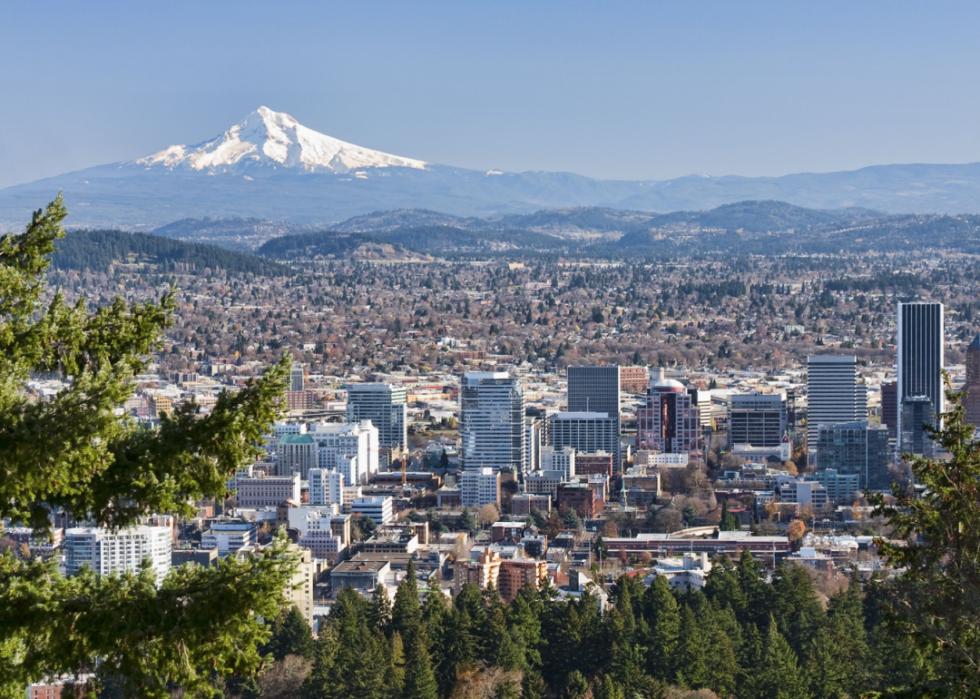
#34. Multnomah County
cpaulfell // Shutterstock
- Age-adjusted rate of all strokes among adults, estimates for 2021: 2.5% (range between 2.2% and 2.9%)
- Death rate for ischemic strokes, 2018-20: 17.2 per 100K people
- Death rate for hemorrhagic strokes, 2018-20: 8.3 per 100K people
- Death rate for ischemic strokes, 2018-20: 17.2 per 100K people
- Death rate for hemorrhagic strokes, 2018-20: 8.3 per 100K people
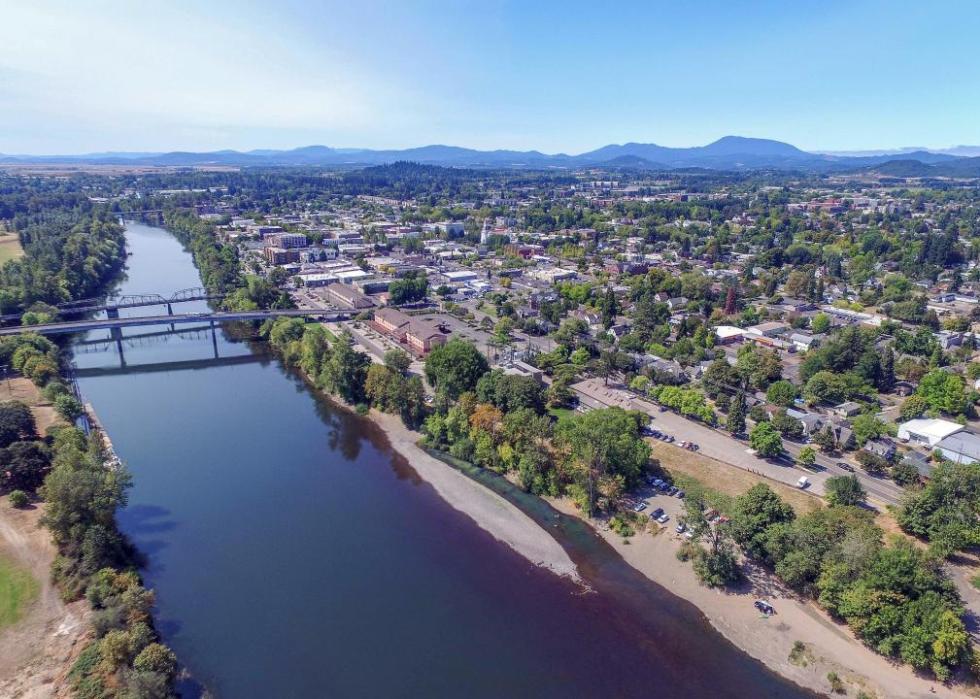
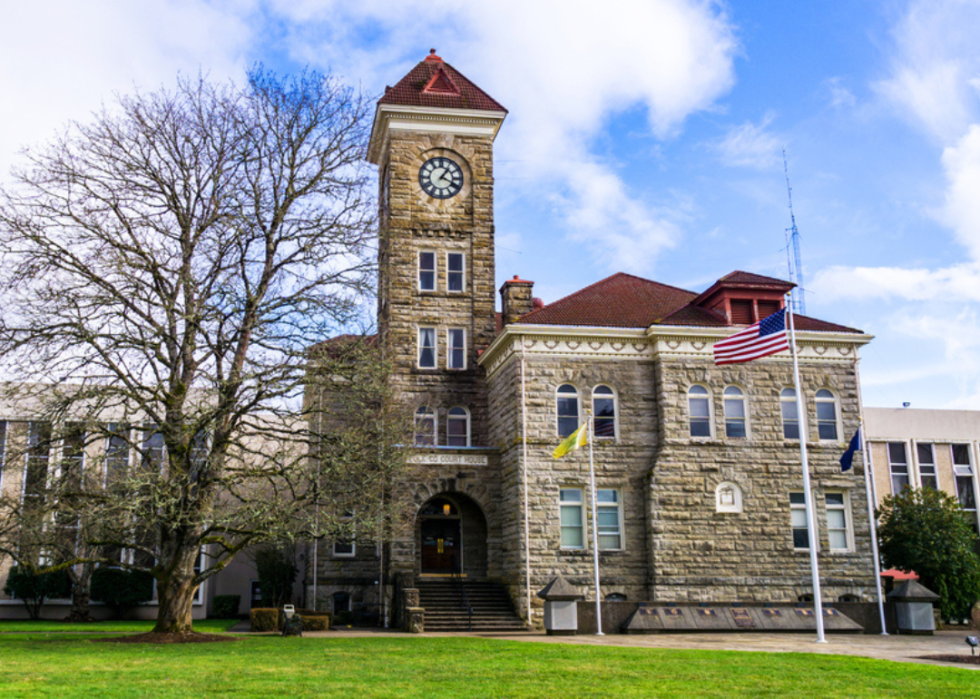
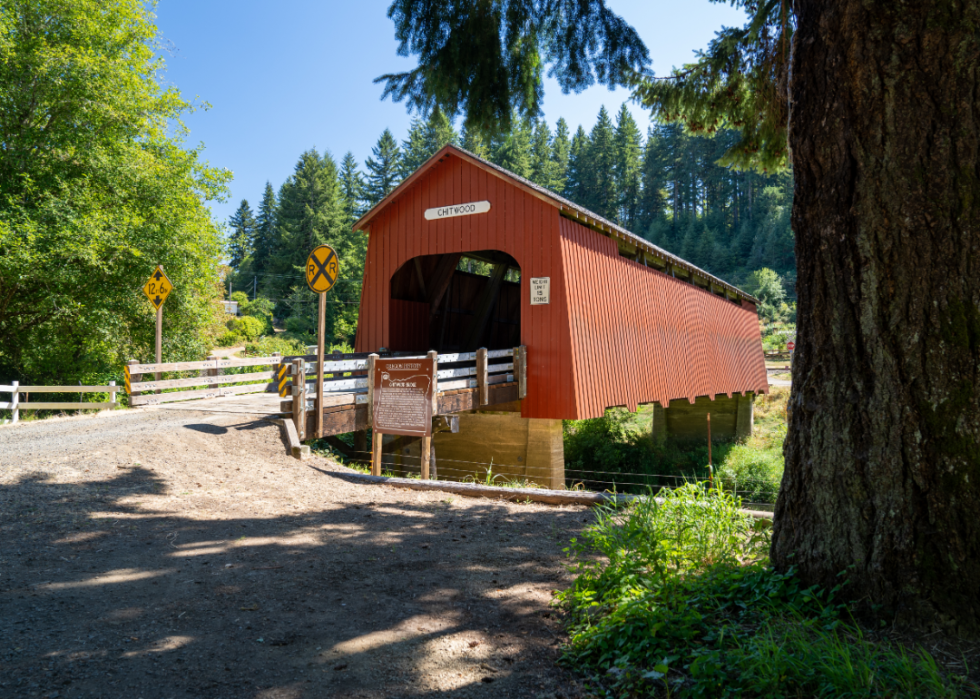
#33. Benton County
Canva
- Age-adjusted rate of all strokes among adults, estimates for 2021: 2.5% (range between 2.1% and 2.8%)
- Death rate for ischemic strokes, 2018-20: 18.2 per 100K people
- Death rate for hemorrhagic strokes, 2018-20: 7.5 per 100K people
- Death rate for ischemic strokes, 2018-20: 18.2 per 100K people
- Death rate for hemorrhagic strokes, 2018-20: 7.5 per 100K people
You may also like: Most popular baby names for girls of the last decade in Oregon
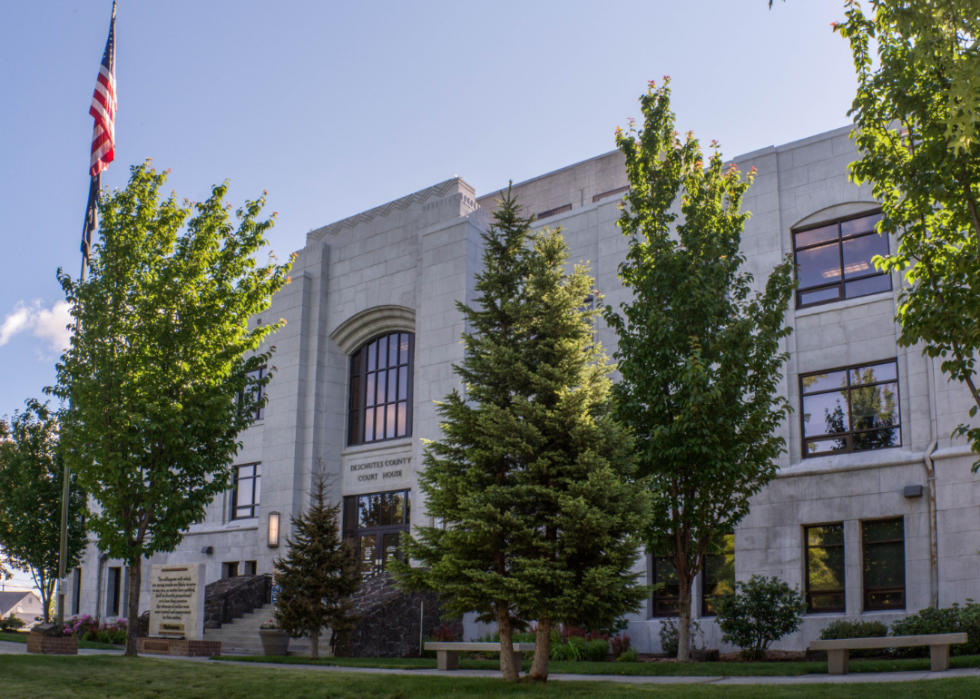
#32. Deschutes County
Canva
- Age-adjusted rate of all strokes among adults, estimates for 2021: 2.6% (range between 2.3% and 3.0%)
- Death rate for ischemic strokes, 2018-20: 16.1 per 100K people
- Death rate for hemorrhagic strokes, 2018-20: 8.3 per 100K people
- Death rate for ischemic strokes, 2018-20: 16.1 per 100K people
- Death rate for hemorrhagic strokes, 2018-20: 8.3 per 100K people
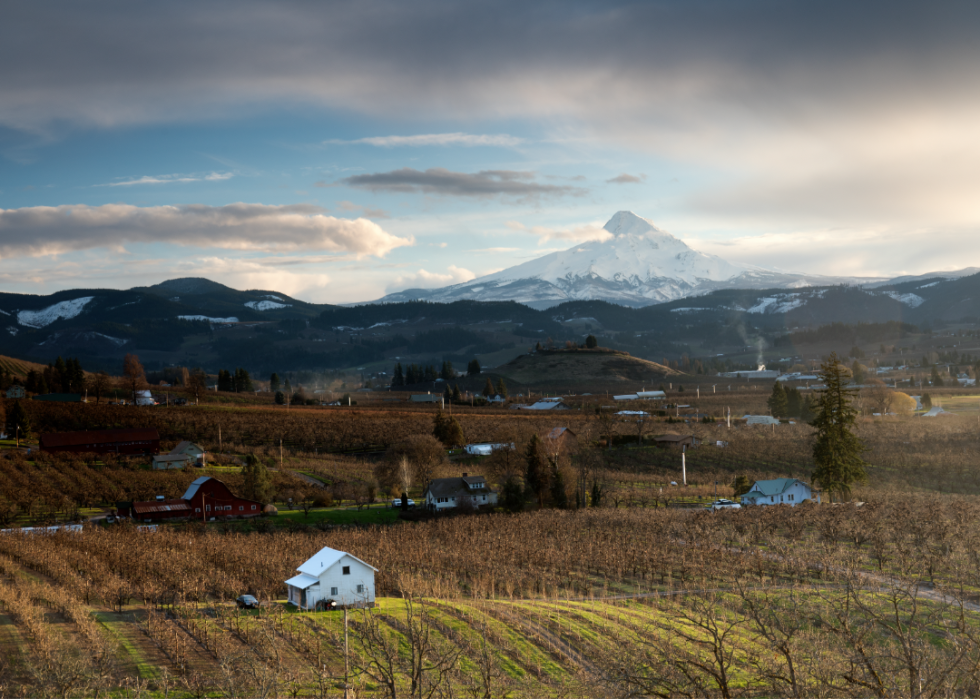
#31. Hood River County
Canva
- Age-adjusted rate of all strokes among adults, estimates for 2021: 2.6% (range between 2.3% and 3.0%)
- Death rate for ischemic strokes, 2018-20: 17.2 per 100K people
- Death rate for hemorrhagic strokes, 2018-20: 8.1 per 100K people
- Death rate for ischemic strokes, 2018-20: 17.2 per 100K people
- Death rate for hemorrhagic strokes, 2018-20: 8.1 per 100K people
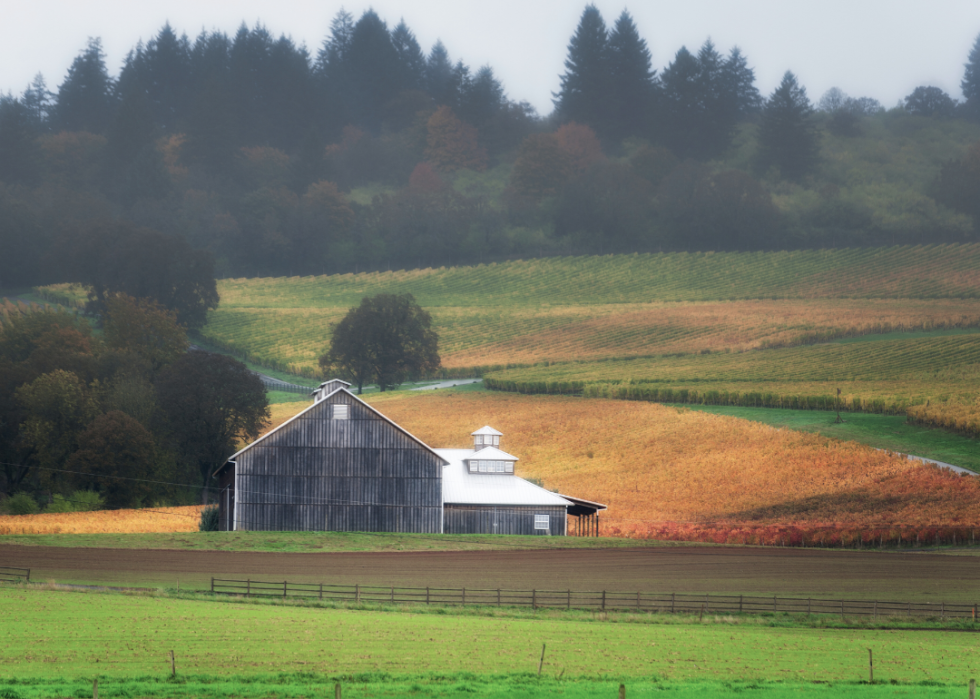
#30. Yamhill County
Canva
- Age-adjusted rate of all strokes among adults, estimates for 2021: 2.6% (range between 2.2% and 2.9%)
- Death rate for ischemic strokes, 2018-20: 19.5 per 100K people
- Death rate for hemorrhagic strokes, 2018-20: 8.1 per 100K people
- Death rate for ischemic strokes, 2018-20: 19.5 per 100K people
- Death rate for hemorrhagic strokes, 2018-20: 8.1 per 100K people
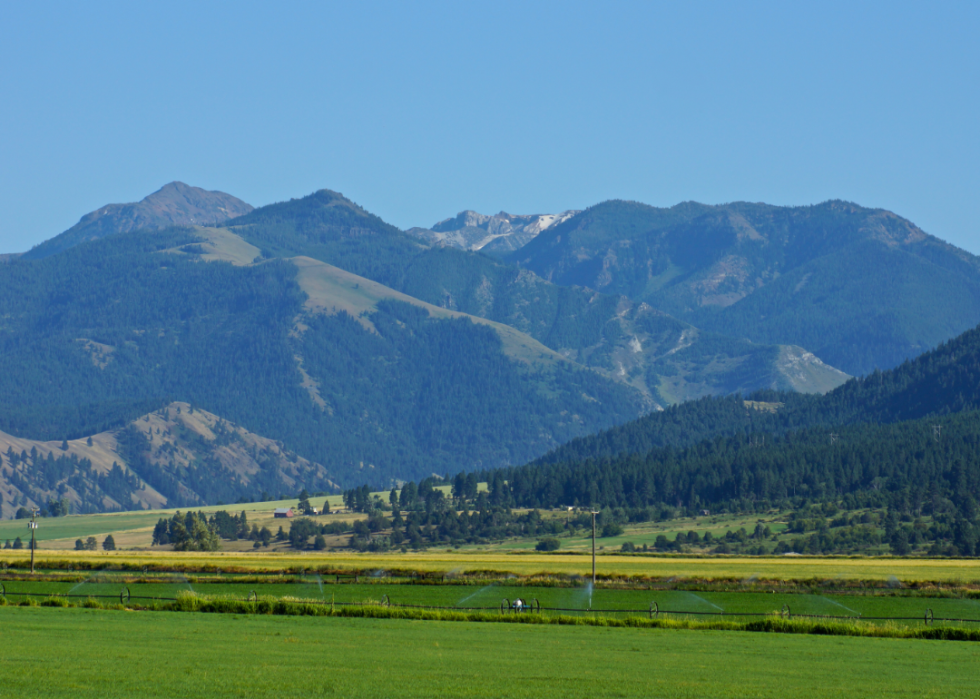
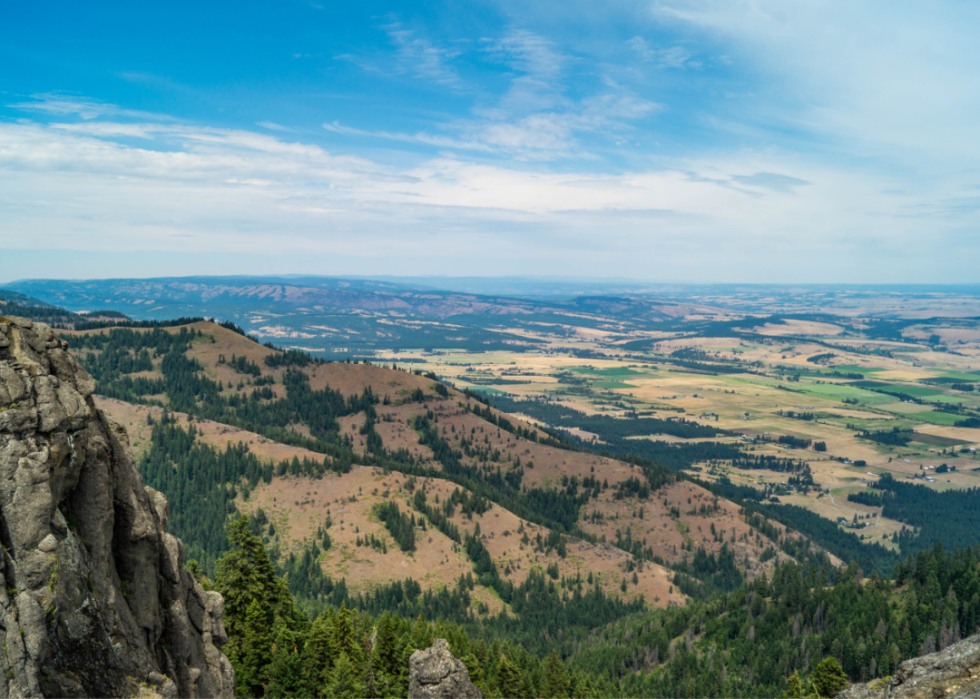
#29. Wallowa County
Canva
- Age-adjusted rate of all strokes among adults, estimates for 2021: 2.7% (range between 2.4% and 3.1%)
- Death rate for ischemic strokes, 2018-20: 14.6 per 100K people
- Death rate for hemorrhagic strokes, 2018-20: 6.5 per 100K people
- Death rate for ischemic strokes, 2018-20: 14.6 per 100K people
- Death rate for hemorrhagic strokes, 2018-20: 6.5 per 100K people
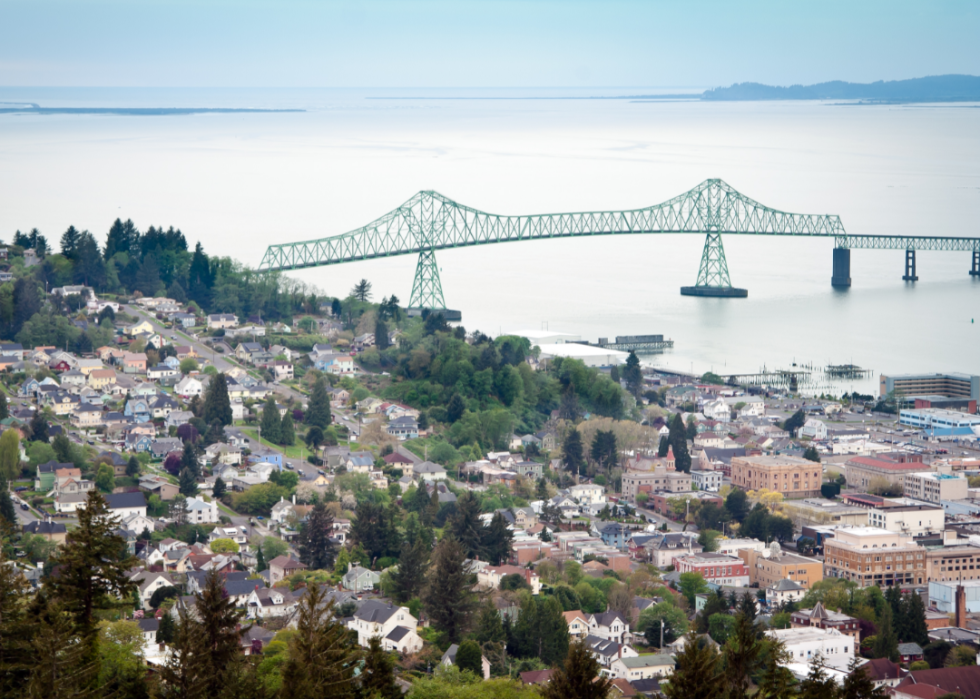
#28. Clatsop County
Cynthia Liang // Shutterstock
- Age-adjusted rate of all strokes among adults, estimates for 2021: 2.7% (range between 2.4% and 3.1%)
- Death rate for ischemic strokes, 2018-20: 18.5 per 100K people
- Death rate for hemorrhagic strokes, 2018-20: 9.2 per 100K people
- Death rate for ischemic strokes, 2018-20: 18.5 per 100K people
- Death rate for hemorrhagic strokes, 2018-20: 9.2 per 100K people
You may also like: Counties with the highest COVID-19 vaccination rate in Oregon
#27. Polk County
kenneth korb // Shutterstock
- Age-adjusted rate of all strokes among adults, estimates for 2021: 2.8% (range between 2.4% and 3.1%)
- Death rate for ischemic strokes, 2018-20: 15.3 per 100K people
- Death rate for hemorrhagic strokes, 2018-20: 7.9 per 100K people
- Death rate for ischemic strokes, 2018-20: 15.3 per 100K people
- Death rate for hemorrhagic strokes, 2018-20: 7.9 per 100K people
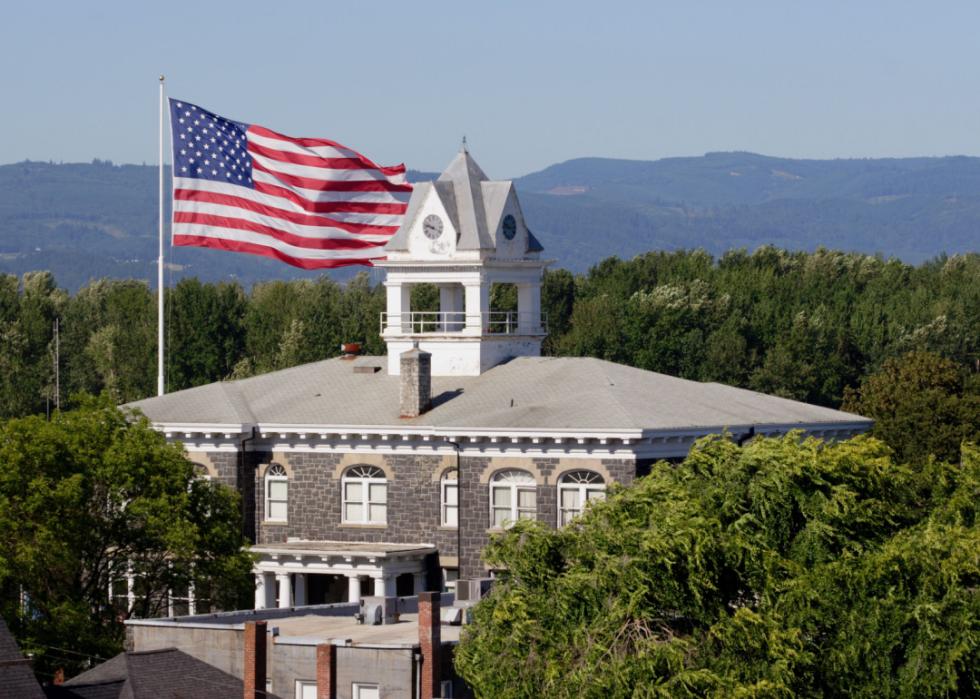
#26. Columbia County
Canva
- Age-adjusted rate of all strokes among adults, estimates for 2021: 2.8% (range between 2.4% and 3.2%)
- Death rate for ischemic strokes, 2018-20: 15.6 per 100K people
- Death rate for hemorrhagic strokes, 2018-20: 7.2 per 100K people
- Death rate for ischemic strokes, 2018-20: 15.6 per 100K people
- Death rate for hemorrhagic strokes, 2018-20: 7.2 per 100K people
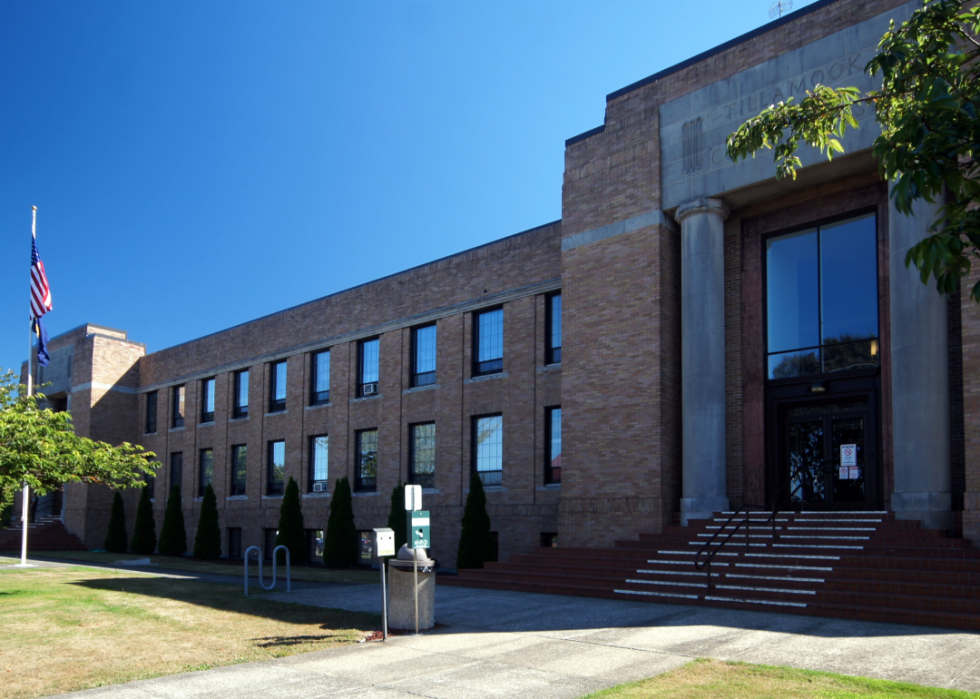
#25. Tillamook County
Canva
- Age-adjusted rate of all strokes among adults, estimates for 2021: 2.8% (range between 2.4% and 3.1%)
- Death rate for ischemic strokes, 2018-20: 18.1 per 100K people
- Death rate for hemorrhagic strokes, 2018-20: 6.0 per 100K people
- Death rate for ischemic strokes, 2018-20: 18.1 per 100K people
- Death rate for hemorrhagic strokes, 2018-20: 6.0 per 100K people
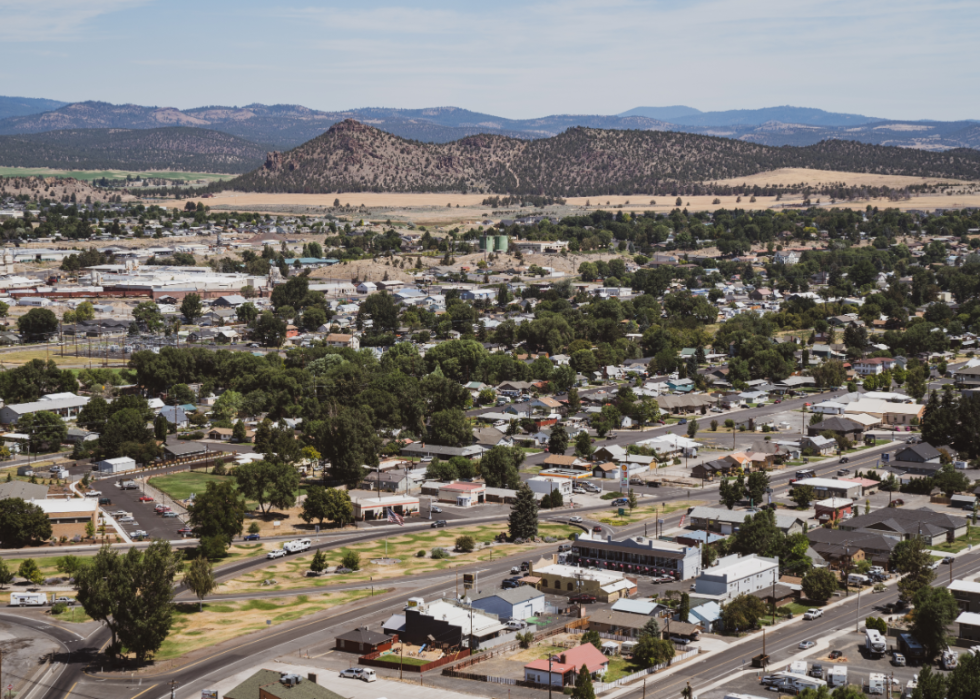
#24. Crook County
Canva
- Age-adjusted rate of all strokes among adults, estimates for 2021: 2.8% (range between 2.4% and 3.2%)
- Death rate for ischemic strokes, 2018-20: 19.5 per 100K people
- Death rate for hemorrhagic strokes, 2018-20: 8.1 per 100K people
- Death rate for ischemic strokes, 2018-20: 19.5 per 100K people
- Death rate for hemorrhagic strokes, 2018-20: 8.1 per 100K people
#23. Lincoln County
Canva
- Age-adjusted rate of all strokes among adults, estimates for 2021: 2.8% (range between 2.5% and 3.2%)
- Death rate for ischemic strokes, 2018-20: 20.1 per 100K people
- Death rate for hemorrhagic strokes, 2018-20: 8.9 per 100K people
- Death rate for ischemic strokes, 2018-20: 20.1 per 100K people
- Death rate for hemorrhagic strokes, 2018-20: 8.9 per 100K people
You may also like: 17% of people live near toxic release facilities—here's how it breaks down in Oregon
#22. Union County
Canva
- Age-adjusted rate of all strokes among adults, estimates for 2021: 2.8% (range between 2.4% and 3.2%)
- Death rate for ischemic strokes, 2018-20: 21.5 per 100K people
- Death rate for hemorrhagic strokes, 2018-20: 7.8 per 100K people
- Death rate for ischemic strokes, 2018-20: 21.5 per 100K people
- Death rate for hemorrhagic strokes, 2018-20: 7.8 per 100K people
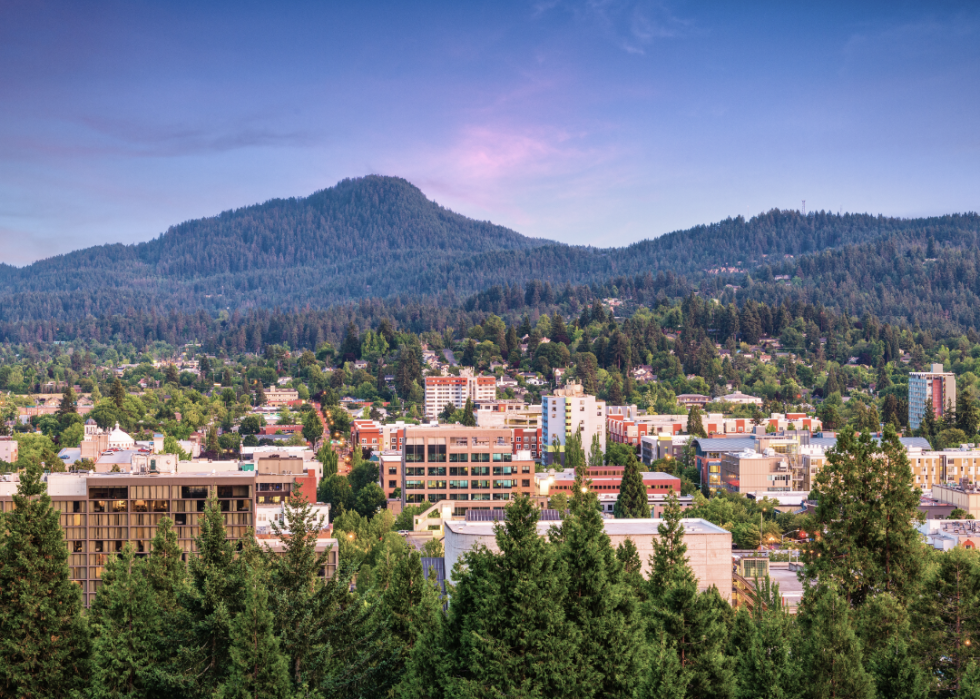
#21. Lane County

Manuela Durson // Shutterstock
- Age-adjusted rate of all strokes among adults, estimates for 2021: 2.8% (range between 2.5% and 3.2%)
- Death rate for ischemic strokes, 2018-20: 21.5 per 100K people
- Death rate for hemorrhagic strokes, 2018-20: 8.6 per 100K people
- Death rate for ischemic strokes, 2018-20: 21.5 per 100K people
- Death rate for hemorrhagic strokes, 2018-20: 8.6 per 100K people
#20. Curry County

Canva
- Age-adjusted rate of all strokes among adults, estimates for 2021: 2.8% (range between 2.4% and 3.2%)
- Death rate for ischemic strokes, 2018-20: 22.4 per 100K people
- Death rate for hemorrhagic strokes, 2018-20: 7.9 per 100K people
- Death rate for ischemic strokes, 2018-20: 22.4 per 100K people
- Death rate for hemorrhagic strokes, 2018-20: 7.9 per 100K people
#19. Jackson County
Canva
- Age-adjusted rate of all strokes among adults, estimates for 2021: 2.9% (range between 2.5% and 3.3%)
- Death rate for ischemic strokes, 2018-20: 16.5 per 100K people
- Death rate for hemorrhagic strokes, 2018-20: 6.1 per 100K people
- Death rate for ischemic strokes, 2018-20: 16.5 per 100K people
- Death rate for hemorrhagic strokes, 2018-20: 6.1 per 100K people
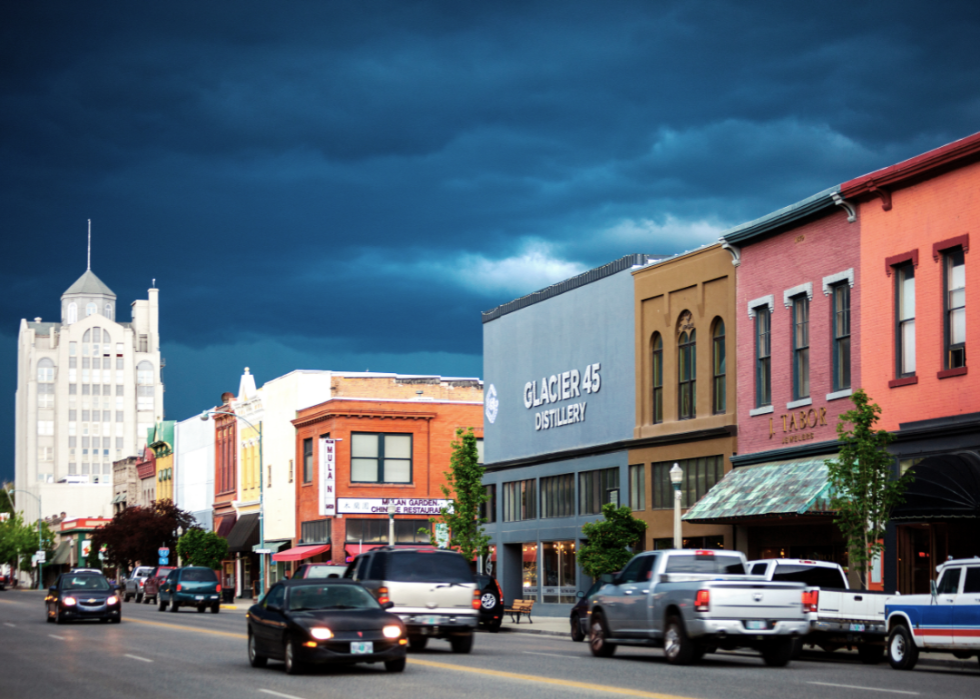
#18. Baker County
Canva
- Age-adjusted rate of all strokes among adults, estimates for 2021: 2.9% (range between 2.6% and 3.3%)
- Death rate for ischemic strokes, 2018-20: 18.4 per 100K people
- Death rate for hemorrhagic strokes, 2018-20: 8.6 per 100K people
- Death rate for ischemic strokes, 2018-20: 18.4 per 100K people
- Death rate for hemorrhagic strokes, 2018-20: 8.6 per 100K people
You may also like: Most valuable crops grown in Oregon
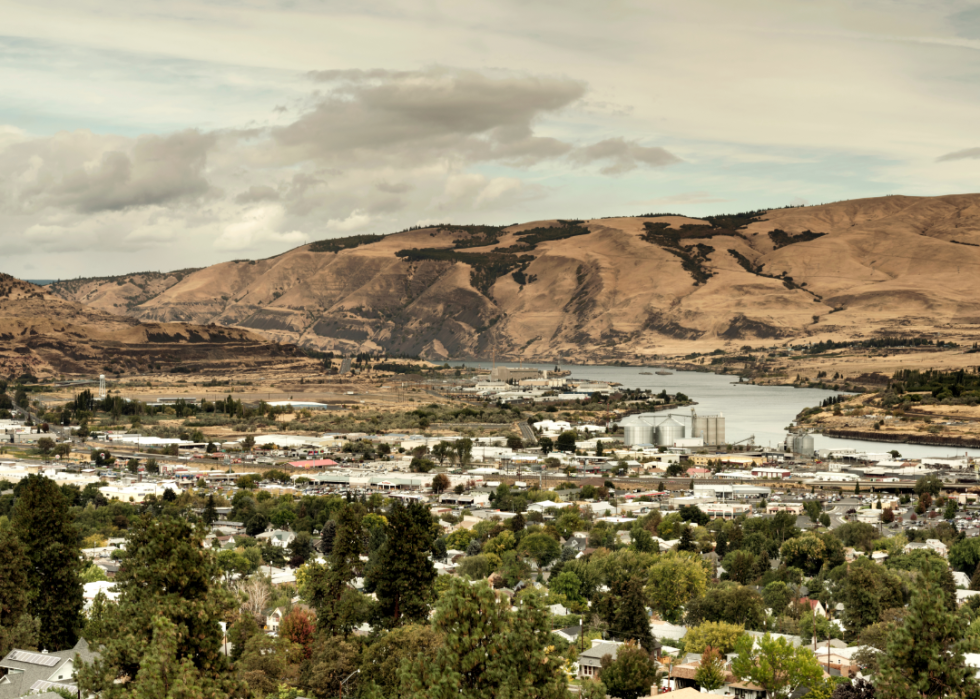
#17. Wasco County
Canva
- Age-adjusted rate of all strokes among adults, estimates for 2021: 2.9% (range between 2.5% and 3.3%)
- Death rate for ischemic strokes, 2018-20: 19.0 per 100K people
- Death rate for hemorrhagic strokes, 2018-20: 8.7 per 100K people
- Death rate for ischemic strokes, 2018-20: 19.0 per 100K people
- Death rate for hemorrhagic strokes, 2018-20: 8.7 per 100K people
#16. Linn County
Canva
- Age-adjusted rate of all strokes among adults, estimates for 2021: 2.9% (range between 2.6% and 3.3%)
- Death rate for ischemic strokes, 2018-20: 19.0 per 100K people
- Death rate for hemorrhagic strokes, 2018-20: 8.9 per 100K people
- Death rate for ischemic strokes, 2018-20: 19.0 per 100K people
- Death rate for hemorrhagic strokes, 2018-20: 8.9 per 100K people
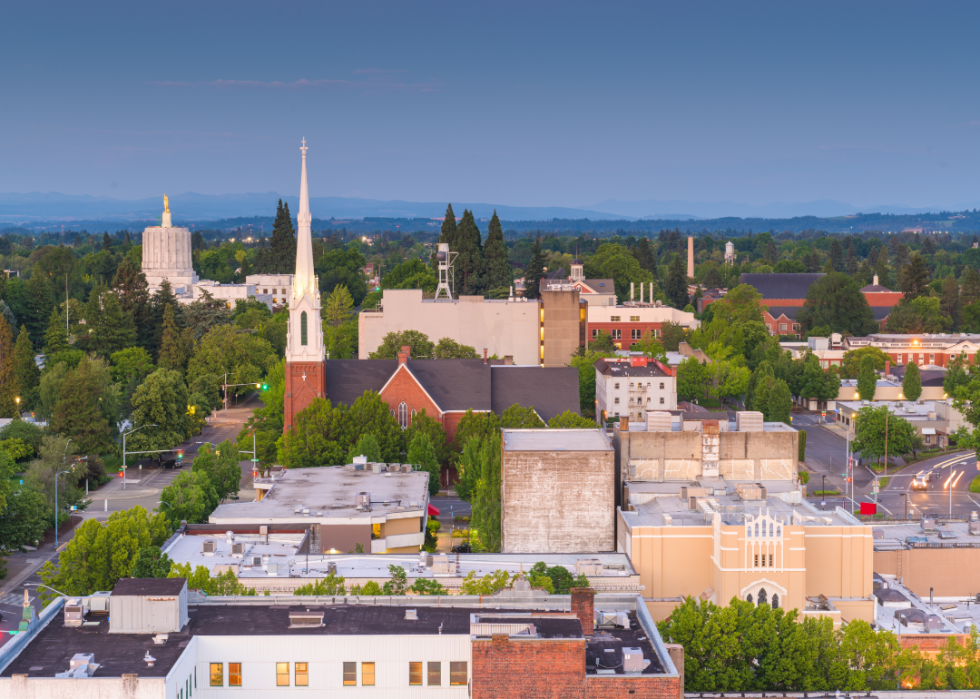
#15. Marion County

Dee Browning // Shutterstock
- Age-adjusted rate of all strokes among adults, estimates for 2021: 2.9% (range between 2.6% and 3.3%)
- Death rate for ischemic strokes, 2018-20: 20.6 per 100K people
- Death rate for hemorrhagic strokes, 2018-20: 8.3 per 100K people
- Death rate for ischemic strokes, 2018-20: 20.6 per 100K people
- Death rate for hemorrhagic strokes, 2018-20: 8.3 per 100K people
#14. Grant County

Canva
- Age-adjusted rate of all strokes among adults, estimates for 2021: 2.9% (range between 2.6% and 3.3%)
- Death rate for ischemic strokes, 2018-20: 22.0 per 100K people
- Death rate for hemorrhagic strokes, 2018-20: 8.2 per 100K people
- Death rate for ischemic strokes, 2018-20: 22.0 per 100K people
- Death rate for hemorrhagic strokes, 2018-20: 8.2 per 100K people
#13. Douglas County

Arpad Jasko // Shutterstock
- Age-adjusted rate of all strokes among adults, estimates for 2021: 2.9% (range between 2.5% and 3.3%)
- Death rate for ischemic strokes, 2018-20: 24.1 per 100K people
- Death rate for hemorrhagic strokes, 2018-20: 8.5 per 100K people
- Death rate for ischemic strokes, 2018-20: 24.1 per 100K people
- Death rate for hemorrhagic strokes, 2018-20: 8.5 per 100K people
You may also like: See how Oregon will be affected if Roe v. Wade is overturned
#12. Gilliam County
Bob Pool // Shutterstock
- Age-adjusted rate of all strokes among adults, estimates for 2021: 3.0% (range between 2.7% and 3.4%)
- Death rate for ischemic strokes, 2018-20: 19.0 per 100K people
- Death rate for hemorrhagic strokes, 2018-20: 9.3 per 100K people
- Death rate for ischemic strokes, 2018-20: 19.0 per 100K people
- Death rate for hemorrhagic strokes, 2018-20: 9.3 per 100K people
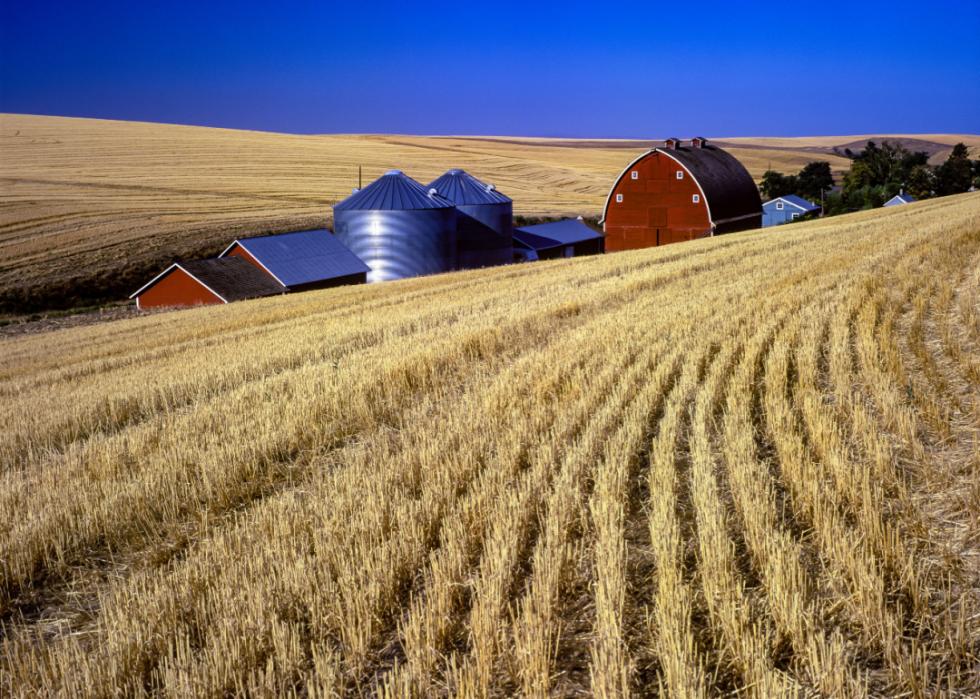
#11. Umatilla County
Canva
- Age-adjusted rate of all strokes among adults, estimates for 2021: 3.0% (range between 2.6% and 3.4%)
- Death rate for ischemic strokes, 2018-20: 21.4 per 100K people
- Death rate for hemorrhagic strokes, 2018-20: 8.1 per 100K people
- Death rate for ischemic strokes, 2018-20: 21.4 per 100K people
- Death rate for hemorrhagic strokes, 2018-20: 8.1 per 100K people
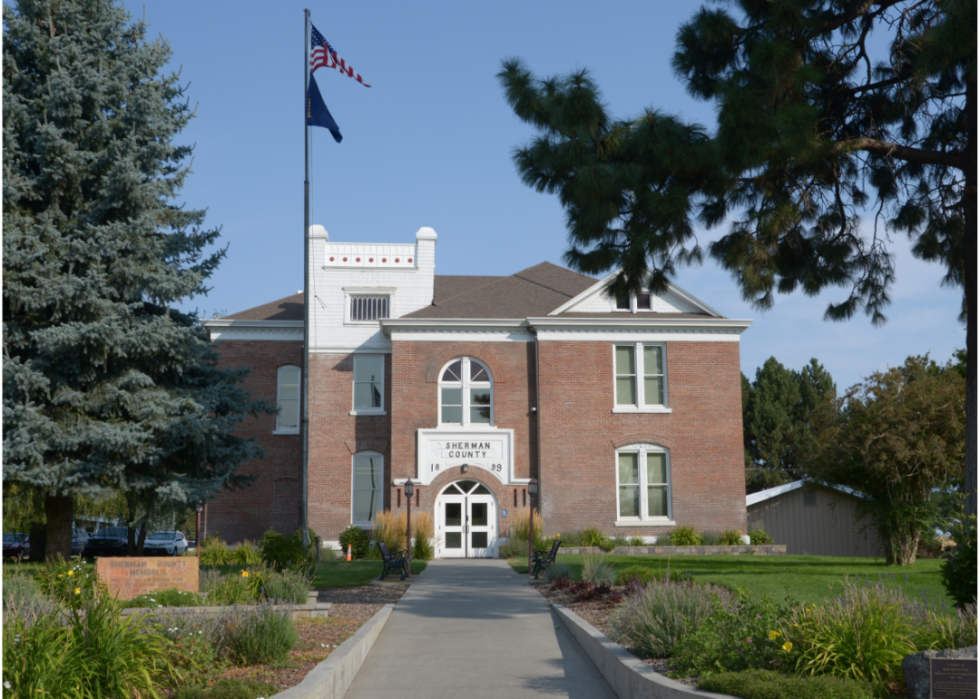
#10. Sherman County
Canva
- Age-adjusted rate of all strokes among adults, estimates for 2021: 3.0% (range between 2.7% and 3.4%)
- Death rate for ischemic strokes, 2018-20: 21.7 per 100K people
- Death rate for hemorrhagic strokes, 2018-20: 9.1 per 100K people
- Death rate for ischemic strokes, 2018-20: 21.7 per 100K people
- Death rate for hemorrhagic strokes, 2018-20: 9.1 per 100K people
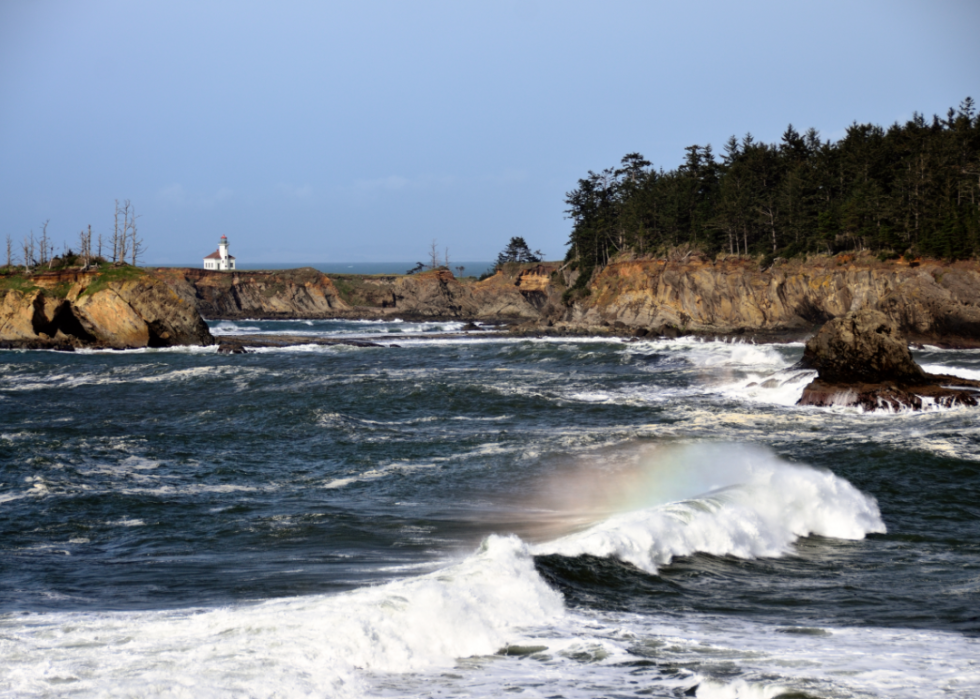
#9. Coos County

Tomas Nevesely // Shutterstock
- Age-adjusted rate of all strokes among adults, estimates for 2021: 3.0% (range between 2.6% and 3.4%)
- Death rate for ischemic strokes, 2018-20: 25.1 per 100K people
- Death rate for hemorrhagic strokes, 2018-20: 7.9 per 100K people
- Death rate for ischemic strokes, 2018-20: 25.1 per 100K people
- Death rate for hemorrhagic strokes, 2018-20: 7.9 per 100K people
#8. Wheeler County
Canva
- Age-adjusted rate of all strokes among adults, estimates for 2021: 3.1% (range between 2.8% and 3.5%)
- Death rate for ischemic strokes, 2018-20: 16.6 per 100K people
- Death rate for hemorrhagic strokes, 2018-20: 8.3 per 100K people
- Death rate for ischemic strokes, 2018-20: 16.6 per 100K people
- Death rate for hemorrhagic strokes, 2018-20: 8.3 per 100K people
You may also like: Best private high schools in Oregon
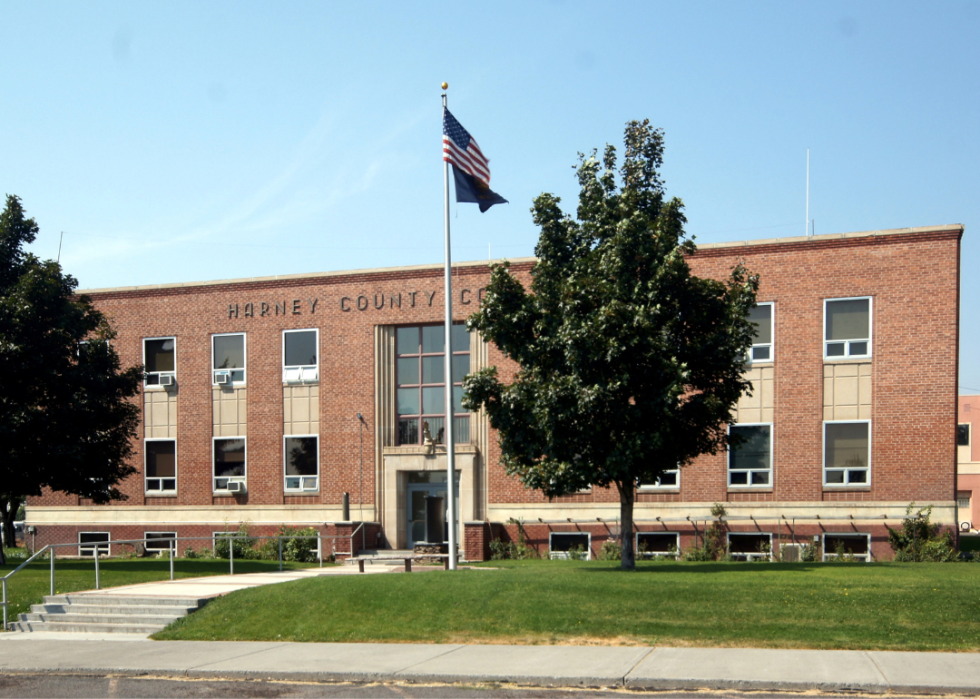
#7. Harney County
Canva
- Age-adjusted rate of all strokes among adults, estimates for 2021: 3.1% (range between 2.7% and 3.5%)
- Death rate for ischemic strokes, 2018-20: 19.3 per 100K people
- Death rate for hemorrhagic strokes, 2018-20: 8.5 per 100K people
- Death rate for ischemic strokes, 2018-20: 19.3 per 100K people
- Death rate for hemorrhagic strokes, 2018-20: 8.5 per 100K people
#6. Jefferson County
Bob Pool // Shutterstock
- Age-adjusted rate of all strokes among adults, estimates for 2021: 3.1% (range between 2.7% and 3.5%)
- Death rate for ischemic strokes, 2018-20: 22.3 per 100K people
- Death rate for hemorrhagic strokes, 2018-20: 7.8 per 100K people
- Death rate for ischemic strokes, 2018-20: 22.3 per 100K people
- Death rate for hemorrhagic strokes, 2018-20: 7.8 per 100K people
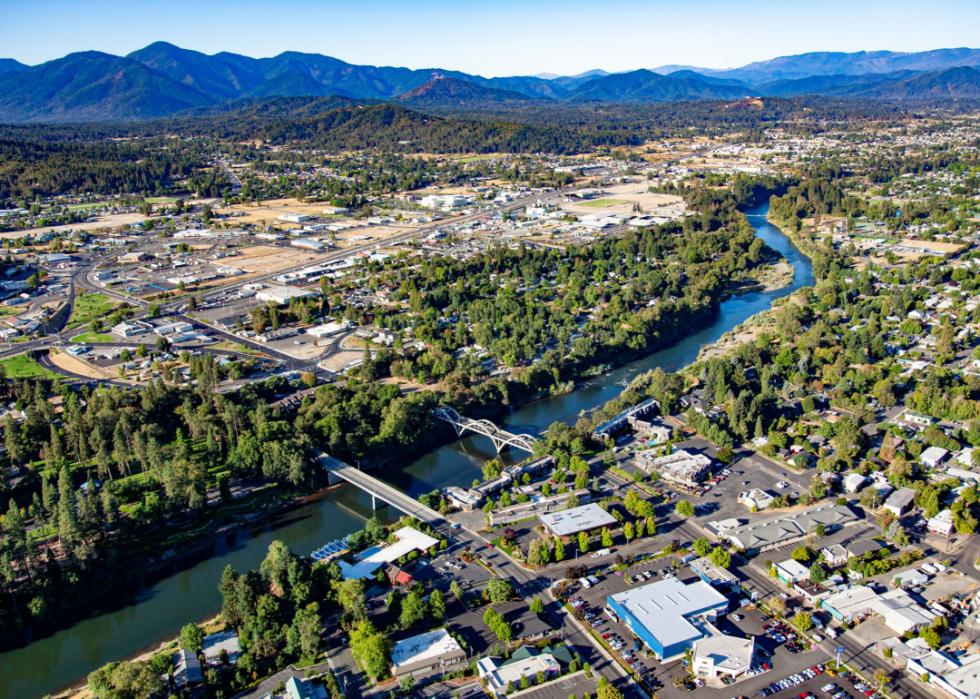
#5. Josephine County

Dominic Gentilcore PhD // Shutterstock
- Age-adjusted rate of all strokes among adults, estimates for 2021: 3.2% (range between 2.8% and 3.6%)
- Death rate for ischemic strokes, 2018-20: 17.7 per 100K people
- Death rate for hemorrhagic strokes, 2018-20: 9.0 per 100K people
- Death rate for ischemic strokes, 2018-20: 17.7 per 100K people
- Death rate for hemorrhagic strokes, 2018-20: 9.0 per 100K people
#4. Lake County
Canva
- Age-adjusted rate of all strokes among adults, estimates for 2021: 3.2% (range between 2.8% and 3.6%)
- Death rate for ischemic strokes, 2018-20: 23.8 per 100K people
- Death rate for hemorrhagic strokes, 2018-20: 7.9 per 100K people
- Death rate for ischemic strokes, 2018-20: 23.8 per 100K people
- Death rate for hemorrhagic strokes, 2018-20: 7.9 per 100K people
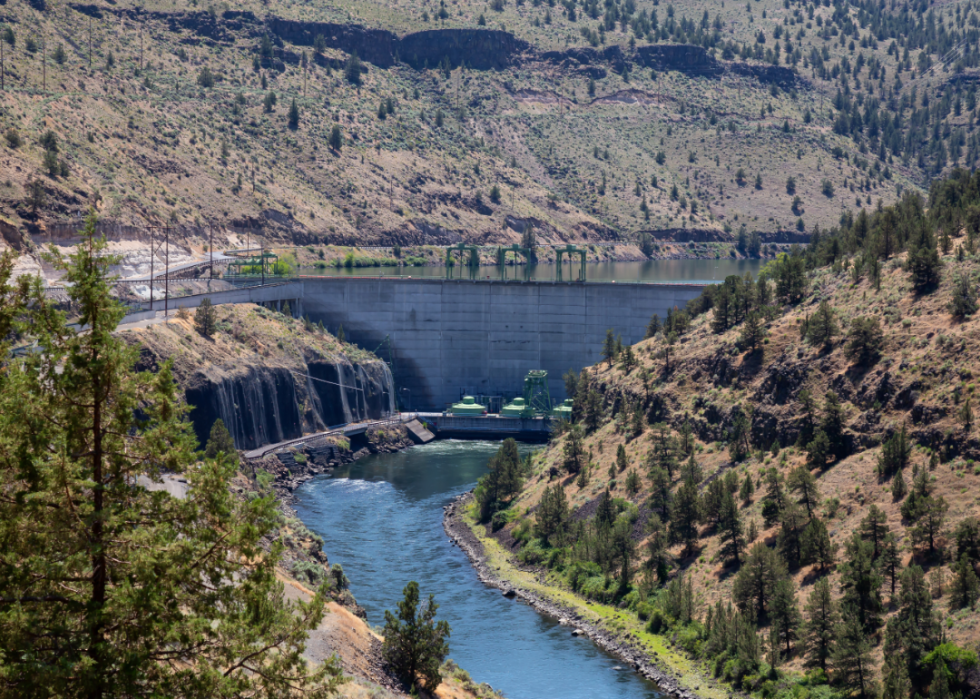
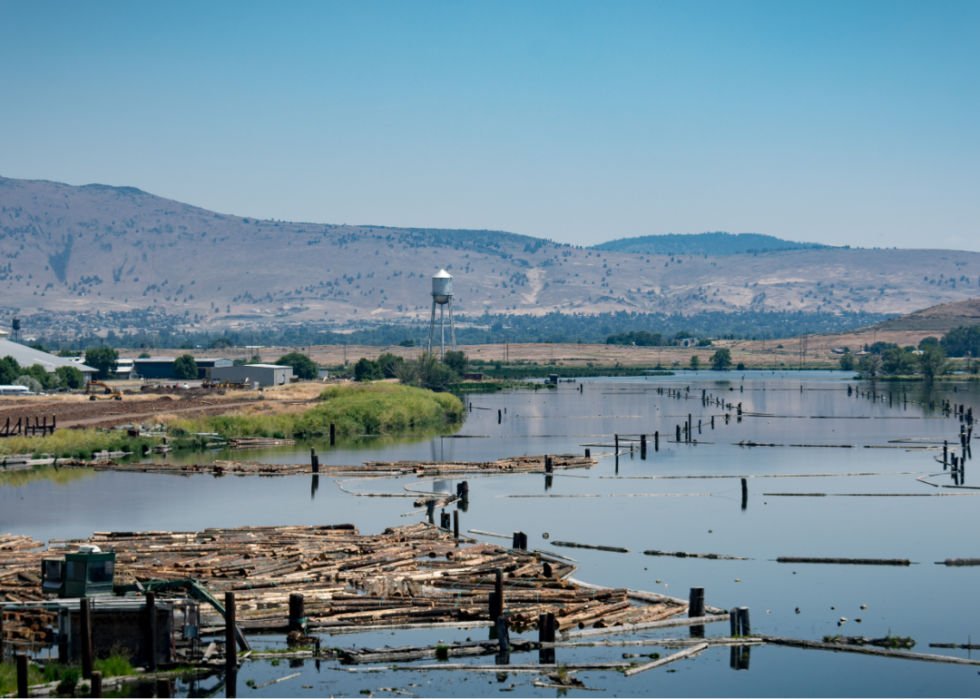
#3. Klamath County
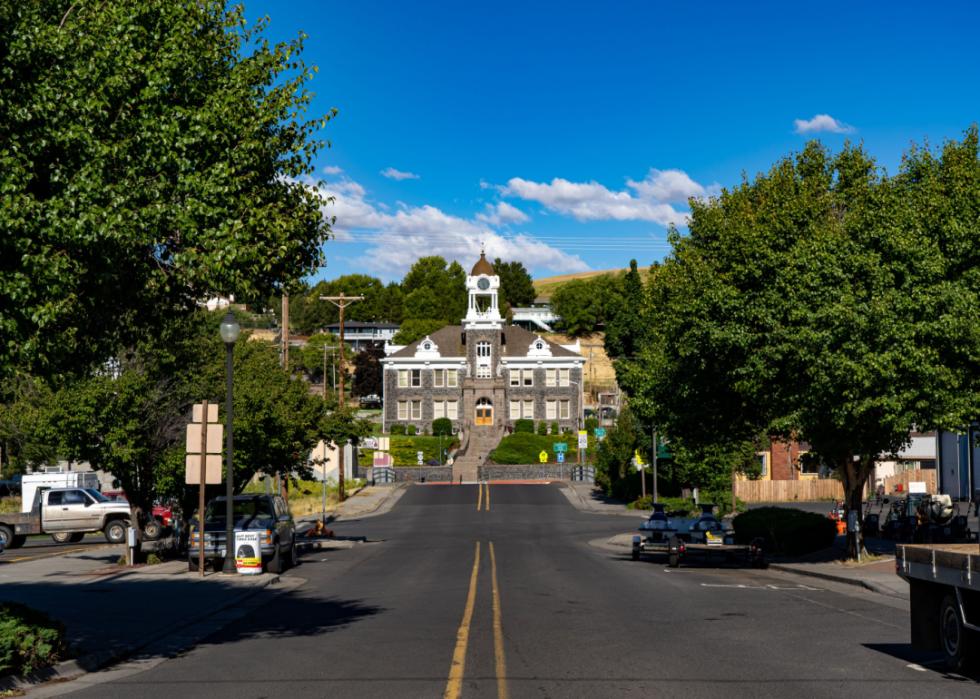
Bob Pool // Shutterstock
- Age-adjusted rate of all strokes among adults, estimates for 2021: 3.3% (range between 2.9% and 3.7%)
- Death rate for ischemic strokes, 2018-20: 19.0 per 100K people
- Death rate for hemorrhagic strokes, 2018-20: 9.2 per 100K people
- Death rate for ischemic strokes, 2018-20: 19.0 per 100K people
- Death rate for hemorrhagic strokes, 2018-20: 9.2 per 100K people
You may also like: Best counties to retire to in Oregon
#2. Morrow County
Hugh K Telleria // Shutterstock
- Age-adjusted rate of all strokes among adults, estimates for 2021: 3.4% (range between 3.0% and 3.8%)
- Death rate for ischemic strokes, 2018-20: 16.9 per 100K people
- Death rate for hemorrhagic strokes, 2018-20: 7.1 per 100K people
- Death rate for ischemic strokes, 2018-20: 16.9 per 100K people
- Death rate for hemorrhagic strokes, 2018-20: 7.1 per 100K people
This story features data reporting and writing by Emma Rubin and is part of a series utilizing data automation across 49 states.
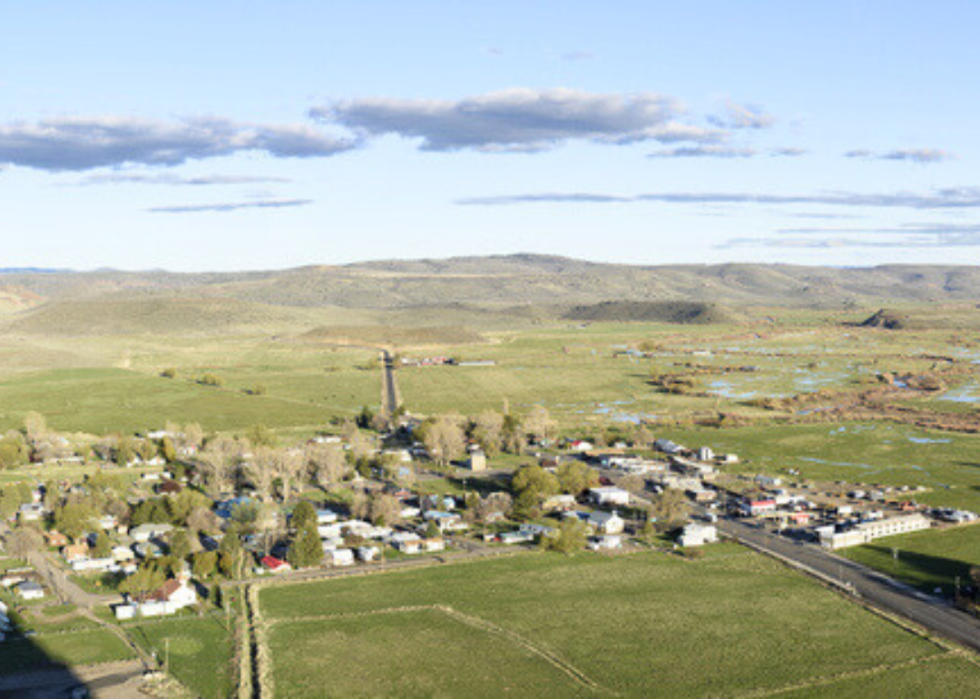
#1. Malheur County

Canva