Counties with the most bridges in dire need of repair in Oregon

- Bridges in poor condition: 3.8% (14 of 371 bridges)
- Square meters of bridges in poor condition: 1.6% (4,165 of 265,461 square meters of bridges)

- Bridges in poor condition: 3.9% (14 of 363 bridges)
- Square meters of bridges in poor condition: 1.7% (4,708 of 282,265 square meters of bridges)
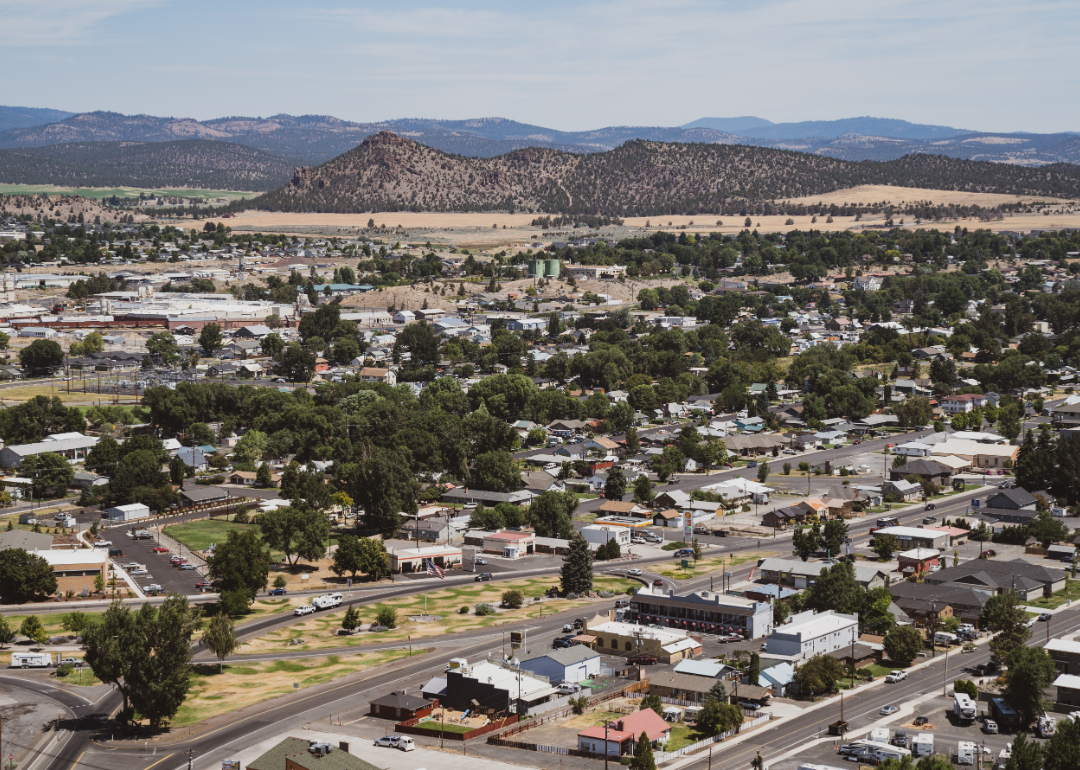
- Bridges in poor condition: 4.0% (3 of 75 bridges)
- Square meters of bridges in poor condition: 1.9% (299 of 15,371 square meters of bridges)

- Bridges in poor condition: 4.0% (4 of 100 bridges)
- Square meters of bridges in poor condition: 3.1% (2,039 of 65,533 square meters of bridges)
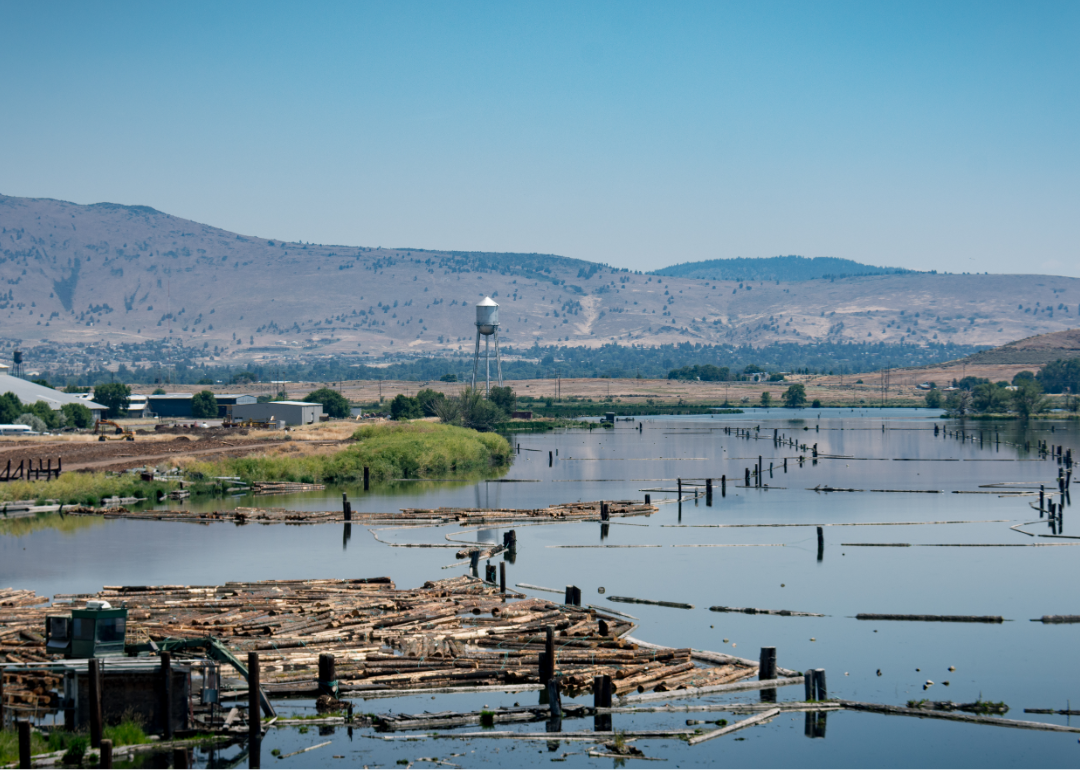
- Bridges in poor condition: 4.4% (11 of 249 bridges)
- Square meters of bridges in poor condition: 1.7% (1,692 of 101,991 square meters of bridges)

- Bridges in poor condition: 4.7% (10 of 214 bridges)
- Square meters of bridges in poor condition: 2.6% (2,152 of 84,315 square meters of bridges)

- Bridges in poor condition: 4.8% (6 of 126 bridges)
- Square meters of bridges in poor condition: 3.4% (1,905 of 56,068 square meters of bridges)
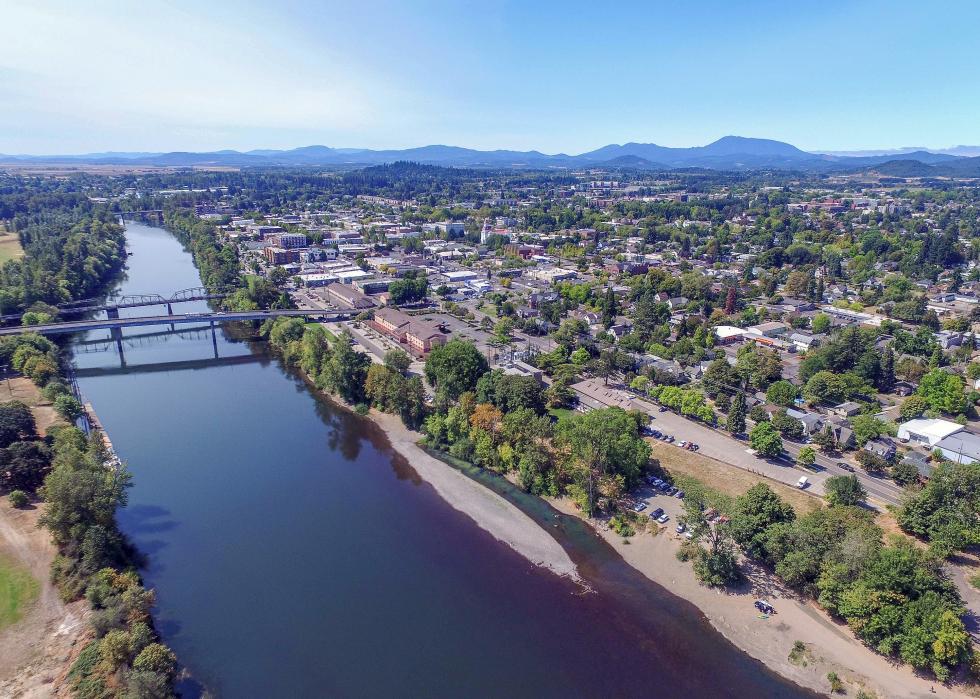
- Bridges in poor condition: 4.8% (9 of 187 bridges)
- Square meters of bridges in poor condition: 4.6% (3,375 of 73,084 square meters of bridges)

- Bridges in poor condition: 5.4% (8 of 149 bridges)
- Square meters of bridges in poor condition: 5.1% (4,906 of 97,112 square meters of bridges)

- Bridges in poor condition: 5.5% (5 of 91 bridges)
- Square meters of bridges in poor condition: 2.2% (318 of 14,257 square meters of bridges)

- Bridges in poor condition: 6.2% (10 of 161 bridges)
- Square meters of bridges in poor condition: 3.7% (2,201 of 58,846 square meters of bridges)

- Bridges in poor condition: 6.3% (9 of 143 bridges)
- Square meters of bridges in poor condition: 3.3% (1,026 of 31,545 square meters of bridges)
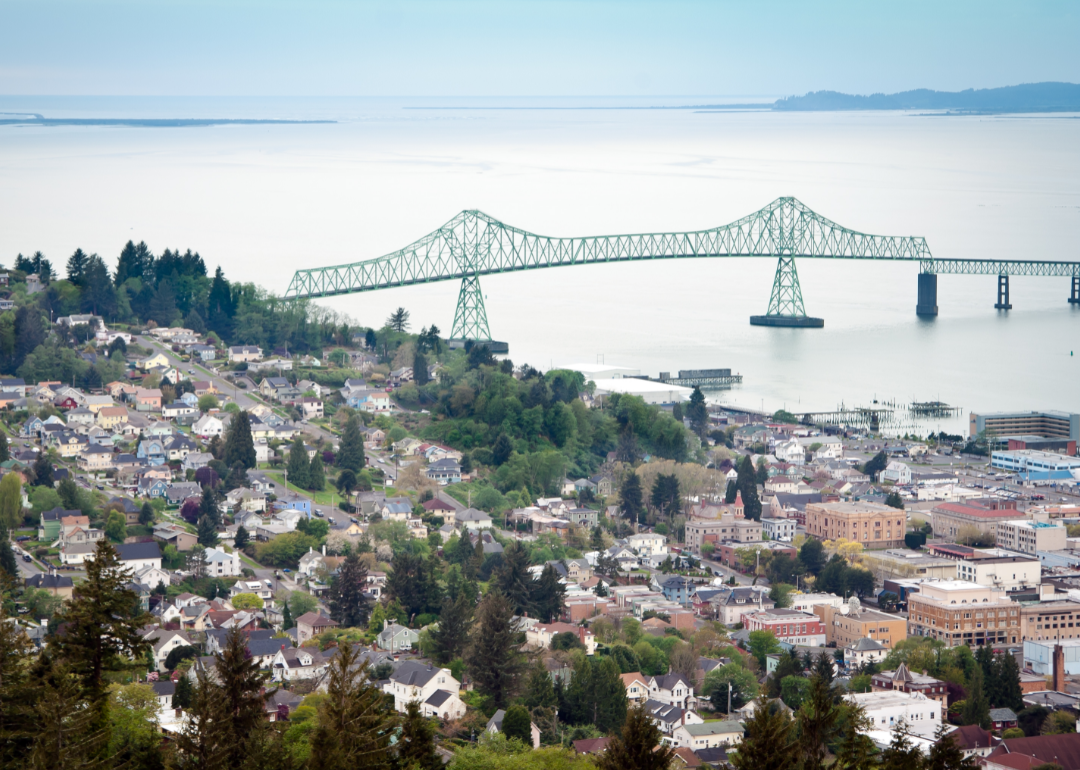
- Bridges in poor condition: 6.4% (10 of 156 bridges)
- Square meters of bridges in poor condition: 6.3% (10,351 of 164,872 square meters of bridges)

- Bridges in poor condition: 6.4% (21 of 326 bridges)
- Square meters of bridges in poor condition: 2.8% (4,608 of 163,909 square meters of bridges)
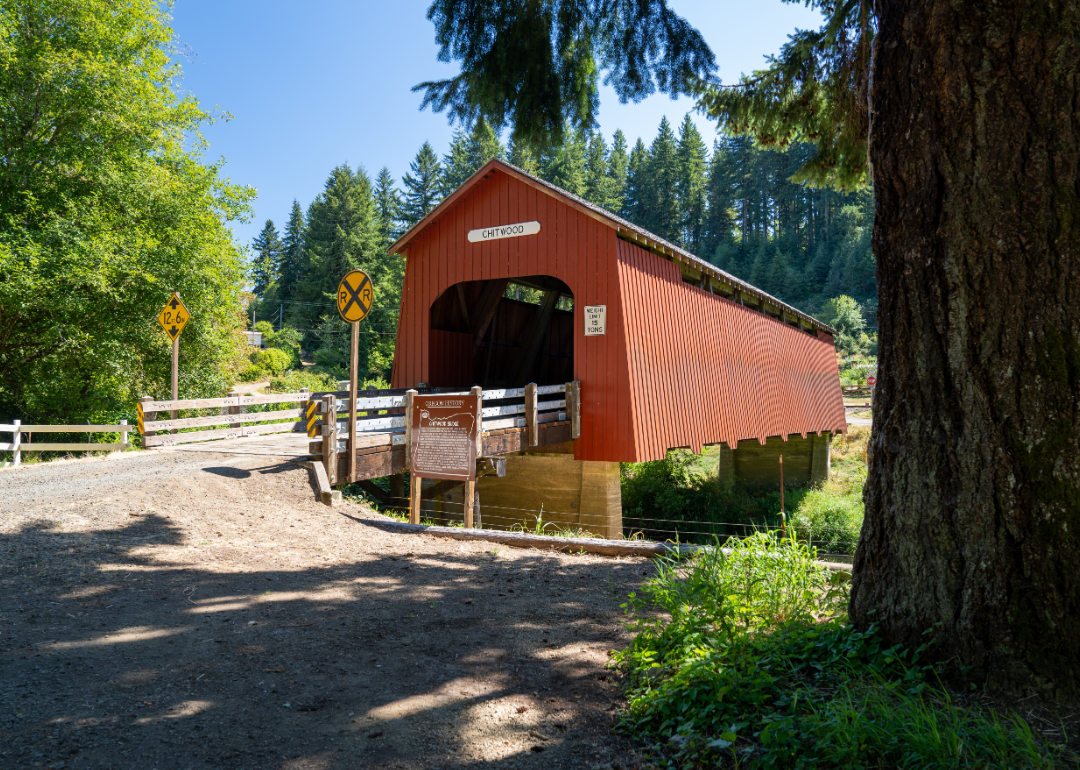
- Bridges in poor condition: 6.9% (13 of 189 bridges)
- Square meters of bridges in poor condition: 6.0% (6,554 of 108,565 square meters of bridges)
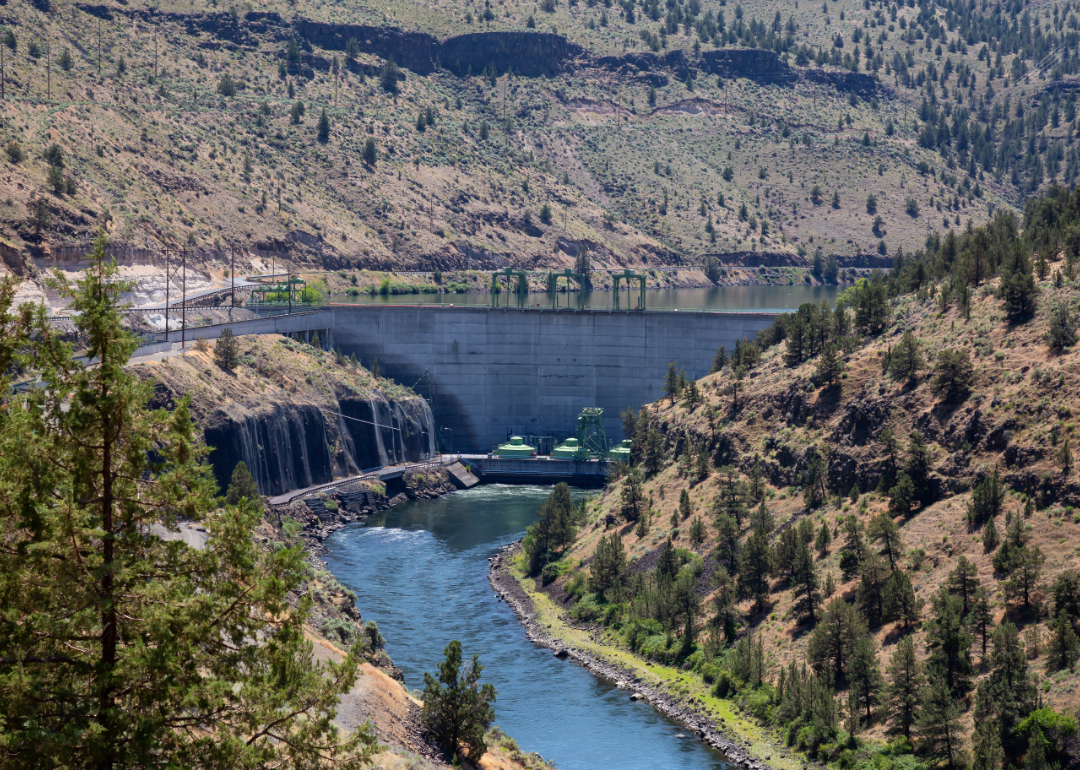
- Bridges in poor condition: 7.9% (6 of 76 bridges)
- Square meters of bridges in poor condition: 3.8% (813 of 21,351 square meters of bridges)
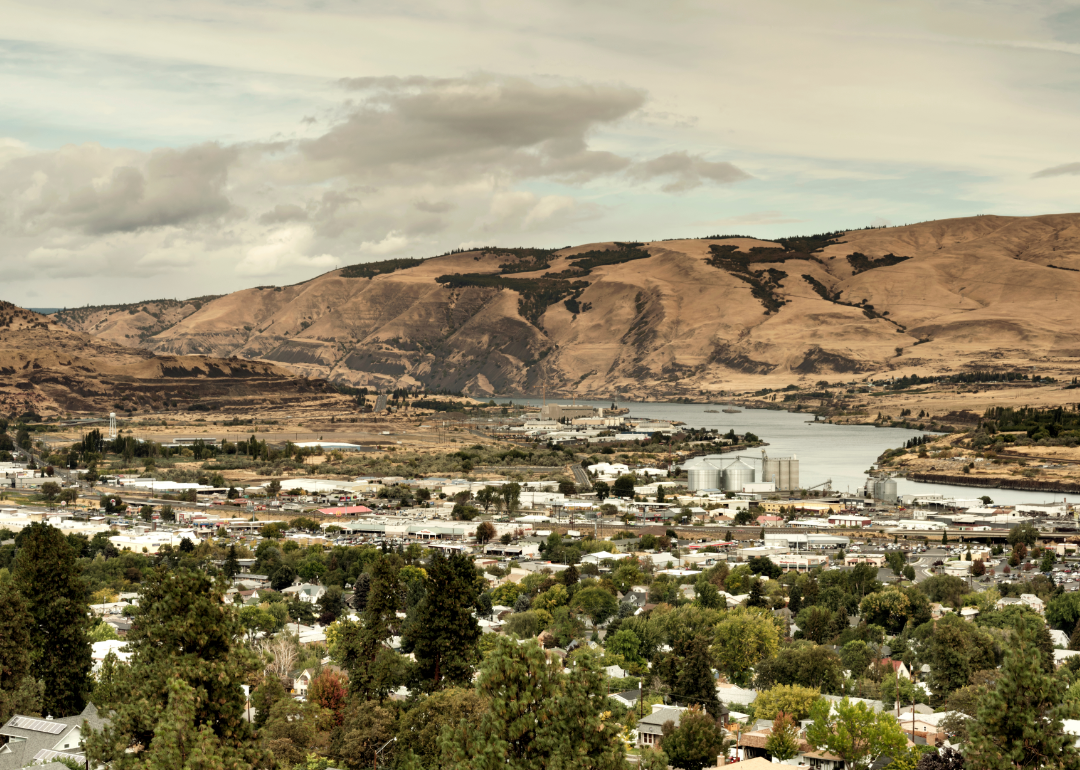
- Bridges in poor condition: 8.0% (12 of 150 bridges)
- Square meters of bridges in poor condition: 13.4% (11,334 of 84,559 square meters of bridges)
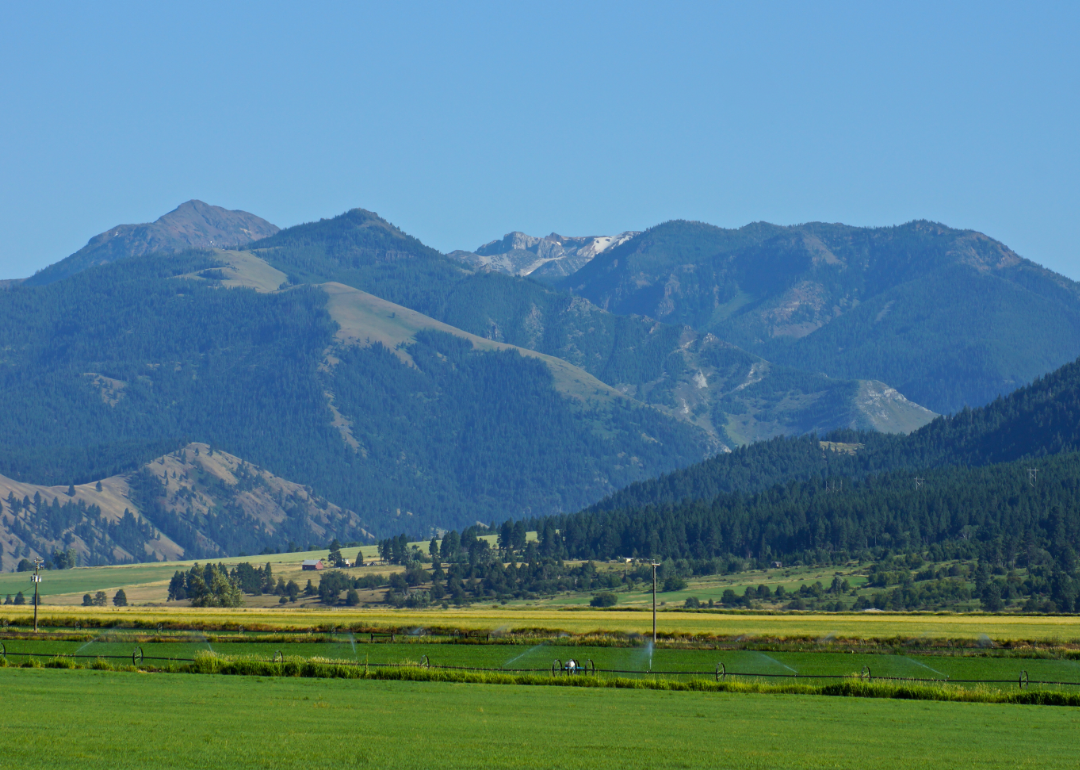
- Bridges in poor condition: 8.2% (9 of 110 bridges)
- Square meters of bridges in poor condition: 4.9% (966 of 19,893 square meters of bridges)

- Bridges in poor condition: 8.5% (16 of 188 bridges)
- Square meters of bridges in poor condition: 3.6% (2,790 of 77,572 square meters of bridges)
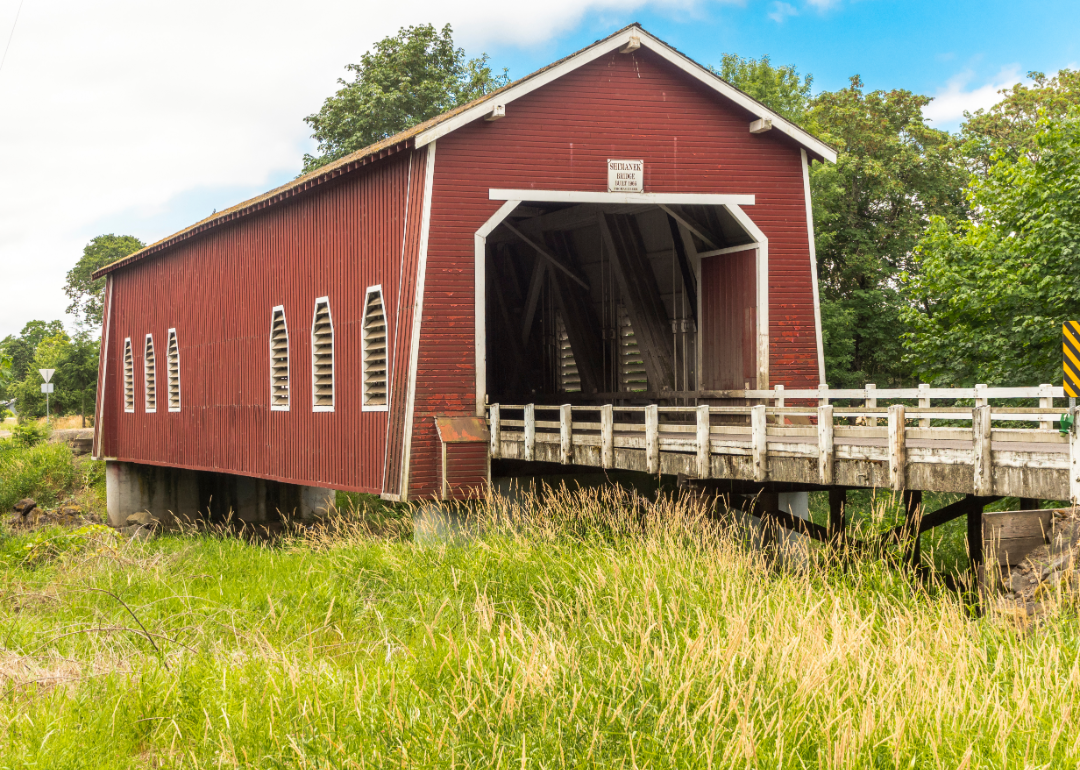
- Bridges in poor condition: 17.5% (99 of 565 bridges)
- Square meters of bridges in poor condition: 10.1% (20,906 of 207,565 square meters of bridges)
